Sato and Une Earth, Planets and Space (2016) 68:47 DOI 10.1186/s40623-016-0425-1
FULL PAPER
Detection of the 2015 Gorkha
earthquake-induced landslide surface
deformation in Kathmandu using InSAR images
from PALSAR-2 data
Hiroshi P. Sato
1*and Hiroshi Une
2Abstract
Previous studies reported that the 2015 Gorkha earthquake (Mw 7.8), which occurred in Nepal, triggered landslides in mountainous areas. In Kathmandu, earthquake-induced land subsidence was identified by interpreting local phase changes in interferograms produced from Advanced Land Observing Satellite-2/Phased Array type L-band Synthetic Aperture Radar-2 data. However, the associated ground deformation was not discussed in detail. We studied line-of-sight (LoS) changes from InSAR images in the SE area of Tribhuvan International Airport, Kathmandu. To obtain the change in LoS caused only by local, short-wavelength surface deformation, we subtracted the change in LoS attributed to coseismic deformation from the original change in LoS. The resulting change in LoS showed that the river terrace was driven to the bottom of the river valley. We also studied the changes in LoS in both ascending and descending InSAR images of the area along the Bishnumati River and performed 2.5D analysis. Removing the effect of coseismic deformation revealed east–west and up–down components of local surface deformation, indicating that the river terrace deformed eastward and subsided on the western riverbank of the river. On the east riverbank, the river terrace deformed westward and subsided. However, in the southern part of the river basin, the river terrace deformed westward and was uplifted. The deformation data and field survey results indicate that local surface defor-mation in these two areas was not caused by land subsidence but by a landslide (specifically, lateral spread).
Keywords: Landslide, Earthquake, Liquefaction, Lateral spread, Land subsidence, Gorkha, Nepal, PALSAR-2, InSAR
© 2016 Sato and Une. This article is distributed under the terms of the Creative Commons Attribution 4.0 International License (http://creativecommons.org/licenses/by/4.0/), which permits unrestricted use, distribution, and reproduction in any medium, provided you give appropriate credit to the original author(s) and the source, provide a link to the Creative Commons license, and indicate if changes were made.
Background
The Gorkha earthquake in Nepal (Mw 7.8) occurred on April 25, 2015. Its hypocenter was 82 km northwest of Kathmandu and 8.2 km deep (US Geological Survey
2015). The earthquake yielded a maximum coseismic displacement of 1.2 m (Geospatial Information Author-ity of Japan 2015). Collins and Jibson (2015) reported that earthquake-induced landslides occurred in mountain-ous areas in Nepal, and Kargel et al. (2015) stated that the number of coseismic and post-seismic landslides was 4312. Yagi and Okuwaki (2015) suggested that a
high-frequency (around 1 Hz) source may have contrib-uted to the damage in and around Kathmandu.
JAXA (2015) used Advanced Land Observing Satel-lite-2 (ALOS-2)/Phased Array type L-band Synthetic Aperture Radar-2 (PALSAR-2) data obtained in Kath-mandu before and after the earthquake to produce the corresponding interferograms. They identified local phase changes from these interferograms and concluded that the changes were caused by land subsidence. In con-trast, based on their field survey in the SE area of Tribhu-van International Airport (hereafter referred to as TIA) in Kathmandu, Higaki et al. (2015) reported that land deformation on the Araniko Highway was not caused by land subsidence but by a landslide.
Despite the abovementioned studies, few previous studies have clearly identified quantitative deformation in
Open Access
*Correspondence: satou.hiroshi37@nihon-u.ac.jp
Page 2 of 13 Sato and Une Earth, Planets and Space (2016) 68:47
Kathmandu. In recent decades, spaceborne interferomet-ric SAR (InSAR) has shown great potential for the inves-tigation of landslides (Sun et al. 2015a). This study aims to identify the damaged areas and their possible causes using InSAR with PALSAR-2 data.
PALSAR‑2 data
Table 1 shows the PALSAR-2 data used in this study. Compared with C-band SAR data (e.g., ENVISAT/ASAR images), L-band SAR data are preferred for the investiga-tion of landslides due to their satisfactory preservainvestiga-tion of correlation in mountain environments (Zhao et al. 2012). Regardless of the direction of the ALOS-2 orbit, all data used in this study were obtained from the antenna on the right side of the ALOS-2 orbit. Figure 1 illustrates the coverage areas of the PALSAR-2 data used in this study; the background image is the hill shade produced from a digital elevation model (DEM) by Shuttle Radar Topog-raphy Mission (SRTM). Area A is path 157, and area B is path 49. Data from path 49 have an off-nadir angle of 29.1° and a 3-m resolution in Stripmap Ultrafine [3 m] mode. Data from path 157 have an off-nadir angle of 32.5° and a 10-m resolution in Stripmap Fine [10 m] mode.
Figure 2 shows Kathmandu including TIA and Bishnu-mati River. The background elevation data are from the Advanced Spaceborne Thermal Emission and Reflection Radiometer (ASTER) Global DEM (GDEM). In the SE area of TIA in Kathmandu, we used PALSAR-2 data from path 157, which was in ascending orbit.
For the area along Bishnumati River in Kathmandu, we used PALSAR-2 data of path 157 along with path 49. The path 49 data were observed in descending orbit; there-fore, the data from both orbits were available.
Methods InSAR processing
InSAR images were produced from the PALSAR-2 data obtained before and after the earthquake. To eliminate the topographic phase, a 90-m-resolution SRTM-DEM was used in the study area.
We used RINC version 0.31 software (Ozawa 2014) to produce the images and performed an 8-look process
in azimuth and a 4-look process in range. We employed multi-look processing in order to reduce speckle noise and ultimately improve phase accuracy; therefore, the detected landslide size was 40 m × 40 m or more. Raspini et al. (2015) used the SqueeSAR technique, which exploits both point-wise coherent scatterers and partially coherent distributed scatterers (DS), to discuss landslide surface deformation at a resolution of 3 m. To detect landslide surface deformation, Sun et al. (2015a) used a temporarily coherent point InSAR (TCPInSAR) technique. However, such coherent points are not always densely and uniformly distributed in the landslide sites. This study intends to illustrate a rough sketch of land-slide surface deformation distribution with spatial uni-formity; therefore, we used a conventional multi-look InSAR technique. The filtering intensity and processing window size (Goldstein and Werner 1998) were 1.0 and 16 pixels, respectively. Next, we unwrapped the phase data for the entire A and B areas (Fig. 1) using SNAPHU software (Chen and Zebker 2002). Finally, we examined the line-of-sight (LoS) changes in the unwrapped phase data.
Removal of long‑wavelength coseismic deformation
The unwrapped phase data yielded changes in LoS that included both local surface deformation (short wave-length) and coseismic deformation (long wavewave-length). Therefore, to quantify the local surface deformation based on the changes in LoS, we removed the long-wave-length surface deformation due to coseismic faulting (Une et al. 2008; Sato et al. 2014).
In the SE area of TIA in Kathmandu, we removed the coseismic deformation and examined the changes in LoS for a 63-m interval along line 1 (2.5 km long; Figs. 1, 2) and a 60-m interval along line 2 (2.3 km long; Figs. 1, 2). JAXA (2015) reported land subsidence on Araniko High-way at the red cross in Fig. 2, which is the same location reported by Higaki et al. (2015).
The removal of coseismic deformation was based on the following rationale. The changes in LoS along line 1 were thought to primarily include the effect of long-wavelength coseismic deformation, while those along line 2 were thought to include the effects of both coseis-mic and local surface deformations. If local surface deformation did not occur along line 2, the phase change along line 2 would resemble that along line 1, with remarkable phase changes in NS directions. The changes in LoS were compared at a point from north to south between lines 1 and 2. The change in LoS at a point on line 2 was then subtracted from that at a comparable point on line 1. This yielded the estimated change in LoS along line 2 caused only by the effect of local surface deformation.
Table 1 PALSAR‑2 data (master/slave) used in this study
Bperp means a perpendicular baseline
Des descending orbit, Asc ascending orbit, R right-side observation
Path Frame Master/slave Orbit BPERP (m)
Page 3 of 13 Sato and Une Earth, Planets and Space (2016) 68:47
2.5D analysis
In the area along the Bishnumati River, we removed the coseismic deformation in a different way than in the SE area of TIA. We changed the method such that it would be possible to consider local surface deformation not only in the LoS direction but also in the EW and UD directions, as combining ascending and descending PALSAR-2 data. The descending PALSAR-2 data are not available in the SE area of TIA.
We performed 2.5D analysis (Fujiwara et al. 2000) using both the ascending and descending LoS change data. The geometry of the 2.5D analysis is shown in Fig. 3 (Geo-graphical Survey Institute 2004, revised). The combina-tion of ascending–descending LoS intersects at one point on the ground, and the point is also on the LoS plane (Fig. 3), which is nearly vertically present in EW direc-tion. This enables the 2D deformation description on the LoS plane. The deformation vector was divided into quasi east–west (EW) and up–down (UD) components; there-fore, the 2.5D analysis yielded deformation data with EW and UD components. Raspini et al. (2015) revealed 3D deformation vectors (EW, UD, and NS) using COSMO-SkyMed SAR; however, for ALOS-2, the deformations
in the NS component are the most difficult to detect due to the polar orbit of the satellite (satellite inclination angle = 97.9°) (Sun et al. 2015b).
2.5D analysis can be performed in the area where the ascending and descending InSAR images from PAL-SAR-2 data overlap; therefore, 2.5D analysis was per-formed in the area of overlap between areas A and B (Fig. 1). Since the 2.5D analysis results include both coseismic deformation and local surface deformation, we removed the coseismic deformation from the result. Before the removal and after the 2.5D analysis, we esti-mated the EW and UD components of coseismic defor-mation by linear and spline interpolation. The reason we tried two methods of interpolation is to select the better removal result that reduces the area wherein remnants of long-wavelength coseismic deformation are present.
When interpolating the coseismic deformation, we carefully selected the fixed points in Fig. 4 at which the phase changes show long-wavelength coseismic deforma-tion. However, the overlapping area shown in Fig. 1 was wide, and it was difficult to uniformly select many fixed points throughout the entire overlapping area. Therefore, as shown in Fig. 1, we focused on area C to detect local
Page 4 of 13 Sato and Une Earth, Planets and Space (2016) 68:47
surface deformation in Kathmandu; 27 fixed points were selected in area C.
We then subtracted the interpolated EW and UD com-ponents of the deformation data from the original EW and UD components (both coseismic and local surface) of the deformation data to obtain the EW- and UD-com-ponent (local surface) deformation data. Finally, we drew deformation vectors based on the obtained data at 200-m
intervals on the eight measurement lines (arrays of open circles in Fig. 2, six of which were 5 km and two of which were 2.6 km) and examined the relationship between the vectors and a cross section of the local topography.
Results
Landslide surface deformation in the SE area of TIA
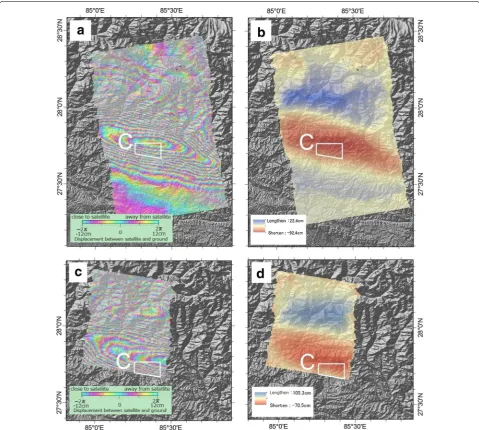
Figure 4a and c shows the InSAR images produced for areas A and B shown in Fig. 1, and Fig. 4b and d shows the unwrapped phases from Fig. 4a and c, respectively. Figure 5 illustrates the magnified InSAR image of Fig. 4a (in and around area C in Fig. 1). The location in the SE area of TIA reported by JAXA (2015) is delineated by white-edged rectangles in Fig. 5.
Figure 6a shows the changes in LoS along lines 1 and 2, as shown in Figs. 1 and 2. We investigated the changes in LoS using only Fig. 4b because Fig. 4d did not cover the entireties of lines 1 and 2. The abscissa is the dis-tance from the northern end of each line. In Fig. 6a, both the ‘shorten’ and ‘lengthen’ values are negative because the unwrapped area was wide, and the area where LoS change was recorded as zero (i.e., no coseismic defor-mation occurred) was far south of the lines, as shown in Fig. 4b. A large negative ordinate value indicates that the surface was close to the satellite. As shown in Fig. 6a, the LoS length uniformly shortened following the abscissa to
Fig. 2 Location of lines 1 and 2 and measurement lines (array of open circles) of 2.5D analysis. The road and river were traced with OpenStreetMap
Fig. 3 Geometry of 2.5D analysis (Geographical Survey Institute
Page 5 of 13 Sato and Une Earth, Planets and Space (2016) 68:47
the left (i.e., the location shifted to the north). This indi-cates that the coseismic deformation had a long-wave-length component. However, the change in LoS along line 2 indicates a short-wavelength component. Thus, both long-wavelength coseismic deformations and local surface deformations were involved.
Based on the above analysis, we considered that the change in LoS along line 2 was affected by both coseismic and local surface deformations. The open circles shown in Fig. 6b indicate the difference between the changes in LoS along lines 1 and 2. The data show that the LoS
change along line 2 was within ±3.7 cm at a distance of
1400 m or more along the abscissa, where the valley bot-tom area, including the Hanumante River to its south, is located. In other words, the bottom of the river valley was not deformed. We also noted the tendency of the surface to deform to the east or subside at 100–1000 m along the abscissa, and the amount of deformation increased from 100 to 1000 m along the abscissa.
The gray circles shown in Fig. 6b indicate a cross section of local topography based on GDEM; they show that shal-low valleys indent the surface of the river terrace at about
Page 6 of 13 Sato and Une Earth, Planets and Space (2016) 68:47
350 m along the abscissa. The elevation of the bottom of these shallow valleys is 5–10 m lower than the top sur-face of the river terrace (1305–1308 m in elevation). These shallow valleys did not disturb this tendency that the amount of the deformation increased from 100 to 1000 m along the abscissa. This means that the surface deforma-tion occurred at least in an area of one square kilometer.
Land subsidence can occur via the upward pumping of underground water (Sato et al. 2003) and cause surface deformation over a wide area; however, if land subsidence was the main cause of the local deformation in the study area, the valley bottom of the Hanumante River would have subsided. Therefore, we concluded that this phe-nomenon is better explained by a landslide; specifically,
Page 7 of 13 Sato and Une Earth, Planets and Space (2016) 68:47
it can be explained by lateral spread (Varnes 1978), which commonly occurs on gentle slopes and is characterized by fluid-like flow movement.
A remaining trace of liquefaction also supports our explanation. Google Earth high-resolution optical satel-lite images were obtained on December 18, 2014 (before the earthquake), and May 3, 2015 (immediately after the earthquake; Fig. 7). The location shown in Fig. 7 is indi-cated by a black-edged square in Fig. 5. A sand boil was found at the bottom of the valley of the Hanumante River, as indicated by the red circle in Fig. 7b. This means that lacustrine stratum (Sakai 2001) underlying the valley bot-tom was liquefied or that the lower part of the terrace was deformed by lateral spread. In the past, a gentle slope on a sand dune was reported to be deformed by the lateral spread caused by the M7.7 Middle Japan Sea Earthquake in 1983 (Geographical Survey Institute 1984). We consid-ered the landslide surface deformation in Kathmandu to represent a similar scenario.
Landslide surface deformation in the area along the Bishnumati River
The area along the Bishnumati River reported by JAXA (2015) is delineated by the white-edged rectangle in
Fig. 5; here, the Bishnumati River flows from north to south in the center of the rectangle. JAXA (2015) also reported that the ground surface at the rectangle moved by up to 30 cm along the LoS compared to the outside of the rectangle.
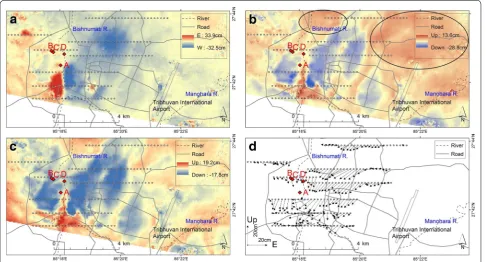
Figure 8 shows the results of 2.5D analysis for the area of overlap between areas A and B (Fig. 1). Figure 8a and b shows EW and UD components of deformation, respec-tively. Figure 9 shows the interpolated coseismic defor-mation for area C (Fig. 1), as explained in the method. Figure 9a and b shows the EW and UD components of deformation obtained by linear interpolation, and Fig. 9c and d shows those obtained by spline interpolation. We selected linear interpolation for the EW component of deformation because the SW area of Fig. 9c (spline inter-polation) showed an unnatural, nearly non-displaced area surrounded by a westward-displaced area. We selected spline interpolation for the UD component of deforma-tion (Fig. 9d), and the reason for avoiding Fig. 9b (linear interpolation) will be described in the next paragraph.
Subtracting Fig. 9a from Fig. 8a, we obtained Fig. 10a for area C (i.e., the EW component of the resulting land-slide surface deformation). Subtracting Fig. 9b from Fig. 8b gave Fig. 10b (linear interpolation), subtracting
Fig. 6 Displacement profiles along cross-sectional lines. a LoS changes for lines 1 and 2. b Difference of LoS changes (open circles) between line 1 and line 2 and the overlaid cross section of local topography (gray dots)
Page 8 of 13 Sato and Une Earth, Planets and Space (2016) 68:47
Fig. 9d from Fig. 8b gave Fig. 10c (spline interpola-tion), and Fig. 10b and c shows the UD component of the deformation. By comparing Fig. 10b with Fig. 10c, uplift area widely extends in the north area of TIA (large black-edged ellipsoid in Fig. 10b) and upstream of the Bishnumati River (small black-edged ellipsoid). We assumed that such extended uplift area is explained not by local surface deformation but by remains of long-wavelength coseismic deformation. Therefore, we selected Fig. 9d as interpolation of UD component of deformation and Fig. 10c for the UD component of local surface deformation. The deformation vectors rep-resenting both the EW and UD components are shown in Fig. 10d. On the west riverbank, the river terrace deformed eastward and subsided at the second-north-ernmost measurement lines.
On the east riverbank, the river terrace deformed westward and subsided significantly. However, on the southernmost measurement lines and the sec-ond-southernmost measurement lines, the river ter-race also deformed westward and uplifted to the river; however, the magnitude of deformation was smaller than those along other lines. In short, the river terrace sloping down to the Bishnumati River deformed toward the river. This deformation cannot be explained by simple land subsidence; the lateral spread that caused the landslide surface deformation along the Bishnumati River was the same as that in the SE area of TIA.
Discussion
UD and EW components of deformation reveal local phenomena
Kargel et al. (2015) showed the UD component of defor-mation using ascending interferograms of PALSAR-2 data in Stripmap Fine [10 m] mode. They also revealed the horizontal deformation between April 5 and 29, 2015, using the descending interferogram of RADARSAT-2 and reported that the region displaced southward exceeded the region displaced northward in the study area. How-ever, they did not simultaneously combine and calculate the EW and UD components of deformation. Further-more, the descending interferogram does not cover Kath-mandu. In this study, we successfully showed not only UD component but also EW component of deforma-tion in Kathmandu, simultaneously, and we also showed that the EW component of deformation has westward displacement. Kargel et al. (2015) stated that southward deformation was more remarkable than deformation in the EW direction; however, it is important to reveal the EW component of deformation in Kathmandu to under-stand local phenomena like landslide surface deforma-tion. Kobayashi et al. (2015) performed 2.5D analysis using ScanSAR mode (descending) and Stripmap Fine [10 m] mode to construct a fault model. However, to the best of our knowledge, no studies have revealed the UD and EW components of deformation in Kathmandu using Stripmap Fine [10 m] and Ultrafine [3 m] modes to study local surface deformation.
Page 9 of 13 Sato and Une Earth, Planets and Space (2016) 68:47
Limitations of this study and the use of DEM to reduce topographic error
Using advanced time series analysis techniques such as SqueeSAR and TICInSAR, Raspini et al. (2015) and Sun et al. (2015a) successfully investigated temporal landslide surface deformation. However, the lack of time series PALSAR-2 data prevents us from obtaining the temporal changes in local surface deformation in this study.
Topographic error should be removed from our results. For example, the 90-m-resolution SRTM-DEM used in this study may be too coarse to obtain InSAR images. Recently, 5-m-resolution ALOS World 3D DEM pro-duced from ALOS/PRISM data has become available (NTT Data Corporation 2015); therefore, we think it is worthwhile to use a high-resolution DEM to decrease topographic error.
Effect of land subsidence before the earthquake
Excessive groundwater pumping causes the groundwater level to drop rapidly, and land subsidence often occurs due to the consolidation of subsurface clay layers result-ing from the reduction in pore water pressure (Sato et al.
2003). In Kathmandu, deep wells have been drilled since
1960, and in the central area, the groundwater level in dry season has decreased 1.0 m at a minimum and 5.7 m at a maximum between 2000 and 2008 (Pandey et al. 2010). However, according to their study, to date, no evidence of land subsidence has been reported.
We produced a InSAR image from PALSAR-2 data observed twice before the earthquake (Table 1: October 4, 2014/February 21, 2015). The result (Fig. 11a) shows two depression areas, which are delineated by bold dashed lines. These areas indicate land subsidence caused by wells G10 and H17 (Pandey et al. 2010; Fig. 11a), which are located in the northern and western depres-sion areas, respectively. As shown in Fig. 11b, these land subsidence areas are not included in the area of landslide surface deformation along the east and west riverbanks of the Bishnumati River.
According to Pandey et al. (2010), water levels in Kath-mandu generally start rising in June/July (monsoon sea-son) and decrease in November/December (dry seasea-son). Based on well-observation data around the northern depression area, they also demonstrated that the ground-water level in the dry season was ca. 5 m lower than that in the monsoon season. The Gorkha earthquake
Page 10 of 13 Sato and Une Earth, Planets and Space (2016) 68:47
occurred in the dry season; however, if the earthquake had occurred in the monsoon season, more lateral spread may have occurred due to the high groundwater level (Higaki et al. 2015).
Field survey in November 2015
To confirm landslide surface deformation, we conducted a field survey on the east and west riverbanks of the Bish-numati River. Because many months had passed since the Gorkha earthquake, it was difficult to directly trace surface deformation (e.g., cracks on the ground) because pavement damaged by the earthquake-induced cracks had been repaired. Furthermore, the earthquake-induced cracks on the ground were often unclear because they were filled with debris and fine deposits during the mon-soon season. Although the amounts of displacement on the direct traces were comparable with the estimated amounts of displacement shown in Fig. 10, for the rea-son of non-observing direct ground trace, we observed indirect traces of surface deformation and measured the amounts of displacement for cracks and damages on buildings and public works facilities.
Figure 12a–d shows the photographs (taken on Novem-ber 5, 2015) corresponding to sites A–D in Figs. 10
and 11b), respectively. At site A, the step of the build-ing was depressed at 3 cm and moved slightly eastward.
According to the shop assistance, the depression was caused by the earthquake. The estimated displacement was 0.6 cm eastward with a depression of 4.9 cm. The estimated displacement amounts are averaged ground displacements within a multi-looked pixel resolution. At site B, where there was a top terrace, a brick wall exhib-ited cracks and moved eastward by 2 cm but no depres-sion was observed. The estimated displacement was 2.8 cm eastward with a depression of 4.5 cm. At site C, which was located at the bottom of the terrace, a concrete revetment was moved primarily eastward by 5 cm but no depression was observed. According to local residents, these cracks and damages were caused by the earthquake. The estimated displacement was 2.2 cm eastward with a depression of 2.6 cm.
The amounts of observed displacement in this field survey were in good agreement with the estimated EW components of displacement shown in Fig. 10; however, the observed and estimated depression amounts were not always in accordance. It is possible that cracks and damages measured in this field survey may not always represent the averaged ground displacements within a multi-looked pixel resolution, and more field surveys are needed to evaluate the estimated deformation amount.
On the opposite side (east riverbank), cracks and damage to the buildings were found, demonstrating
Page 11 of 13 Sato and Une Earth, Planets and Space (2016) 68:47
that the deformation was in the westward direction. At site D of Sobhavagbati Bridge, the conduit, which should lie straight along the bridge, was bent upstream. The amount of maximum displacement upstream was not precisely measured; however, the estimated amount of displacement was 0.3 cm eastward with a uplift of 0.9 cm at a point west of the bridge. At a point east of the bridge, the estimated amount of displace-ment was 1.6 cm westward with a depression of 1.4 cm. The estimated amount of shortening in the EW com-ponent of displacement was ca. 2 cm in total. Thus, the shortening likely contributed to the bending of the conduit. Furthermore, the abutment was broken, and a
freshly broken section was observed; the corresponding image is shown in the inset of Fig. 12d. Clear evidence of the cause of bending was not obtained in the field survey; however, if the bend was earthquake-induced, it implies that lateral spread on both sides of the river-bank moved to the river and pushed the bridge toward a nose-to-nose collision.
Conclusion
Taking the SE area of TIA in Kathmandu as the study area, we subtracted the change in LoS due to coseismic deformation from the original change in LoS change to obtain the change in LoS caused only by landslide surface
Page 12 of 13 Sato and Une Earth, Planets and Space (2016) 68:47
deformation. We inferred that the landslide and, more specifically, lateral spread drove the river terrace in the direction of the Hanumante River.
In the area along the Bishnumati River in Kathmandu, we performed 2.5D analysis using the changes in LoS in both ascending and descending PALSAR-2 data. We removed the effect of coseismic deformation to obtain the EW and UD components of landslide surface deformation. Based on our results, we drew vectors to indicate land-slide surface deformation in EW and UD components. On the west riverbank of the Bishnumati River, the river ter-race deformed eastward and subsided. On the east river-bank, the river terrace deformed westward and subsided.
However, in the southern part of the river basin, the river terrace deformed westward and was uplifted. We inferred that this phenomenon was caused not by land subsidence but by a landslide and, specifically, lateral spread.
Abbreviations
ALOS-2: Advanced Land Observing Satellite-2; PALSAR-2: Phased Array type L-band Synthetic Aperture Radar-2; LoS: line-of-sight; InSAR: interferometric synthetic aperture radar; EW: east–west; UD: up–down.
Authors’ contributions
HPS processed the data, performed the analysis and field survey, and wrote the manuscript. HU has been involved in drafting the manuscript and revising it critically for important intellectual content. Both authors read and approved the final manuscript.
Page 13 of 13 Sato and Une Earth, Planets and Space (2016) 68:47
Author details
1 Department of Geography, College of Humanities and Sciences, Nihon
Uni-versity, 3-25-40 Sakura-josui, Setagaya Ward, Tokyo 156-8550, Japan. 2 Planning Department, Geospatial Information Authority of Japan, Tsukuba 305-0811, Japan.
Acknowledgements
PALSAR-2 data used in this study were provided by JAXA in the framework of special collaborative research (B) ‘Surface deformation study using a new generation SAR’ by Earthquake Research Institute, the University of Tokyo. ASTER GDEM used for mapping local topography is a product of METI (Min-istry of Economy, Trade and Industry of Japan) and NASA. In the field survey, Prof. Chigira (Kyoto Univ., Japan) and Dr. Tsou (Hirosaki Univ., Japan) gave the author the fruitful infers and ideas, and Mr. Dawa Sherpa translated the author’s question in the hearing investigation. Mr. Yarai, Geospatial Informa-tion Authority of Japan, gave us interpolaInforma-tion method of long-wavelength coseismic deformation. This study was performed in the framework of ‘Inven-tory Mapping of Landslides induced by the Nepal Earthquake and Hazard Mapping of Future Landslides for Making the Plan of Better Reconstruction’ (Principal investigator, Prof. Chigira) related to the April 2015 Nepal earthquake in the J-RAPID Program by Japan Science and Technology Agency (JST). The authors would like to thank Enago (www.enago.jp) for the English language review, whose cost was supported by the collaborative investigation of the Institute of Natural Science in College of Humanities and Sciences, Nihon Univ. We thank the editor for his helpful comments to improve our manuscript.
Competing interests
The authors declare that they have no competing interests.
Received: 2 October 2015 Accepted: 4 March 2016
References
Chen CW, Zebker HA (2002) Phase unwrapping for large SAR interferograms: statistical segmentation and generalized network models. IEEE Trans Geosci Remote Sens 40:1709–1719
Collins BD, Jibson RW (2015) Assessment of existing and potential landslide hazards resulting from the April 25, 2015 Gorkha, Nepal earthquake sequence, U.S. Geological Survey Open-File Report 2015-1142. doi: 10.3133/ofr20151142
Fujiwara S, Nishimura T, Murakami M, Nakagawa H, Tobita M, Rosen PA (2000) 2.5-D surface deformation of M6.1 earthquake near Mt Iwate detected by SAR interferometry. Geophys Res Lett 27:2049–2052
Geographical Survey Institute (1984) Research map about damage by 1983 Middle Japan Sea Earthquake. http://www1.gsi.go.jp/geowww/disa/ disa_1983nihonkai.jpg. Accessed 5 Feb 2016 (in Japanese)
Geographical Survey Institute (2004) Detect 2-dimension-like deformation on a 2-dimensional surface. http://vldb.gsi.go.jp/sokuchi/sar/mechanism/ stereo01-e.html. Accessed 13 Mar 2016
Geospatial Information Authority of Japan (2015) The 2015 Nepal earthquake: crustal deformation detected by ALOS-2 data. http://www.gsi.go.jp/cais/ topic150429-index-e.html. Accessed 5 Feb 2016
Goldstein RM, Werner CL (1998) Radar interferogram filtering for geophysical application. Geophys Res Lett 25:4035–4038
Higaki T, Hasegawa O, Yagi H, Wakai A (2015) Emergency survey report on geo-hazards caused by Gorkha Earthquake in Nepal. J Jpn Landslide Soc 52:203–206. doi:10.3313/jls.52.203 (in Japanese)
JAXA (2015) Observation result about Nepal Earthquake by ALOS-2 (4). http:// www.eorc.jaxa.jp/ALOS-2/en/img_up/dis_pal2_npl-eq_20150502.htm. Accessed 13 Mar 2016
Kargel JS, Leonard GJ, Shugar DH, Haritashya UK, Bevington A, Fielding EJ, Fujita K, Geertsema M, Miles ES, Steiner J, Anderson E, Bajracharya S, Bawden GW, Breashears DF, Byers A, Collins B, Dhital MR, Donnellan A, Evans TL, Geai ML, Glasscoe MT, Green D, Gurung DR, Heijenk R, Hilborn A, Hudnut K, Huyck C, Immerzeel WW, Liming J, Jibson R, Kääb A, Khanal NR, Kirschbaum D, Kraaijenbrink PDA, Lamsal D, Shiyin L, Mingyang LV, McKinney D, Nahirnick NK, Zhuotong N, Ojha S, Olsenholler J, Painter TH, Pleasants M, Pratima KC, Yuan QJ, Raup BH, Regmi D, Stumm D, van der Kooij M, Voss K, Xin W, Weihs B, Wolfe D, Lizong W, Xiaojun Y, Yoder MR, Young N (2015) Geomorphic and geologic controls of geohazards induced by Nepal’s 2015 Gorkha earthquake. Science. doi: 10.1126/sci-ence.aac8353
Kobayashi T, Morishita Y, Yarai H (2015) Detailed crustal deformation and fault rupture of the 2015 Gorkha earthquake, Nepal, revealed from ScanSAR-based interferograms of ALOS-2. Earth Planets Space 67:201–213. doi:10.1186/s40623-015-0359-z
NTT Data Corporation (2015) World 3D topographic data. http://aw3d.jp/en/ index.html. Accessed 14 Mar 2016
Ozawa T (2014) Development of InSAR processing tools in NIED—Part 3. In: Proceedings of Japan Geoscience Union meeting 2014 STT59-P12. http:// www2.jpgu.org/meeting/2014/session/S-TT59_e.html. Accessed 13 Mar 2016
Pandey VP, Chapagain SK, Kazama F (2010) Evaluation of groundwater environ-ment of Kathmandu Valley. Environ Earth Sci 60:1329–1342. doi:10.1007/ s12665-009-0263-6
Raspini F, Ciampalini A, Conte SD, Lombardi L, Nocentini M, Gigli G, Ferretti A, Casagli N (2015) Exploitation of amplitude and phase of satellite SAR images for landslide mapping: the case of Montescaglioso (South Italy). Remote Sens 7:14576–14596. doi:10.3390/rs71114576
Sakai H (2001) Stratigraphic division sedimentary faces of the Kathmandu basin group, central Nepal. J Nepal Geol Soc 25(Special issue):19–32 Sato HP, Abe K, Ootaki O (2003) GPS-measured land subsidence in Ojiya city,
Niigata Prefecture, Japan. Eng Geol 67:379–390
Sato HP, Miyahara B, Okatani T, Koarai M, Sekiguchi T, Yagi H (2014) Detection of landslide surface deformation triggered by the 2011 off the Pacific coast of Tohoku earthquake using InSAR image. J Japan Landslide Soc 51:41–49. doi:10.3313/jls.51.41 (in Japanese with English abstract) Sun Q, Zhang L, Ding X, Hu J, Liang H (2015a) Investigation of slow-moving
landslides from ALOS/PALSAR images with TCPInSAR: a case study of Oso, USA. Remote Sens 7:72–88. doi:10.3390/rs70100072
Sun Q, Zhang L, Ding XL, Hu J, Li ZW, Zhu JJ (2015b) Slope deformation prior to Zhouqu, China landslide from InSAR time series analysis. Remote Sens Environ 156:45–57. doi:10.1016/j.rse.2014.09.029
US Geological Survey (2015) Search earthquake archives. http://earthquake. usgs.gov/earthquakes/search/. Accessed 13 Mar 2016
Une H, Sato HP, Koarai M (2008) Analysis of surface deformation induced by the Noto Hanto and the Chuetsu-oki Earthquake in 2007 using synthetic aperture radar interferograms. J Japan Landslide Soc 45:125–131. doi:10.3313/jls.45.125 (in Japanese with English abstract) Varnes DJ (1978) Slope movement types and processes. In: Schuster RL and
Krizek RJ (eds) Landslides, analysis and control. Transportation Research Board Special. Report No. 176. National Academy of Sciences, pp 11–33 Yagi Y, Okuwaki R (2015) Integrated seismic source model of the 2015 Gorkha,
Nepal, earthquake. Geophys Res Lett. doi:10.1002/2015GL064995 Zhao CY, Lu Z, Zhang Q, de la Fuente J (2012) Large-area landslide detection