Magnitude Squared Coherence based SCA
Sebastien Tiran(1), Amine Dehbaoui(2), Philippe Maurine(1)
(1)
University of Montpellier / LIRMM 161 Rue Ada
34392 Montpellier France
(2)
CEA, Centre de Microélectronique de Provence 880, route de Mimet
13541 Gardanne
Abstract. Magnitude Squared Coherence is a signal processing tool that indi-cates how well two time domain signals match one with the other by tracking linear dependencies in their spectral decomposition. This paper introduces dif-ferent ways of using the Magnitude Squared Coherence for Side Channel Anal-ysis. This distinguisher has several advantages over well-known distinguishers.
Keywords: Secure Circuit, Side Channel Attacks, Distinguisher
1
Introduction
Following [1], many Side-Channel Attacks have been proposed in the literature. Sur-prisingly, most of them directly work with time domain traces. Easy connection with engineering intuition could explain this trend despite some inherent drawbacks of such an approach. Among them, the impossibility of capturing the complete leakage scattered over many time samples of raw traces appears as a limitation.
By contrast, much less attention has been paid to Side-Channel Analysis performed in the frequency domain that could bring a solution to this problem. To the best of the authors' knowledge, Gebotys, Ho and Tiu first proposed to apply a differential attack after the application of a Fast Fourier Transform (FFT) [2]. This work was then ex-tended towards CPA-like attacks in [3-4]. Various similar approaches were described in [5].
Within this context, this paper introduces different Magnitude Squared Coherence Analyses to overcome the aforementioned limitation. All the proposed techniques are more efficient (less traces are necessary to disclose the secret key) than the one intro-duced in our former works [6-7]. Moreover, some of them appear more generic be-cause they rely on non-parametric statistical analyses of Coherence distributions. This latter point is not tackled in this paper; it is still the subject of on-going works.
The rest of the paper is organized as follows. Section 2 reminds some basics about Magnitude Squared Coherence and its first application [6-7] in the context of SCA. Sections 3, 4 and 5 introduce different parametric and non parametric analyses of Coherence distributions. These additional techniques complete our first proposal, the SCAN [6-7]. Experimental results are given in section 6. They demonstrate that the proposed attacks are more efficient (only a reduced set of traces is necessary to dis-close the secret key manipulated by unprotected cryptographic circuits) but require more cpu-time to be completed. In Section 7, the impact of the different parameters involved in the setting of the MSC based analyses is discussed. Finally, a conclusion is drawn in section 8.
Preliminary Note
Note that it could have been interesting to evaluate, MSC based analyses, using the set of traces provided by the DPA contest 2. However, these traces correspond to AES power con-sumption measurements. They carry less information in the frequency domain because of the low cut-off frequencies of both power pad en supply network but also because of the low sam-pling rate used to collect them. We therefore preferred EM measurements.
2
Magnitude Squared Coherence
2.1 Theory
Magnitude Squared Coherence is a signal processing tool that returns real values be-tween 0 and 1 to indicate how well two time domain signals x(t) and y(t) match one with the other. To estimate the similarity level, linear dependencies in the spectral decomposition of x(t) and y(t) are tracked by computing MSC(f) values at different frequencies according to:
) ( * ) (
² ) ( )
(
f P f P
f P f
MSC
yy xx
xy
xy (1)
In which, Pxy is the cross-power spectral density of x(t) and y(t) and, Pxx and Pyy the
related power spectral densities.
2.2 MSC application to SCA
To retrieve the secret key by SCA, an adversary typically collects a set of n raw traces {T1 … Tn} corresponding to a set of messages {m1 … mn} acquired during different
cryptographic operations. Then, he applies a selection function that sorts traces in several subsets according to a hypothesis on the secret key. Finally, the adversary applies a distinguisher to identify among all possible keys the correct one. Among the known efficient distinguishers, he may adopt the Difference of Means [1], the Pearson [9], the Spearman or the Kendall correlation coefficients or even the mutual informa-tion [10].
In a first attempt to exploit MSC within the context of SCA, we formerly proposed the SCAN [7] for Squared Coherence ANalysis. The basic idea of the SCAN is to simply replace, in the original DPA, the Difference operation of two mean values by the computation of a coher value (2), between two mean EM traces.
However, MSC could also be used in a less straightforward manner requiring an additional preprocessing of traces. Indeed, the adversary can first compute the MSC(f) coefficients between each pair of traces for frequency values falling into the band-width of its SCA platform. He may finally apply the aforementioned distinguishers to one or several MSC(f) samples to retrieve the secret key. However, this procedure suffers from the same limitation as the procedures of [2, 3, 4]; it does not allow cap-turing the whole leakage which is scattered over several harmonics. An alternative, to overcome this limitation, is to compute, as SCAN does, the mean Coherence coeffi-cient of MSC(f) values on a given frequency bandwidth:
maxmin
)
(
1
)
,
(
,f
f f
T T j
i
MSC
f
m
T
T
coher
j
i (2)
where Ti and Tj denote time domain traces.
At the end of this preprocessing, the adversary obtains a set Coher of 1/2n(n-1) coher values ranging between 0 and 1. Compared to the procedures associated to DPA, CPA, MIA, or SCAN the adversary have thus at disposal 1/2(n-1) times more informers to retrieve the secret. This is an interesting advantage of working with pairs of traces rather than analyzing traces one by one. Such an advantage could be of prime importance while attacking systems in which key is regularly refreshed. The remaining question is then how to efficiently extract, from the resulting Coher distri-bution, the secret key.
3
Mean and Variance Analyses
i i k i w p n k c k m f k m f ) , ( ) , ( 1 , 0 1 , 0 1 , 0 : (3)If the Hamming Weight (HW) model is chosen, fk w
predicts the value ci of w bits
processed by the cryptographic algorithm according to the value of a clear/ciphered message mi and to a guess kK of the key. If the Hamming Distance (HD) model is
preferred, fk*w rather outputs a word ci of w bits indicating which of the w bits have
switched during a given clock cycle.
An adversary adopting MSC for SCA may analyze the Means and the Variances of some subsets of Coher. Indeed, he may sort the coher values by selecting pairs of traces according to one of the two following functions:
)) , ( ) , ( ( ) , ( ) , ( ) , ( ) , ( ) , ( 1 , 0 1 , 0 1 , 0 : k m f k m f HW c c f or k m f k m f c c f c c N or f j k i k j i k j k i k j i k j i w w w w k (4)As shown, fkw is the xor or the hamming weight of the xor of two words ci and cj
computed by the function fkw according to the HW or to the HD model and to a guess k
on the key.
3.1 Mean analysis
Following (3), let us define Ck*fk* 1
=0 and Ck*fk* 1
=1 as two subsets of Coher with w=1. Because Ck*fk*1=0 gathers coher values associated to pairs of traces with
a given bit having the same HW or HD, the expectation E(Ck*fk*1=0) should be
greater than E(Ck*fk*1=1) for the right guess of the key while, for wrong hypotheses
the expectations must have nearly the same value. Extending this reasoning to several bits as in [13], an adversary may therefore expect disclosing the secret key kgK
us-ing the followus-ing DoM distus-inguisher:
w bit bit f k f k Kk k k
C E C E ArgMax 1 1 * 0 * * ) ( ) ( 1 * 1 * (5)
3.2 Variance analysis
Similarly, because Ck*fk* 1
=0 gathers coher values associated to pairs of traces with the same HW or HD, one may expect that the variances V(Ck*fk*1=0) or
V(Ck*fk*1=1) have greater values for wrong guesses than for the secret key. An
w bit bit f k K k k C V ArgMin 1 0 * * ) ( 1 * (6)4
Correlation Analysis
From engineering intuition and empirical observations, let us assume that the expecta-tions E(Ck*fk*w=q) (fk*w corresponding to the second equation of (4)) are
decreas-ing with increasdecreas-ing values of q, i.e with the HW or HD difference associated to a pair of traces. Considering this statement, an adversary may analyze the correlation be-tween the coher and the fk*w values. One effective manner is to adopt the Pearson’s
coefficient to quantify the linear relationship between them. The associated distin-guisher is in that case:
P p P p p w k p w k P p P p p p P p p w k P p p p w k P p p f f P coher coher P f coher f coher P K k ArgMax 1 2 1 1 * 1 * 1 2 1 2 1 1 * 1 1 * 1 * (7)
where coherp denotes the pth coherence value and fk*w>1p the pth Hamming
Dis-tance value (3).
Note that one may also consider the Spearman coefficient to capture a monotonic but non linear variation of coher values with fk or even use the Kendall’s coefficient
for more generic analyses.
5
Non-Parametric Tests
If the Kendall rank correlation is a non parametric distinguisher, its use remains cpu-time consuming when applied to large sets of data. For generic and more efficient MSC based analyses, an adversary may exploit well known statistical tests such as the Kolmogorov-Smirnov (KS), the Cramer-Von-Mises (CVM) tests or even more so-phisticated and adaptive tests, e.g. [11]. Indeed, such tools allow comparing the cumu-lative density functions (CDF) of two empirical samples in a non-parametric manner, i.e. without any assumption on the underlying distribution law.
For sake of simplicity let us consider only the KS-test even if slightly better expe-rimental results were obtained with [11]. In that case, the comparison of two empirical CDF, F1 and F2, is based on the calculus of (F1,F2), the maximum distance between the two CDF defined by
) ( ) ( ) ,
( 1 2
2 1
2 1 2
1 SupF x F x
g g g g F F x
(8)
Assuming (a) that the CDF associated to the secret key is unique and different from that of wrong key guesses and (b) that the distributions of wrong guesses are similar in shape, the KS test can be used according to the following distinguisher:
K q k k k f q k f q k
w k w k
C C
ArgMax *
* *
,
*
(9)
It aims at identifying the key guess associated to the CDF differing the most from all the others.
6
Experimental Results & Discussion
To confirm the relevance of MSC based SCA, including SCAN, this section reports experimental results obtained by application of different analyses against an unpro-tected DES implementation, mapped into an FPGA, and operating at 50 MHz. For this purpose, we selected a list of distinguishers that are representative of the state-of-the-art and adopted both the Hamming Weight and Distance models. In addition to multi-bit SCAN we first proposed in [7], we considered:
Correlation analysis in the time domain as the reference. This test is usually the first one considered in the literature for evaluating a leaking device. In the present context, it allowed us to confirm experimentally that a Hamming Distance leakage model was a reasonable abstraction to predict the DES electromagnetic emissions.
Second, we applied the multi-bit DPA of Bevan and Knudsen [13] in the time do-main (MB-DPA).
Third, we applied the Correlation Power Frequency Analysis (CPFA) described in [4] and further analyzed in [3], to provide a comparison with previous attempts to exploit frequency-based attacks.
Finally, we implemented two types of MIA attacks [10], one estimating the proba-bility density functions with histograms, and one based on a Gaussian assumption that turned out to be a quite accurate approximation in our experiments.
Our evaluations followed the framework in [12] and, in particular, we computed a global Success Rate (SR) taken over the 8 DES last round sub-keys. These metrics have been estimated for a reduced set of traces (5000) per attack, and sampled over 50 independent attacks. EM traces were acquired using a Lecroy scope featuring a 20 GS/s sampling rate and using a low noise 63db amplifier with a 1 GHz bandwidth.
Additionally, we measured the cpu-times spent to run the different analyses, coded in C, to process EM traces. Note that all our experiments were conducted on PC in-cluding an Intel Duo Core operating at 3 GHz and 8 Go of RAM.
densities were obtained by applying an FFT to the 127 sub-windows. The FFT were carried out considering 64 points i.e. using zero padding [8,14]. Only the spectral harmonics falling into the -3db bandwidth (fmin= 50MHz, fmax = 1GHz) of our
acquisi-tion platform were kept to compute the final coher values (2).
6.1 Number of traces required
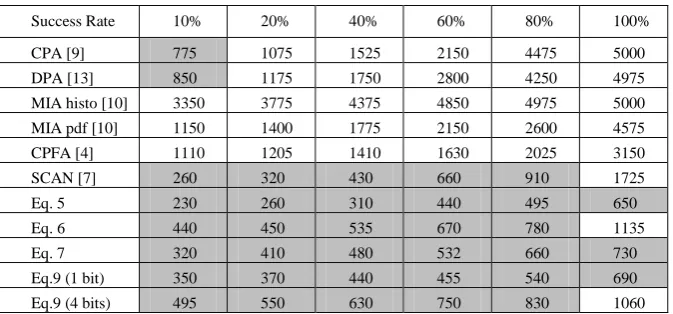
Table 1 gives, for each attack applied considering the HD model, the number of traces required to obtain a Global Success Rate of 10%, 20%, 40%, 60%, 80% and 100%. Shaded cells highlight analyses providing a given success rate with less than 1k EM traces.
As shown, all considered distinguishers disclose the secret key. This confirms that the Hamming Distance model was, as expected, a reasonable abstraction of EM radia-tions of the iterative and unprotected DES implementation. However, the main con-clusion that we may draw from table I is thatMSC based analyses including SCAN require clearly less EM traces than standard distinguishers to disclose the key. As an evidence, the distinguishers of eq. 5 (mean analysis), eq. 7 (correlation analysis) and eq. 9 (KS test) give a success rate of 100% with roughly 750 traces while CPA gives for the same number of traces only a score of 10%. MSC based analyses, including SCAN, are thus more efficient than standard distinguishers. Generally speaking one may conclude that MSC based analyses (eq. 5, 7 and 9) require 6 times less EM traces to disclose the key with a Success Rate of 100% than CPA and 2 times less traces than SCAN.
Table 1. Number of processed traces vs Success Rate (HD model)
Success Rate 10% 20% 40% 60% 80% 100%
CPA [9] 775 1075 1525 2150 4475 5000
DPA [13] 850 1175 1750 2800 4250 4975
MIA histo [10] 3350 3775 4375 4850 4975 5000
MIA pdf [10] 1150 1400 1775 2150 2600 4575
CPFA [4] 1110 1205 1410 1630 2025 3150
SCAN [7] 260 320 430 660 910 1725
Eq. 5 230 260 310 440 495 650
Eq. 6 440 450 535 670 780 1135
Eq. 7 320 410 480 532 660 730
Eq.9 (1 bit) 350 370 440 455 540 690
Eq.9 (4 bits) 495 550 630 750 830 1060
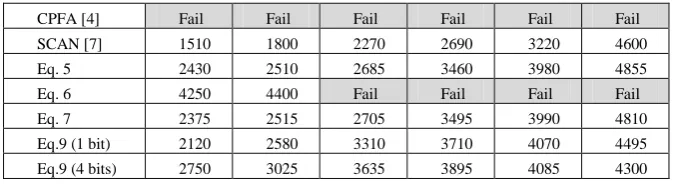
Table 2. Number of processed traces vs Success Rate (HW model)
Success Rate 10% 20% 40% 60% 80% 100%
CPA [9] Fail Fail Fail Fail Fail Fail
DPA [13] Fail Fail Fail Fail Fail Fail
MIA histo [10] Fail Fail Fail Fail Fail Fail
CPFA [4] Fail Fail Fail Fail Fail Fail
SCAN [7] 1510 1800 2270 2690 3220 4600
Eq. 5 2430 2510 2685 3460 3980 4855
Eq. 6 4250 4400 Fail Fail Fail Fail
Eq. 7 2375 2515 2705 3495 3990 4810
Eq.9 (1 bit) 2120 2580 3310 3710 4070 4495
Eq.9 (4 bits) 2750 3025 3635 3895 4085 4300
Table 2 gives the results of the same analyses as Table 1 while the opponent pre-fers the HW model. ‘Fail’ in a cell indicates that the key was not found after the processing of 5k traces. As shown, DPA, CPA, MIA, CPFA do not succeed in dis-closing the secret with such a reduced set of measurements. This was an expected result because the HW model is a really rough abstraction of the EM radiations of our DES implementation. Indeed, it does not require any RAM access or any transfer of data via a pre-charged bus. Despite the limited relevance of HW model, and in con-trast with standard distinguishers, most MSC based analyses allow disclosing the 8 sub-keys with a success rate of 100% with less than 5k traces.
6.2 CPU times
If MSC based analyses disclose the secret-key with few measurements, they involve the computation of many FFT on short length vectors. One may thus wonder if such analyses are time consuming or not. Tables 3 and 4 report the normalized cpu-times required, using different distinguishers, to obtain a given success rate consider-ing both HW and HD models. The normalization was done with respect to the time necessary to obtain a Success Rate of 10% with a HD based CPA. With the equip-ment described in the first paragraph of section 6, the time unit is equal to 20 seconds. Note that all these cpu-time analyses were conducted so that to obtain a guess of the key only after the processing of the number of traces leading to the targeted success rate value.
Table 3. Normalized CPU-time vs Success Rate (HD model)
Model Success Rate 10% 40% 80% 100%
HD
Time Domain
CPA [9] 1.0 2.0 5.8 6.4
DPA [13] 1.2 2.5 6.0 7.0
MIA histo [10] 16.95 23.9 28 28.4
MIA pdf [10] 19 29 43 76
Frequency domain
Eq. 5 43 78 197 341
Eq. 6 156 231 489 1038
Eq. 7 84 185 354 430
Eq.9 (1 bit) 98 155 236 386
Eq.9 (4 bits) 198 320 556 900
CPFA [4] 1.43 1.82 2.61 4.07
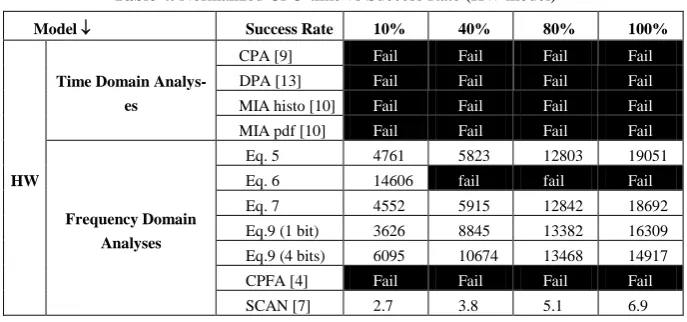
Table 4. Normalized CPU-time vs Success Rate (HW model)
Model Success Rate 10% 40% 80% 100%
HW
Time Domain Analys-es
CPA [9] Fail Fail Fail Fail
DPA [13] Fail Fail Fail Fail
MIA histo [10] Fail Fail Fail Fail
MIA pdf [10] Fail Fail Fail Fail
Frequency Domain Analyses
Eq. 5 4761 5823 12803 19051
Eq. 6 14606 fail fail Fail
Eq. 7 4552 5915 12842 18692
Eq.9 (1 bit) 3626 8845 13382 16309
Eq.9 (4 bits) 6095 10674 13468 14917
CPFA [4] Fail Fail Fail Fail
SCAN [7] 2.7 3.8 5.1 6.9
From Tables 3 and 4, one may conclude that MSC based analyses, excluding SCAN, are cpu-time consuming. This is especially true when incoherence values are computed for all pairs of traces. The cpu-time of these analyses range from 50 (eq.9) to 160 (eq.5) times the cpu-time spent by a CPA. Note however that (a) the cpu-time required (1 min 01s) to obtain, with a Success Rate of 100%, the secret key with a SCAN is only half the one spent to run a CPA and (b) that only MSC based analyses are able to disclose the secret key, using the HW model, with such a reduced set of curves (5k traces). Note that running MSC based analyses with Matlab is extremely long and that proper C codes are mandatory to obtain such cpu-time costs.
As an additional observation, we compared the cpu-times required to run HW based DPA, CPA and SCAN with one shot EM traces, i.e. without using the averag-ing capabilities of the scope. 150k one shot traces were processed to disclose the key using HW model based CPA and DPA while, with an HW based SCAN, 65k traces only are sufficient. The CPA and SCAN took 42 min and 22 min, respectively.
6.3 Discussion
Considering Tables 1 to 4 that give evidence of the efficiency and costs of MSC based analyses, several conclusions may be drawn. Firstly, among all considered MSC based analyses, SCAN offers the most interesting trade-offs between efficiency and cpu-time. Secondly, MSC based analyses (excluding SCAN) are interesting candi-dates for SCA when only reduced set of measurements are available (less than 5k to 10k traces). This is typically the case when secret keys are frequently refreshed and derived from a master key.
noise thanks to the analysis of a reduced set of harmonics and (b) the gathering, on these harmonics of leakages scattered over several time domain samples may explain this observation.
Thirdly, working with pair of traces, here with MSC based analyses excluding SCAN, allows obtaining 1/2(n-1)n informers with n measurements. This is a really interesting advantage that allows disclosing key with few traces. However, less cpu-time consuming techniques to compare traces should be envisaged to process, in a reasonable time, large sets (>10k traces) of measurements.
7
Setting parameters of a SCAN and MSC based Analyses
All aforementioned MSC based analyses, including SCAN, were conducted with the same setting of parameters. More precisely, a time window of 512 samples (25.6ns) was analyzed. This time window was divided into w=127 sub-windows of 8 samples overlapping with the two neighboring ones by 4 samples accordingly to the Welch’s method. 64 points FFT were conducted for each sub-window using zero-padding and only harmonics between 50 MHz and 1 GHz were kept to compute MSC(f).
If these settings were applied considering the unit delay of FPGA luts (500ps), one may wonder if modifying these settings reduces or increases the efficiency of the MSC based analyses. We thus analyzed the impact of these different parameters on the efficiency of the SCAN (which offers the best trade-off between efficiency and cpu-time) considering that all results hold for all MSC based analyses.
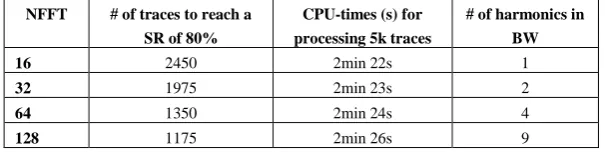
The impact of the number of points, NFFT, of conducted FFT was analyzed be-cause it allows tuning the number of harmonics falling into the frequency bandwidth of interest i.e. between fmin and fmax. Table 5 gives the number of traces required to
reach a Success Rate value of 80% and the cpu-times necessary to process 5k traces for the SCAN attack based on a HD model. The bandwidth BW was set so that fmin=50
MHz and fmax=1.5 GHz. As shown, increasing NFFT improves significantly the
effi-ciency of the SCAN without increasing the cpu-time required to disclose the key (the latter being mainly fixed by the time spent to read traces on the disk). This enhance-ment is due to the increased number of harmonics falling into the considered frequen-cy bandwidth BW. Note that the computation of the coher values at the end of the required traces represents a small amount of time compared to the reading and the sorting of the traces which explains the small impact of the NFFT parameter on the cpu-time. The impact should be much greater for the others MSC based attacks.
Table 5. Impact of NFFT on SCAN efficiency and cpu-time (w=63, overlap=8, fmin=50 MHz fmax=1.5 GHz)
NFFT # of traces to reach a SR of 80%
CPU-times (s) for processing 5k traces
# of harmonics in BW
16 2450 2min 22s 1
32 1975 2min 23s 2
64 1350 2min 24s 4
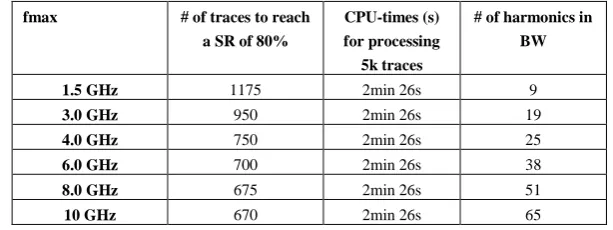
Table 6. Impact of fmax on SCAN efficiency and cpu-time (w=63, overlap=8, fmin=50MHz,
NFFT =128)
fmax # of traces to reach a SR of 80%
CPU-times (s) for processing
5k traces
# of harmonics in BW 1.5 GHz 1175 2min 26s 9
3.0 GHz 950 2min 26s 19
4.0 GHz 750 2min 26s 25
6.0 GHz 700 2min 26s 38
8.0 GHz 675 2min 26s 51
10 GHz 670 2min 26s 65
Considering the results of Table 5, we analyzed the impact of the fmaxvalue on the
SCAN efficiency considering NFFT=128. Results and parameter settings are reported Table 6. Note that 10 GHz is the maximum value that can be imposed due to the sam-pling rate of the scope (20GS/s). We observed an increase of the SCAN efficiency with the number of harmonics falling between fminand fmax. Note however that after 4
GHz the increase is moderated. This was an expected result. Indeed, the cut-off quency of our scope is 3.5 GHz while our low noise amplifier has a 3db cut-off fre-quency of 1 GHz. No valuable EM information is captured after 3.5 GHz.
Finally, we analyzed the impact of the number of sub-windows (w) on the SCAN efficiency. Note that the overlapping (overlap) between neighboring windows was fixed to be half the width of sub-windows. Results and related parameters are reported table 7. As shown, there is an optimal number of sub-windows wopt=63. This
opti-mum, which is relatively flat, corresponds to a sub-window width of 800 ps. This result confirms our intuition according to which EM traces must be analyzed over time intervals corresponding, at first order, to the unit delay of CMOS cells used to design the IC. In our case, the FPGA Lut delay is about 500 ps.
Table 7. Impact of the number of sub-window on SCAN efficiency and cpu-time (over-lap=50%, fmin=50MHz, fmax=10 GHz, NFFT =128)
# of sub-windows Sub-windows width (in ps)
# of traces to reach a SR of 80%
CPU-times (s) for processing 5k traces
127 400ps =8×50ps 1175 2 min 32s
63 800ps =1650ps 1020 2 min 24s
31 1600ps =3250ps 1175 2 min 21s
15 3200ps =6450ps 1625 2 min 19s
7 6400ps =12850ps 3350 2 min 18s
design the IC. This value changes with the CMOS technology but also with the nature of the IC: ASIC or FPGA. Cell delays are typically smaller in an ASIC than in FPGA for a given technology.
The second guideline is to increase as far as possible the number of harmonics falling into the frequency bandwidth BW of interest, typically the one of the used SCA platform or scope. The easiest way, but not the cheaper one, is to use a scope with high cut-off frequency and sampling rate.
However, this number should be maximized under cpu-time constraints i.e. ac-cording to the n number of traces to be processed. Indeed, the cpu-time of MSC based analyses (5, 6, 7 and 9), excluding SCAN, quadratically increases with n.
8
Conclusion
SCA in the frequency domain has been recently proposed as an alternative to usual time domain analyses. Within this context, several Magnitude Squared Coherence based analyses have been introduced and evaluated here considering an unprotected DES implementation. Some guidelines to use Magnitude Squared Coherence within the context of SCA have also been identified.
The experimental results reported in this paper demonstrate that Magnitude Squared Coherence based analyses offer several advantages. Among them, the main one is their ability to disclose the secret key with really reduced set of traces com-pared to standard distinguishers. This may represent an advantage if the secret key is regularly refreshed. A second advantage is their limited sensitivity to the accuracy of the considered power consumption model (HW or HD). For all MSC based analyses considered in this paper, these advantages arise at the cost of greater cpu-times except for one attack: the SCAN.
Several additional advantages should still be demonstrated. Among them, one may identify the opportunity of tuning the frequency bandwidth of interest. This may allow increasing Signal to Noise Ratio or, may allow tracking leakages on modulated sig-nals. All these results and perspectives clearly highlight the interest of frequency do-main analyses and especially the interest of Magnitude Squared Coherence as a tool for SCA.
References
1.Paul C. Kocher, Joshua Jaffe, and Benjamin Jun. Differential power analysis. In Michael J. Wiener, editor, CRYPTO, volume 1666 of Lecture Notes in Computer Science, pages 388-397. Springer, 1999.
3.Edgar Mateos and Catherine H. Gebotys. A new correlation frequency analysis of the side-channel. In Proceedings of WESS, Scottsdale, Arizona, USA, October 2010.
4.E. Bohl J. Hayek O. Schimmel, P. Duplys and W. Rosenstiel. Correlation power analysis in frequency domain. In Proceedings of COSADE 2010, Darmstadt, Ger-many, February 2010.
5.Sylvain Guilley F. Flament Jean-Luc Danger et Frédéric Valette Olivier Meynard, Denis Réal. Characterization of the electromagnetic side channel in frequency do-main. In Proceedings of INSCRYPT, Shangai, China, October 2010.
6.Amine Dehbaoui, Victor Lomné, Thomas Ordas, Lionel Torres, Michel Robert, and Philippe Maurine. Enhancing electromagnetic analysis using magnitude squared incoherence. IEEE Trans. Very Large Scale Integrated Circuits, PP:1-5, 2011
7.Amine Dehbaoui, Sébastien Tiran, Philippe Maurine, François-Xavier Standaert, Nicolas Veyrat-Charvillon. Spectral Coherence Analysis - First Experimental Re-sults - Cryptology ePrint Archive : Report 2011/56, 2011
8.P.D.Welch. The use of fast fourier transform for the estimation of power spectra: A method based on time averaging over short. IEEE Trans. Audio Electroacoustics, 15:70-73, 1967.
9.Eric Brier, Christophe Clavier, and Francis Olivier. Correlation power analysis with a leakage model. In Marc Joye and Jean-Jacques Quisquater, editors, CHES, volume 3156 of Lecture Notes in Computer Science, pages 16-29. Springer, 2004.
10.Benedikt Gierlichs, Lejla Batina, Pim Tuyls, and Bart Preneel. Mutual information analysis. In Elisabeth Oswald and Pankaj Rohatgi, editors, CHES, volume 5154 of Lecture Notes in Computer Science, pages 426-442. Springer, 2008.
11.Gilles R. Ducharme and Teresa Ledwina. Efficient and adaptive nonparametric test for the two-sample problem. The Annals of statistics 2003, Vol 31, No 6, 2036-2058
12.François-Xavier Standaert, Tal Malkin, and Moti Yung. A unified framework for the analysis of side-channel key recovery attacks. In Antoine Joux, editor, EUROCRYPT, volume 5479 of Lecture Notes in Computer Science, pages 443-461. Springer, 2009.