_____________________________________________________________________________________________________
www.sciencedomain.org
Using Social Groups to Locate Areas with High
Emergency Department Attendance, Subsequent
Inpatient Admission and Need for Critical Care
Neeraj Beeknoo
1*and Rodney P. Jones
21
King’s College University Hospital, London, UK.
2
Healthcare Analysis and Forecasting, Worcester, UK.
Authors’ contributions
This work was carried out in collaboration between both authors. Author NB designed the study. Author RPJ performed the analysis, managed the literature searches and wrote the first draft of the manuscript. Both authors read and approved the final manuscript.
Article Information
DOI: 10.9734/BJMMR/2016/29208 Editor(s): (1) Faris Q. B. Alenzi, Department of Medical Laboratories, College of Applied Medical Sciences Salman bin Abdulaziz University (Al-Kharj), Saudi Arabia. Reviewers: (1) Ramona Anthonie, Stellenbosch University, South Africa. (2)Gift Mulima, Kamuzu Central Hospital, Lilongwe, Malawi. Complete Peer review History:http://www.sciencedomain.org/review-history/16693
Received 29th August 2016 Accepted 19th October 2016 Published 27th October 2016
ABSTRACT
Aims: To study the role of social group and deprivation on the proportion of patients admitted via
the emergency department who then progress to the critical care unit.
Study Design: Two large data bases were compared using the output area code of the patient’s
home address.
Place and Duration of Study: Patients attending the emergency department (ED) and admitted
into the general surgical and medical critical care unit (CCU) at the King’s College University Hospital, London, during a three-year period (2013/14 to 2015/16).
Methodology: The output area of the patient’s home address was used to link ED attendances
with CCU admissions. Each output area has an associated social group and deprivation score. Various ratios were calculated such as the proportion admitted in each social group, and a method based on Poisson statistics was used to measure statistical significance. Each output area contains around 300 persons of roughly similar social and demographic characteristics. The Cartesian co-ordinates (distance east and north of the UK reference point as the X- and Y-axis
Galley Proof
respectively) for each output area have been used to map ED attendances without resort to GIS software.
Results: Output area social grouping, via the London Output Area Classification (LOAC) and
deprivation (Index of Multiple Deprivation) are shown to affect the attendance rates at the ED, the proportion admitted from the ED, and conversion rates for patients admitted via the ED into an adult general surgical and medical CCU. The overall conversion rate from an admitted inpatient to the CCU was 6.6%, however, higher than average conversion rates of 14.3% were associated with the ‘Settled Asians’ Super Group, while lower conversion rates of 3.3% were associated the with the ‘Ageing City Fringe’ Super Group and other ‘Affluent Suburbs’ Super Groups. Social group rather than deprivation per se appeared to delineate high and low conversion rates.
Conclusion: Small areas characterised by particular social groups (and relative deprivation) were
identified having either high/low rates of attendance at the ED, high/low conversion to an inpatient from an ED attendance, and high/low conversion into CCU admission. This will enable Primary Care Organisations to target admission avoidance and/or appropriate end-of-life care to those social groups yielding the greatest benefit.
Keywords: Emergency department; critical care; social groups; deprivation; population segmentation; output area classification; end-of-life care; admission avoidance.
ABBREVIATIONS
CCU : Critical Care Unit. ED : Emergency Department.
LOAC : London Output Area Classification (an area/social classification similar to the Output Area Classification (OAC) which covers the whole of England).
1. INTRODUCTION
In the UK the National Health Service (NHS) provides taxation-funded primary, secondary and tertiary care to UK residents, which is free-of-charge. Dental care is not covered and there is a fixed fee for each pharmaceutical prescription (with those over the age of 60, and those with a long-term condition exempt from the prescription charge). Hence, unlike in the USA there are no distortions in access to health care based on insurance status or poverty.
Persons who are unwell or have experienced an accident may choose to go either to their General Practitioner (GP) or attend an emergency department (ED) using their own transport or with the assistance of an emergency ambulance. Outside of working hours’ persons can still access a GP via GP-run out-of-hours services. Once at the ED they will be treated and either discharged or admitted to a hospital bed for further acute care. Patients whose condition has deteriorated to the point of being life-threatening will be admitted direct to the CCU from the ED, or will access the CCU after a period of inpatient care.
At 4.7-times the daily cost of a general ward, admission into the CCU represents a very high-cost aspect of acute services [1]. In an era of increasing focus on health care costs it is no longer acceptable to assume that critical care admissions are unavoidable.
In 2006 some 27% of Medicare costs in the USA were devoted to persons in the last year of life [2], and 11% of total costs were for the last month of life [3]. Approximately 40% of this was for ineffective stays in the CCU with the patient dying in the CCU or shortly after [3,4]. The simplest method for estimating CCU costs remains the number of CCU available or occupied beds [4,5]. In the UK this number has been rising by around 2.8% per annum [6], which is around double the level expected from demographic trends, but equal to the level of growth in emergency admissions [7,8]. These trends are being matched by an increasing interest in risk stratification tools to predict those most at risk of death either in the CCU or subsequent to discharge [9-13].
Galley Proof of the social groups (as determined by the London Output Area Classification (LOAC)), and deprivation (as measured by the Index of Multiple Deprivation (hereafter called the ‘deprivation index’)), to segregate the population into locations with high ED attendance, or high rates of inpatient admission from the ED, or high rates of admission into the CCU.
In the UK, all census data is aggregated at the primary level of an Output Area. In London, each Output Area contains an average of 336 persons (interquartile range 276 to 385), and is chosen based on similarity of the social and demographic characteristics of the residents, based on data collected at each Census [14]. Due to its unique social and ethnic composition London has its own London Output Area Classification (LOAC) [15], which is used in this study. The LOAC divides London into 48 sub-groups.
Each output area is then aggregated to a Lower Super Output Area containing around 1,500 persons, and then to higher geographies including electoral wards and local authorities. Each Lower Super Output Area has a measure of deprivation called the Index of Multiple Deprivation (deprivation index), which as the name suggests measures ‘deprivation’ across multiple domains such as income, crime, and access to services, health, etc [16]. The deprivation index ranges between 1 and 100, with 1 being least deprived and 100 most deprived. The deprivation index is known to correlate well with all manner of health behaviours (smoking, obesity, etc), and consequent poor health outcomes such as emergency admissions, mental health and chronic poor health [17-23].
This paper presents a simple method for allocating the deprivation index values to the smaller Output Areas using the LOAC, and relative population sizes. Patient attendance at the ED and any subsequent admissions, and admissions to the CCU are then allocated to an Output Area with its associated LOAC or deprivation index to determine the factors indicating high utilisation in any of the three steps in the patient journey. Population weighted Output Area geographic centroids (Easting, Northing) were used to plot the location of admissions using simple Excel charts. In this context the Output Area code has the huge advantage of removing patient identifiable features such as postcode from any associated analysis.
In this study, a large database of Emergency Department attendances was linked with another large database of CCU admissions via the Output Area code associated with the patient’s home address (and associated LOAC codes), and the conversion rate from one to the other evaluated.
A novel method based on Poisson statistics is used to delineate statistically significant deviations from the average. This simple method which calculates the difference from actual to expected ED admissions as a standard deviation equivalent allows non-academic NHS managers to rapidly sort social groups in order of increasing statistical significance without recourse to statistical tools.
2. MATERIALS AND METHODS
2.1 Data Sources
All data sources are given in the Appendix at the end of the document.
2.2 Conversion of Post Code to Output Area Code
To maintain patient confidentiality, the conversion of post code to Output Area code was conducted independently of this project. In the UK, each Output Area has geographic Cartesian coordinates measured in meters East and North (Easting, Northing) of the UK reference point. On this occasion the Easting and Northing of the population-weighted centroid, rather than the geometric centroid, has been used to measure distances, and to position each output area using an X and Y axis on a chart.
2.3 Estimating Deprivation Index at Output Area Level
As mentioned in the Introduction, the deprivation index is measured at Lower Super Output Area level. In London each Lower Super Output Area comprises a median number of 5 Output Areas (range 2 to 12). Given that the wealthy and poor can live within close proximity the Lower Super Output Area-based deprivation index is insufficiently accurate for precise identification of deprivation in small social groups seen at Output Area level.
Galley Proof across all LOAC sub-groups, and this data is presented in Table A1 in the Appendix. This enables all LOAC sub-groups to be ranked by relative deprivation index. For example, all B2b sub-groups have an average deprivation index of 43 (being the most deprived sub-group), while all H1c sub-groups have an average deprivation index of 7 (least deprived).
However, not all similar sub-groups experience the same level of deprivation across the whole of London. Adjusted values of deprivation index for each Output Area were then further refined as follows. All Output Area were grouped according to their respective Lower Super Output Area. The Lower Super Output Area-based value of the deprivation index was then modified as the population weighted average across all Output Areas using the LOAC sub-group deprivation index averages calculated above. For example, say a Lower Super Output Area has a deprivation index value of 10, but has two LOAC subgroups with averaged deprivation index scores of 9 (population 1,200) and 15 (population 900). Hence the adjusted deprivation index scores will be for LOA1 = [(10 x 1,200 + 10 x 900)/(9 x 1,200 + 15 x 900)] x 9, and for LOA2 = [10 x (1,200 + 900)/(9 x 1,200 + 15 x 900)] x 15. This process adjusts the LOAC sub-groups to their respective local deprivation index value. For example, the range in deprivation index across all B2b sub-groups is 23 to 71, while the range across all H1c sub-groups is 1 to 15.
2.4 Standard Deviation (Poisson)
The standard deviation associated with the proportion admitted or progressing to CCU can be approximated using Poisson statistics, where by definition one standard deviation is equal to the square root of the average. The statistical significance associated with the different proportions can therefore be converted into standard deviation equivalents away from the overall average (all patients from all locations). Hence expected admissions can be calculated as average proportion admitted times number of attendances, which gives the average number of expected admissions. The actual number of admissions is then compared to the estimated average and the difference between the two is then divided by the square root of the expected average number of attendances/admissions to give the difference between actual and expected as standard deviation equivalents. In Poisson statistics anything beyond ± 2 STDEV is equivalent to better than the 95% confidence
interval (CI), while ± 3 STDEV is equivalent to better than the 99% CI.
2.5 Proportions Admitted or Entering CCU
The LOAC or deprivation index for each Output Area was used to group patients with similar social characteristics, ratios were calculated for each group (proportion of attendances admitted as an inpatient or proportion of admissions via ED who require treatment in CCU), and the statistical significance determined as described above.
2.6 Data Manipulation
Data manipulation was performed using Microsoft Excel, with data extracts via the Pivot Table facility within Excel. All charts and tables were created within Excel.
3. RESULTS AND DISCUSSION
3.1 Results
3.1.1 Location of persons attending the ED
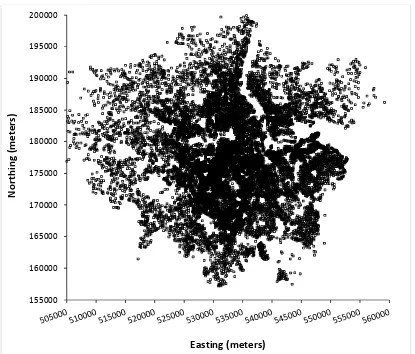
The KCH receives visits to the emergency department from local residents, persons commuting within and into London for work, leisure and tourism during work days and weekends. Fig. A1 takes the Eastings and Northings of the population centroid of each Output Area for persons attending the ED and displays location using a simple Excel graph. Eastings and Northings are the distance in meters from the UK reference point (0,0) located off the coast of Cornwall. All national geographies including OA, post codes, electoral wards have an Easting and Northing for the population centroid. This map comprises the 15,114 Output Area from which Londoners attended the KCH emergency department. Using the Output Area code rather than the post code has the huge advantage that individuals cannot be identified and that individuals with similar characteristics can then be aggregated into groups via the LOAC.
Galley Proof the Output Area population centroid may fall outside of the boundary of the Output Area especially where the shape of the Output Area is highly non-symmetric.
This map is to demonstrate the utility of using Output Areas and their associated Easting and Northing since geographical information can be displayed without the need for expensive GIS software. This figure also demonstrates that Londoners are highly mobile and can be in the vicinity of the KCH ED for a wide range of reasons.
3.1.2 Deprivation and proportion admitted via the ED
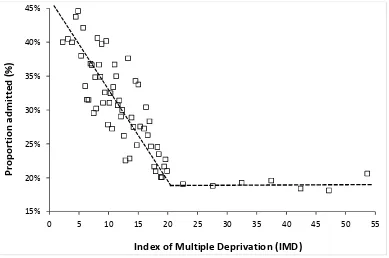
Fig. 1 shows the relationship between the proportion admitted from the ED and the Index of Multiple Deprivation (deprivation index) score of each Output Area. As can be seen the proportion admitted is highest at lowest deprivation score and falls to a plateau around a deprivation index value of 20 units (approximately the national average for the deprivation index). It would seem that the lower proportion admitted via the ED in the areas with higher deprivation may arise from
higher non-essential use of the ED. In addition, the proportion admitted is highly dependent on age and lower deprivation is usually associated with fewer children, while higher deprivation is usually associated with more children, including single parent families [24].
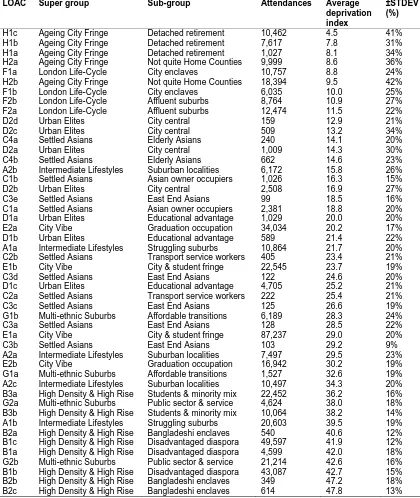
Since deprivation and social group are often inter-related Table 1 lists the average deprivation index score of each social group (plus standard deviation associated with the deprivation index scores expressed as a percentage of the average) for persons attending the Kings College emergency department. In this table the average deprivation index is determined over the total number of attendances, hence will be most influenced by those Output Areas closest to KCH.
As can be seen areas of ‘comfortable’ retirement generally have the lowest deprivation scores (which also includes retired Asians), however, the Bangladeshi sub-group is generally characterized by the highest levels of deprivation, along with the ‘Disadvantaged Diaspora’ who will generally have high unemployment, tend to be on benefits and live in
Fig. 1. Effect of deprivation on the proportion admitted from the emergency department
Each data point (up to deprivation index =20) is an average of 100 Output Area ranked by increasing deprivation index, above a deprivation index of 20 the average proportion admitted is calculated by increments of 5 units of
deprivation index. In England, the national average for deprivation index is around 22 units 15%
20% 25% 30% 35% 40% 45%
0 5 10 15 20 25 30 35 40 45 50 55
P
ro
p
o
rt
io
n
a
d
m
it
te
d
(
%
)
Galley Proof
Table 1. Average index of multiple deprivation score (deprivation index) for different social groups (LOAC) attending the emergency department at Kings College
LOAC Super group Sub-group Attendances Average
deprivation index
±STDEV (%)
H1c Ageing City Fringe Detached retirement 10,462 4.5 41%
H1b Ageing City Fringe Detached retirement 7,617 7.8 31%
H1a Ageing City Fringe Detached retirement 1,027 8.1 34%
H2a Ageing City Fringe Not quite Home Counties 9,999 8.6 36%
F1a London Life-Cycle City enclaves 10,757 8.8 24%
H2b Ageing City Fringe Not quite Home Counties 18,394 9.5 42%
F1b London Life-Cycle City enclaves 6,035 10.0 25%
F2b London Life-Cycle Affluent suburbs 8,764 10.9 27%
F2a London Life-Cycle Affluent suburbs 12,474 11.5 22%
D2d Urban Elites City central 159 12.9 21%
D2c Urban Elites City central 509 13.2 34%
C4a Settled Asians Elderly Asians 240 14.1 20%
D2a Urban Elites City central 1,009 14.3 30%
C4b Settled Asians Elderly Asians 662 14.6 23%
A2b Intermediate Lifestyles Suburban localities 6,172 15.8 26%
C1b Settled Asians Asian owner occupiers 1,026 16.3 15%
D2b Urban Elites City central 2,508 16.9 27%
C3e Settled Asians East End Asians 99 18.5 16%
C1a Settled Asians Asian owner occupiers 2,381 18.8 20%
D1a Urban Elites Educational advantage 1,029 20.0 20%
E2a City Vibe Graduation occupation 34,034 20.2 17%
D1b Urban Elites Educational advantage 589 21.4 22%
A1a Intermediate Lifestyles Struggling suburbs 10,864 21.7 20%
C2b Settled Asians Transport service workers 405 23.4 21%
E1b City Vibe City & student fringe 22,545 23.7 19%
C3d Settled Asians East End Asians 122 24.6 20%
D1c Urban Elites Educational advantage 4,705 25.2 21%
C2a Settled Asians Transport service workers 222 25.4 21%
C3c Settled Asians East End Asians 125 26.6 19%
G1b Multi-ethnic Suburbs Affordable transitions 6,189 28.3 24%
C3a Settled Asians East End Asians 128 28.5 22%
E1a City Vibe City & student fringe 87,237 29.0 20%
C3b Settled Asians East End Asians 103 29.2 9%
A2a Intermediate Lifestyles Suburban localities 7,497 29.5 23%
E2b City Vibe Graduation occupation 16,942 30.2 19%
G1a Multi-ethnic Suburbs Affordable transitions 1,527 32.6 19% A2c Intermediate Lifestyles Suburban localities 10,497 34.3 20% B3a High Density & High Rise Students & minority mix 22,452 36.2 16% G2a Multi-ethnic Suburbs Public sector & service 4,624 38.0 18% B3b High Density & High Rise Students & minority mix 10,064 38.2 14% A1b Intermediate Lifestyles Struggling suburbs 20,603 39.5 19% B2a High Density & High Rise Bangladeshi enclaves 540 40.6 12% B1c High Density & High Rise Disadvantaged diaspora 49,597 41.9 12% B1a High Density & High Rise Disadvantaged diaspora 4,599 42.0 18% G2b Multi-ethnic Suburbs Public sector & service 21,214 42.6 16% B1b High Density & High Rise Disadvantaged diaspora 43,087 42.7 15% B2b High Density & High Rise Bangladeshi enclaves 349 47.2 18% B2c High Density & High Rise Bangladeshi enclaves 614 47.8 13%
state-funded accommodation. Also seen in
Table 1 is the fact that by far the most ED attendances (87,237) occur in social group E1a (City Vibe: City and student fringe),
while a further 92,684 occur in the two highly deprived groups B1b and B1c (High Rise:
Galley Proof
3.1.3 Social group and proportion admitted via the ED
To investigate potential interactions between social group and deprivation, the Output Area deprivation index was divided into five groups with deprivation index values 0-15, 15-25, 25-35, 35-40 and 40+ respectively. Tables 2 and A1 (in the Appendix) present information regarding the proportion admitted as an inpatient (emergency) via the ED while Tables 3 and A2 present information regarding the proportion of inpatients who progress to admission into the general surgical and medical CCU. The first table in each set gives data regarding social group while the second table shows each social group sub-divided into deprivation index bands.
Data in each table only includes groups where the actual admissions versus expected admissions exceed the 95% CI, i.e. > 2 STDEV equivalents.
As can be seen in Table 2 lower proportion admitted appear to be related to more disadvantaged social groups while higher proportion admitted mainly occurs in older and more affluent social groups. As expected from Fig. 1, Table A1 demonstrates that a lower proportion admitted is generally associated with higher deprivation index bands, however even low deprivation index Asian social groups show low proportion admitted as opposed to high proportion among largely white affluent social groups.
The situation regarding conversion from admitted via the ED to care in the CCU reveals high conversion for Asian and mixed ethnic groups and low conversion in the older and more affluent groups (Table 3) while Table A2 demonstrates that the effect in Asians (high conversion) is largely independent of deprivation index while in groups with lower conversion rates, social group (LOAC) also seems to have a stronger influence than deprivation index per se.
3.1.4 Social group and proportion who die in the ED
Table provides details of the social groups with statistically significant higher/lower proportions of persons who die in the ED. Social groups with a higher proportion of deaths in the ED generally have elder people and fewer persons from high deprivation areas. The latter group have a lower proportion who die by virtue of higher numbers of
attendances for primary care treatable conditions.
3.1.5 Social group and length of stay in the CCU
The average length of stay (LOS) in the CCU will be influenced by patient acuity and the case-mix for the presenting condition(s). Table 5 details social groups with significantly different average LOS in the CCU. Social groups with higher proportions of older people appear to have a higher average LOS probably due to both age and a more acute case-mix.
The issue of case-mix and complexity can be explored using the days of specialist nursing input assigned to each stay in the CCU, i.e. respiratory, cardiovascular, renal, etc, and the results of such analysis are presented in Table A3. Patients in the CCU can have multiple instances of specialist input delivered on the same day or throughout their entire stay. Hence the ratio of total days of specialist input to the LOS in the CCU gives a measure of case complexity. Results in Table A3 are ranked by the number of admissions to the CCU from each social group (highest at the top). This table gives the number of admissions from each social group into the CCU, the average length of stay (LOS), the ratio of total care days to average LOS, and the ratio of actual care days to that expected from the all-London average for each care type. As is expected the volatility in the ratio of actual care days to that expected from the average increases as size reduces.
For social groups with more than 100 admissions the maximum and minimum ratio of actual to expected days of input from different types of care are highlighted. For example, the amount of specialist dermatological input ranges from 69% lower than expected for social group H1C (Ageing City Fringe: Detached Retirement) through to 64% above average for social group B3a (High Density& High Rise: Students & Minority Mix). This latter group being an obvious target for dermatological primary care preventative intervention.
Galley Proof
8
Table 2. Social groups split by deprivation index band having statistically significant higher/lower proportion admitted from the ED
LOAC Super group Sub group Deprivation index Attended Admitted Expected Difference as STDEV Proportion admitted
B1c High Density & High Rise Disadvantaged diaspora 40+ 31,026 4,499 6,947 -29.4 15%
B1c High Density & High Rise Disadvantaged diaspora 35-40 15,286 2,182 3,423 -21.2 14%
B3a High Density & High Rise Students & minority mix 25-35 10,111 1,311 2,264 -20.0 13%
B1b High Density & High Rise Disadvantaged diaspora 40+ 31,456 5,432 7,043 -19.2 17%
E1a City Vibe City & student fringe 25-35 51,594 9,533 11,552 -18.8 18%
E2a City Vibe Graduation occupation 15-25 30,235 5,261 6,770 -18.3 17%
E1b City Vibe City & student fringe 15-25 13,028 2,073 2,917 -15.6 16%
B1b High Density & High Rise Disadvantaged diaspora 25-35 5,510 785 1,234 -12.8 14%
E2b City Vibe Graduation occupation 25-35 11,342 1,962 2,539 -11.5 17%
E1b City Vibe City & student fringe 25-35 8,772 1,476 1,964 -11.0 17%
B1c High Density & High Rise Disadvantaged diaspora 25-35 3,285 443 736 -10.8 13%
E1a City Vibe City & student fringe 15-25 23,788 4,540 5,326 -10.8 19%
B1b High Density & High Rise Disadvantaged diaspora 35-40 6,123 1,001 1,371 -10.0 16%
G1b Multi-ethnic Suburbs Affordable transitions 25-35 3,175 493 711 -8.2 16%
B3b High Density & High Rise Students & minority mix 25-35 2,814 437 630 -7.7 16%
B3a High Density & High Rise Students & minority mix 35-40 6,278 1,138 1,406 -7.1 18%
B3a High Density & High Rise Students & minority mix 40+ 5,952 1,104 1,333 -6.3 19%
D1c Urban Elites Educational advantage 15-25 2,244 364 502 -6.2 16%
G1b Multi-ethnic Suburbs Affordable transitions 15-25 2,244 364 502 -6.2 16%
D1a Urban Elites Educational advantage 15-25 840 105 188 -6.1 13%
E2a City Vibe Graduation occupation 1-15 1,826 288 409 -6.0 16%
G2b Multi-ethnic Suburbs Public sector & service 40+ 13,520 2,730 3,027 -5.4 20%
E2b City Vibe Graduation occupation 35-40 2,764 489 619 -5.2 18%
E2a City Vibe Graduation occupation 25-35 1,973 334 442 -5.1 17%
D1c Urban Elites Educational advantage 25-35 2,365 415 530 -5.0 18%
B3b High Density & High Rise Students & minority mix 35-40 4,112 774 921 -4.8 19%
G2b Multi-ethnic Suburbs Public sector & service 35-40 5,025 966 1,125 -4.7 19%
E2b City Vibe Graduation occupation 15-25 1,710 298 383 -4.3 17%
G2a Multi-ethnic Suburbs Public sector & service 40+ 1,760 316 394 -3.9 18%
G1a Multi-ethnic Suburbs Affordable transitions 25-35 745 118 167 -3.8 16%
G1a Multi-ethnic Suburbs Affordable transitions 35-40 450 65 101 -3.6 14%
C1a Settled Asians Asian owner occupiers 15-25 1,859 348 416 -3.3 19%
G1b Multi-ethnic Suburbs Affordable transitions 35-40 344 48 77 -3.3 14%
C3c Settled Asians East End Asians 25-35 75 4 17 -3.1 5%
G2a Multi-ethnic Suburbs Public sector & service 35-40 1,484 276 332 -3.1 19%
Galley Proof
9
LOAC Super group Sub group Deprivation index Attended Admitted Expected Difference as STDEV Proportion admitted
G2b Multi-ethnic Suburbs Public sector & service 25-35 2,571 509 576 -2.8 20%
D1a Urban Elites Educational advantage 25-35 110 11 25 -2.7 10%
G1a Multi-ethnic Suburbs Affordable transitions 40+ 133 15 30 -2.7 11%
B2a High Density & High Rise Bangladeshi enclaves 25-35 40 1 9 -2.7 3%
C1a Settled Asians Asian owner occupiers 1-15 387 63 87 -2.5 16%
E1a City Vibe City & student fringe 1-15 287 44 64 -2.5 15%
B2c High Density & High Rise Bangladeshi enclaves 40+ 559 97 125 -2.5 17%
D2b Urban Elites City central 15-25 1,372 264 307 -2.5 19%
E1b City Vibe City & student fringe 35-40 228 34 51 -2.4 15%
C3b Settled Asians East End Asians 25-35 103 12 23 -2.3 12%
B2b High Density & High Rise Bangladeshi enclaves 25-35 30 1 7 -2.2 3%
E2b City Vibe Graduation occupation 1-15 338 57 76 -2.1 17%
C3d Settled Asians East End Asians 15-25 81 9 18 -2.1 11%
B2a High Density & High Rise Bangladeshi enclaves 40+ 378 65 85 -2.1 17%
D2c Urban Elites City central 15-25 158 23 35 -2.1 15%
E2b City Vibe Graduation occupation 40+ 788 149 176 -2.1 19%
C2b Settled Asians Transport service workers 25-35 122 17 27 -2.0 14%
F1b London Life-Cycle City enclaves 15-25 132 41 30 2.1 31%
A1a Intermediate Lifestyles Struggling suburbs 35-40 23 10 5 2.1 43%
H2a Ageing City Fringe Not quite Home Counties 15-25 333 100 75 2.9 30%
D2a Urban Elites City central 1-15 457 135 102 3.2 30%
A1b Intermediate Lifestyles Struggling suburbs 25-35 3,597 901 805 3.4 25%
A1a Intermediate Lifestyles Struggling suburbs 25-35 2,265 591 507 3.7 26%
F2a London Life-Cycle Affluent suburbs 15-25 1,272 348 285 3.7 27%
A1b Intermediate Lifestyles Struggling suburbs 15-25 448 142 100 4.2 32%
H1b Ageing City Fringe Detached retirement 15-25 21 14 5 4.3 67%
A2b Intermediate Lifestyles Suburban localities 25-35 234 84 52 4.4 36%
F1a London Life-Cycle City enclaves 15-25 26 17 6 4.6 65%
A1b Intermediate Lifestyles Struggling suburbs 35-40 8,130 2,036 1,820 5.1 25%
G2b Multi-ethnic Suburbs Public sector & service 15-25 106 49 24 5.2 46%
H1a Ageing City Fringe Detached retirement 1-15 1,027 311 230 5.3 30%
F2b London Life-Cycle Affluent suburbs 15-25 785 293 176 8.8 37%
A2c Intermediate Lifestyles Suburban localities 15-25 805 300 180 8.9 37%
A2a Intermediate Lifestyles Suburban localities 35-40 1,480 516 331 10.1 35%
F2a London Life-Cycle Affluent suburbs 1-15 11,204 3,080 2,509 11.4 27%
A1b Intermediate Lifestyles Struggling suburbs 40+ 8,428 2,463 1,887 13.3 29%
A2b Intermediate Lifestyles Suburban localities 1-15 2,933 1,000 657 13.4 34%
Galley Proof
10
LOAC Super group Sub group Deprivation index Attended Admitted Expected Difference as STDEV Proportion admitted
A2c Intermediate Lifestyles Suburban localities 35-40 1,949 736 436 14.3 38%
H2b Ageing City Fringe Not quite Home Counties 15-25 2,005 798 449 16.5 40%
A2b Intermediate Lifestyles Suburban localities 15-25 3,005 1,122 673 17.3 37%
A2a Intermediate Lifestyles Suburban localities 15-25 2,166 969 485 22.0 45%
A2a Intermediate Lifestyles Suburban localities 25-35 3,632 1,446 813 22.2 40%
A2c Intermediate Lifestyles Suburban localities 25-35 5,099 1,911 1,142 22.8 37%
F2b London Life-Cycle Affluent suburbs 1-15 7,980 2,774 1,787 23.4 35%
H2a Ageing City Fringe Not quite Home Counties 1-15 9,666 3,431 2,164 27.2 35%
H1c Ageing City Fringe Detached retirement 1-15 10,462 4,306 2,342 40.6 41%
H1b Ageing City Fringe Detached retirement 1-15 7,596 3,382 1,701 40.8 45%
H2b Ageing City Fringe Not quite Home Counties 1-15 16,389 6,925 3,669 53.7 42%
Table 3. Conversion rates for social groups (with additional banding by deprivation score) admitted via the ED and then progressing to the general surgical and medical critical care unit
LOAC Super group Sub group Deprivation
index
Admitted via the ED
CCU admitted
CCU expected
Difference as STDEV
Conversion
C2b Settled Asians Transport service 15-25 59 13 4 4.6 22.0%
C2a Settled Asians Transport service 25-35 25 7 2 4.2 28.0%
C1a Settled Asians Asian owner occupiers 1-15 63 12 4 3.9 19.0%
B2c High Density & High Rise Bangladeshi enclaves 25-35 11 4 1 3.8 36.4%
A1a Intermediate Lifestyles Struggling suburbs 1-15 107 16 7 3.4 15.0%
G2a Multi-ethnic Suburbs Public sector & service 40+ 316 35 21 3.1 11.1%
D1a Urban Elites Educational advantage 15-25 105 14 7 2.7 13.3%
C2a Settled Asians Transport service 15-25 19 4 1 2.5 21.1%
D1b Urban Elites Educational advantage 25-35 47 7 3 2.2 14.9%
C1a Settled Asians Asian owner occupiers 15-25 348 33 23 2.1 9.5%
G1a Multi-ethnic Suburbs Affordable transitions 40+ 15 3 1 2.0 20.0%
E2b City Vibe Graduation occupation 35-40 489 21 32 -2.0 4.3%
F1b London Life-Cycle City enclaves 1-15 1,256 64 83 -2.1 5.1%
A1b Intermediate Lifestyles Struggling suburbs 35-40 2,036 108 134 -2.3 5.3%
B3b High Density/High Rise Students & minority mix 35-40 774 34 51 -2.4 4.4%
B3a High Density/High Rise Students & minority mix 40+ 1,104 52 73 -2.4 4.7%
E2b City Vibe Graduation occupation 25-35 1,962 99 129 -2.7 5.0%
A2a Intermediate Lifestyles Suburban localities 35-40 516 18 34 -2.7 3.5%
Galley Proof
11
LOAC Super group Sub group Deprivation
index
Admitted via the ED
CCU admitted
CCU expected
Difference as STDEV
Conversion
F1a London Life-Cycle City enclaves 1-15 2,429 122 160 -3.0 5.0%
A2c Intermediate Lifestyles Suburban localities 35-40 736 27 48 -3.1 3.7%
E2a City Vibe Graduation occupation 15-25 5,261 285 347 -3.3 5.4%
B1b High Density & High Rise Disadvantaged diaspora 35-40 1,001 39 66 -3.3 3.9%
A2b Intermediate Lifestyles Suburban localities 15-25 1,122 44 74 -3.5 3.9%
B1b High Density & High Rise Disadvantaged diaspora 40+ 5,432 288 358 -3.7 5.3%
A2b Intermediate Lifestyles Suburban localities 1-15 1,000 34 66 -3.9 3.4%
B1c High Density & High Rise Disadvantaged diaspora 40+ 4,499 226 296 -4.1 5.0%
A2a Intermediate Lifestyles Suburban localities 15-25 969 31 64 -4.1 3.2%
E1a City Vibe City & student fringe 25-35 9,533 524 628 -4.2 5.5%
H2b Ageing City Fringe Not quite Home Counties 15-25 798 19 53 -4.6 2.4%
H2a Ageing City Fringe Not quite Home Counties 1-15 3,431 153 226 -4.9 4.5%
F2a London Life-Cycle Affluent suburbs 1-15 3,080 129 203 -5.2 4.2%
A2a Intermediate Lifestyles Suburban localities 25-35 1,446 39 95 -5.8 2.7%
A2c Intermediate Lifestyles Suburban localities 25-35 1,911 58 126 -6.1 3.0%
A2c Intermediate Lifestyles Suburban localities 40+ 930 12 61 -6.3 1.3%
F2b London Life-Cycle Affluent suburbs 1-15 2,774 91 183 -6.8 3.3%
H1c Ageing City Fringe Detached retirement 1-15 4,306 123 284 -9.5 2.9%
H1b Ageing City Fringe Detached retirement 1-15 3,382 77 223 -9.8 2.3%
H2b Ageing City Fringe Not quite Home Counties 1-15 6,925 242 456 -10.0 3.5%
Table 4. Social group and the proportion of persons who die in the ED
LOAC Super group Sub group Attended Died Expected Difference as STDEV Proportion
B1b High Density/High Rise Disadvantaged diaspora 43,089 22 43 -3.2 0.05%
B1c High Density/High Rise Disadvantaged diaspora 49,597 31 50 -2.6 0.06%
E1b City Vibe City & student fringe 22,545 11 23 -2.4 0.05%
G1b Multi-ethnic Suburbs Affordable transitions 6,189 1 6 -2.1 0.02%
A1b Intermediate Lifestyles Struggling suburbs 20,603 30 21 2.1 0.15%
F1a London Life-Cycle City enclaves 10,757 18 11 2.2 0.17%
H1c Ageing City Fringe Detached retirement 10,462 18 10 2.3 0.17%
A2b Intermediate Lifestyles Suburban localities 6,172 13 6 2.8 0.21%
Galley Proof
12
Table 5. Social group (LOAC) and length of stay in the CCU
LOAC Super group Sub group CCU admissions Bed days Expected Difference as STDEV AvLOS
B1b High Density & High Rise Disadvantaged diaspora 382 2579 2913 -6.2 6.8
B3b High Density & High Rise Students & minority mix 106 655 808 -5.4 6.2
D2b Urban Elites City central 30 151 229 -5.1 5.0
D1a Urban Elites Educational advantage 14 56 107 -4.9 4.0
C1a Settled Asians Asian owner occupiers 47 267 358 -4.8 5.7
F2a London Life-Cycle Affluent suburbs 144 941 1098 -4.7 6.5
E2b City Vibe Graduation occupation 148 998 1129 -3.9 6.7
H1c Ageing City Fringe Detached retirement 123 830 938 -3.5 6.7
G2a Multi-ethnic Suburbs Public sector & service 77 512 587 -3.1 6.6
G1a Multi-ethnic Suburbs Affordable transitions 19 110 145 -2.9 5.8
E2a City Vibe Graduation occupation 327 2356 2494 -2.8 7.2
E1a City Vibe City & student fringe 963 7120 7344 -2.6 7.4
D2a Urban Elites City central 17 101 130 -2.5 5.9
G2b Multi-ethnic Suburbs Public sector & service 308 2453 2349 2.1 8.0
B1c High Density & High Rise Disadvantaged diaspora 366 2924 2791 2.5 8.0
C1b Settled Asians Asian owner occupiers 18 167 137 2.5 9.3
A1a Intermediate Lifestyles Struggling suburbs 197 1661 1502 4.1 8.4
F2b London Life-Cycle Affluent suburbs 98 861 747 4.2 8.8
E1b City Vibe City & student fringe 234 1975 1784 4.5 8.4
H1a Ageing City Fringe Detached retirement 25 279 191 6.4 11.2
H2b Ageing City Fringe Not quite Home Counties 261 2303 1990 7.0 8.8
Galley Proof
Fig. 2. Relationship between average LOS and the ratio of specialist days per day stay
3.2 Discussion
The aim of this study was to locate small area geographies where the proportions are statistically different, i.e. top or bottom rank in the various tables in this study. To achieve this purpose no age-standardization is required, i.e. an old but affluent population is likely to have an equally high rate of attendance/admission to a younger Asian population (with known disposition to heart disease). From an attendance/admission avoidance perspective both are equally important.
This study is part of a wider series investigating the use of social groups as a means of segmenting the population with a view to targeted preventative health care interventions [24]. Social grouping is widely used in the marketing industry to identify groups of people most likely to purchase particular items (or groups of items). To our knowledge this is the first study which uses social groups to follow the flow of patients via the emergency department to inpatient admission and time in the CCU.
For the purpose of this type of study the Output Area code (separately derived from the postcode) has the huge advantage that all addresses are effectively anonymized and individual persons cannot be identified. By virtue
of the Output Area code it is then possible to create additional social groupings via links with other data collected at Output Area level, hence the Lower Super Output Area-deprivation index groupings created for Table 1. In the UK, the Output Area Classification (OAC) and London Output Area Classification (LOAC) have the added advantage that they are free of charge for
non-commercial use and hence NHS
organizations such as Clinical Commissioning Groups are able to make use of these powerful segmentation tools without recourse to very expensive commercial alternatives. Further sub-division of social groups into broad deprivation index bands (Table A2) was shown to sharpen the specificity of the method to identifying precise Output Area to target for admission avoidance strategies.
The simple statistical test used in this study relies on the fact that the standard deviation of a Poisson distribution is by definition equal to the square root of the average. Hence any deviation from the population average can be converted into a standard deviation equivalent difference. Differences from the average can then be ranked from highest to lowest standard deviation equivalent difference. The advantage is that NHS managers can quickly rank results in order of standard deviation equivalents. Precise tests for statistical significance are not needed since this
Ratio specialist days = 0.082xLOS + 2.1
2.0 2.2 2.4 2.6 2.8 3.0 3.2 3.4 3.6 3.8
3.5 5.5 7.5 9.5 11.5 13.5 15.5 17.5
R
a
ti
o
o
f
sp
e
ci
a
li
st
d
a
y
s
p
e
r
d
a
y
s
ta
y
Galley Proof method initiates a process of further evaluation for those social groups that may look to be of interest.
Deprivation is well known for its relationship with poor health, and higher deprivation is known to be associated with higher levels of depression, multi-morbidity, mortality and overall health care costs [25]. As has been demonstrated in the US, composite measures of deprivation are far better at detecting health inequalities than just poverty alone [26], and hence the UK Index of Multiple Deprivation (deprivation index) which uses 37 indicators across seven domains of deprivation is a balanced tool [27]. For example, one study of CCU admissions in England, using the deprivation index demonstrated that persons in the most deprived quintile had a 19% higher (adjusted odds ratio) risk of dying in the CCU [28].
However, from Table 1 it was apparent that social group and deprivation are strongly related. London is very cosmopolitan with a diverse racial mix. Racial factors are known to predispose certain groups to particular diseases [29], and the LOAC should be sensitive to these subtle racial (and cultural) differences. An interesting example is the apparent need for far higher levels of dermatological input into CCU patients coming from group B3a (High Density & High Rise: Students & Minority Mix) identified in Table A3. Of particular relevance in London is the known disposition of Asians to diabetes and heart disease [30], and consequent diabetes-associated end stage renal failure [31]. Group C is mainly comprised of Asians, while B2 is further
characterized by Bangladeshi descent. Hence it is social group (LOAC) rather than deprivation
which tends to drive the ranking in Tables 2 and 3.
The role of social group in the proportion admitted as an inpatient (Tables 1 and 2) or who die in A&E (Table 5) is a mix of competing forces. Average age will increase the proportion admitted [24], while higher deprivation will increase the number of lower acuity attendances (Tables 1 and 2) [24]. In this respect any Clinical Commissioning Group seeking to target vulnerable social groups will also be looking at those groups with the highest number of attendances/admissions, and hence the greatest opportunity for attendance/admission avoidance. Hence by virtue of sheer weight of numbers groups E1a (87,000 attendances), B1c (50,000 attendances) and B1b (43,000) attendances
would be a primary focus in attempts to reduce A&E attendance, etc.
The results presented in Tables 5 and A3 regarding the role of social group on length of stay and resource input in the CCU are of interest. In a study of adult general critical care units in the UK it was established that non-survivors tended to stay longer in the CCU but had shorter total hospital length of stay [32]. In Table 5 it was noted that certain social groups had statistically higher average LOS in the CCU, especially certain members of Super Group H (affluent retirement). Table A3 further identified social groups with high/low input from specialist nursing for particular body systems (respiratory, cardiovascular, etc). For example, group F2a (London City life cycle: Affluent suburbs) had 66% higher input for liver function, while B3a (High density/High Rise: Students & Minority Mix) had 52% higher neurological input, and E1b (City Vibe: City & Student Fringe) had 70% higher dermatological input.
All of the above point to the fact that social group plays a major role in the flows of patients to the ED, then admission and (for some) time in the CCU. Social group is far more powerful than deprivation alone, in that deprivation is unable to segment based on the subtler ethnic (and cultural, including diet and nutrition) differences between areas with apparently similar deprivation.
4. LIMITATIONS OF THE STUDY AND FURTHER RESEARCH
This study is limited to the patients attending/admitted to just one London hospital. As a consequence, many LOAC have too few attendances/admissions to establish statistical significance. Indeed, this study has too few attendances/admissions to evaluate the role of deprivation within different social groups, i.e. are some social groups more sensitive to differences in deprivation than others. A London-wide study would seem justified.
Galley Proof major supermarket chains making use of the information available via customer loyalty cards.
5. CONCLUSIONS
The Output Area Classification and associated measure of deprivation provide a readily accessible way to segment the population into small areas (approximately 300 persons) with a high proportion of admission via the ED or risk of CCU admission following admission via the ED. The method is also more widely applicable to emergency admissions in general, i.e. not just via the ED, where deprivation is also associated with higher admission rates [33].
The Output Area Classification has the advantage over the deprivation index in that it contains social groups with particular ethnic/racial characteristics (cultural, dietary, genetic) which are relevant to health care utilization. Combinations of the Output Area Classification and the deprivation index (as illustrated in this study) may also be used to identify specific geographic areas with very high utilization arising from high-risk health behaviors or due to ethnic origin or cultural factors.
As expected, different social groups display different patterns of acute utilization as measured by attendance rates at the ED, proportion admitted as an inpatient and the case mix and average length of stay in the CCU. Use of this method to target different groups with specific health education and primary care support requires further investigation.
This study needs to be repeated using a larger population sample (possibly the whole of London) in order to quantify all types of social groups available via the LOAC, and to further quantify the sensitivity of different LOAC (social) groups to deprivation.
CONSENT
It is not applicable. This study only uses administrative data.
ETHICAL APPROVAL
It is not applicable. No patient identifiable data was used in this study.
COMPETING INTERESTS
Authors have declared that no competing interests exist.
REFERENCES
1. Welsh Government. Together for Health – A Delivery Plan for the Critically Ill; 2013. (Accessed 8 May 2016)
Available:http://www.wales.nhs.uk/docume nts/delivery-plan-for-the-critically-ill.pdf 2. Appleby J. Debate Surrounds End-of-life
Health Care Costs. USA Today, October 19; 2006.
(Accessed 8 May 2016)
Available:www.usatoday.com/money/indus
tries/health/2006-10-18-end-of-life-costs_x.htm
3. Luce J, Rubenfeld G. Can health care costs be reduced by limiting intensive care at the end of life? Am J Respir Crit Care Med. 2001;165(6):750-4.
4. Pastores S, Dakwar J, Halpern N. Costs of critical care medicine. Crit Care Clin. 2012; 28(1):1-10.
DOI: 10.1016/j.ccc.2011.10.003
5. Halpern N, Pastores S. Critical care medicine beds, use, occupancy, and costs in the United States: A methodological review. Crit Care Med. 2015;43(11):2452-9.
DOI: 10.1097/CCM.0000000000001227 6. Beeknoo N, Jones R. Achieving economy
of scale in critical care, planning information necessary to support the choice of bed numbers. Brit J Med Medical Res; 2016. (In press).
7. Jones R. The unprecedented growth in medical admissions in the UK: The ageing population or a possible infectious/immune aetiology? Epidemiology (Sunnyvale)|: Open Access. 2016;6(1):1000219. 8. Jones R. Rising emergency admissions in
the UK and the elephant in the room. Epidemiology (Sunnyvale)|: Open Access. 2016;6(4):1000261.
DOI: 10.4172/2161-1165.1000261 9. Afessa B, Keegan M. Predicting mortality
in intensive care unit survivors using a subjective scoring system. Crit Care. 2007; 11:109.
DOI: 10.1186/cc5683
10. De Rooj S, Abu-Hanna A, Levi M, de Jonge E. Factors that predict outcome of intensive care treatment in very elderly patients: A review. Crit Care 2005;9(4): R307-R314.
DOI: 10.1186/cc3536
Galley Proof accuracy of outcome prediction scoring systems. Chest. 2012;141(1):245-52. DOI: 10.1378/chest.11-0330
12. Braun A, Gibbons F, Litonjua A, Giovannuci E, Christopher K. Low serum 25-hydroxyvitamin D at critical care initiation is associated with increased mortality. Crit Care Med. 2012;40(1):63-72. DOI: 10.1097/CCM.0b013e31822d74f3 13. Moonesinghe S, Mythen M, Das P, Rowan
K, Grocott M. Risk stratification tools for predicting morbidity and mortality in adult patients undergoing major surgery. Anesthesiology. 2013;119(4):959-81.
14. Neighbourhood Statistics. Area
Classifications; 2015. (Accessed 1 August 2016)
Available:http://neighbourhood.statistics.go v.uk/HTMLDocs/nessgeography/areaclassi fication/area-classification.htm
15. London Data Store. London Output Area Classification.
(Accessed 8 May 2016)
Available:http://data.london.gov.uk/dataset/ london-area-classification
16. GOV. UK. English Indices of Deprivation; 2015.
(Accessed 1 August 2016)
Available:https://www.gov.uk/government/c ollections/english-indices-of-deprivation 17. Adams J, White M. Removing the health
domain from the deprivation index 2004 – effect on measured inequalities in census measures of health. J Public Health. 2006; 28(4):379-83.
18. Bauld L, Judge K, Platt S. Assessing the impact of smoking cessation services on reducing health inequalities in England: Observational study. Tobacco Control. 2007;16:400-4.
19. Heslehurst N, Ells L, Simpson H, Batterham A, Wilkinsom J, Summerbell C. Trends in maternal obesity incidence rates, demographic predictors, and health inequalities in 36 821 women over a 15-year period. BJOG. 2007;114(2):187-94. 20. Kandt J. Geodemographics and spatial
microsimulation: Using survey data to infer health milieu geographies. Department of Geography, University College London; 2015.
(Accessed 8 May 2016)
Available:http://leeds.gisruk.org/abstracts/ GISRUK2015_submission_126.pdf 21. Payne R, Abel G. UK indices of multiple
deprivation - a way to make comparisons
across constituent countries easier. Health Statistics Quarterly 53; 2012.
(Accessed 1 August 2016)
Available:http://www.ons.gov.uk/ons/rel/hs q/health-statistics-quarterly/no--53--spring-
2012/uk-indices-of-multiple-deprivation.html
22. Peacock P, Peacock J. Emergency call work-load, deprivation and population density: An investigation into ambulance services across England. Journal of Public Health. 2006;28(2):111-5.
23. Roberts S, Williams J, Meddings D, Goldacre M. Incidence and case fatality for acute pancreatitis in England: Geographical variation, social deprivation, alcohol consumption and aetiology – a record linkage study. Alimentary Pharmacology & Therapeutics. 2008;28(7): 931-41.
24. Beeknoo N, Jones R. Factors influencing A & E attendance, admissions and waiting times at two London Hospitals. Brit J Med Medical Res; 2016. (In press).
25. Charlton J, Rudisill C, Bhattarai N, Gulliford M. Impact of deprivation on occurrence, outcomes and health care costs of people with multiple morbidity. J Health Serv Res Policy. 2013;18(4):215-23.
26. Butler D, Petterson S, Phillips R, Bazemore A. Measures of social deprivation that predict health care access and need within a rational area of primary care service delivery. Health Serv Res. 2013;48(2pt1):539-59.
27. GOV. UK. English Indices of Deprivation; 2015.
(Accessed 22/08/2016)
Available:https://www.gov.uk/government/s tatistics/english-indices-of-deprivation-2015
28. Welch C, Harrison D, Hutchings A, Rowan K. The association between deprivation and hospital mortality for admissions to critical care units in England. J Crit Care. 2010;25(3):382-90.
29. Adekoya N, Hopkins R. Racial Disparities in Nationally Notifiable Diseases - United States, 2002. MMWR. 2005;54(1):9-11. (Accessed 20/08/2016)
Available:http://www.cdc.gov/mmwr/previe w/mmwrhtml/mm5401a4.htm
Galley Proof 30. Enas A, Vishwanathan M, Deepa M,
Farooq S, Pazhoor S, Chennikkara H. The metabolic syndrome and dyslipidemia among Asian Indians: A population with high rates of diabetes and premature coronary artery disease. J Cardio Metabolic Syndrome. 2007;2(4):267-75. DOI: 10.1111/j.1559-4564.2007.07392.x 31. Burden A, McNally P, Feehally J, Walls J.
Increased incidence of end-stage renal failure secondary to diabetes mellitus in Asian Ethnic Groups in the United Kingdom. Diabetic Medicine. 1992;9(7): 641-5.
DOI: 10.1111/j.1464-5491.1992.tb01860.x
32. Harrison D, Brady A, Rowan K. Case mix, outcome and length of stay for admissions to adult, general critical care units in England, Wales and Northern Ireland: The intensive care national audit & research centre case mix programme database. Critical Care. 2004;8R99-R111.
DOI: 10.1186/cc2834
33. Jones R. Benchmarking of emergency admissions with a length of stay greater than 0 days across the Thames Valley; 2006. Healthcare Analysis & Forecasting, Camberley.
(Accessed 8 May 2016)
Galley Proof
APPENDIX
Data Sources
The London Output Area Classification was obtained from the Greater London Authority, London Datastore website http://data.london.gov.uk/dataset/london-area-classification
Accessed 8 May 2016.
The 2011 Output Area (OA) population weighted centroids (Easting and Northing) were obtained from the Office for National Statistics (ONS) website http://www.ons.gov.uk/ons/guide-method/geography/products/census/spatial/centroids/index.html
Accessed 8 May 2016.
The 2011 Output Area to lower super output area (Lower Super Output Area) lookup was obtained from the ONS website, sub-section ‘Lookups between 2011 Census output areas and other geographies’
http://www.ons.gov.uk/ons/guide-method/geography/products/census/lookup/2011/index.html Accessed 8 May 2016.
The 2015 Deprivation index was obtained from the GOV.UK website
https://www.gov.uk/government/statistics/english-indices-of-deprivation-2015 Accessed 8 May 2016.
Mid-2013 population estimates for London OA’s were obtained from the ONS website http://www.ons.gov.uk/ons/publications/re-reference-tables.html?edition=tcm%3A77-367629
Accessed 8 May 2016.
Postcode to output area code lookup tables were obtained from the NHS England website
19
Table A1. Social groups having statistically significant higher/lower proportion of persons admitted via the emergency department
LOAC Super group Sub group Attended Admitted Expected Difference as STDEV Proportion admitted
B1c High Density & High Rise Disadvantaged diaspora 49,597 7,124 11,105 -37.8 14%
B1b High Density & High Rise Disadvantaged diaspora 43,089 7,218 9,648 -24.7 17%
B3a High Density & High Rise Students & minority mix 22,452 3,571 5,027 -20.5 16%
E1a City Vibe City & student fringe 87,248 16,697 19,535 -20.3 19%
E2a City Vibe Graduation occupation 34,034 5,883 7,620 -19.9 17%
E1b City Vibe City & student fringe 22,545 3,704 5,048 -18.9 16%
E2b City Vibe Graduation occupation 16,942 2,955 3,793 -13.6 17%
G1b Multi-ethnic Suburbs Affordable transitions 6,189 1,009 1,386 -10.1 16%
D1c Urban Elites Educational advantage 4,705 793 1,053 -8.0 17%
G2b Multi-ethnic Suburbs Public sector & service 21,222 4,254 4,752 -7.2 20%
D1a Urban Elites Educational advantage 1,029 128 230 -6.7 12%
B3b High Density & High Rise Students & minority mix 10,064 1,942 2,253 -6.6 19%
G1a Multi-ethnic Suburbs Affordable transitions 1,527 232 342 -5.9 15%
G2a Multi-ethnic Suburbs Public sector & service 4,624 894 1,035 -4.4 19%
C1a Settled Asians Asian owner occupiers 2,381 448 533 -3.7 19%
C3c Settled Asians East End Asians 125 12 28 -3.0 10%
D2c Urban Elites City central 509 86 114 -2.6 17%
C3d Settled Asians East End Asians 122 14 27 -2.5 11%
B2b High Density & High Rise Bangladeshi enclaves 349 56 78 -2.5 16%
B2a High Density & High Rise Bangladeshi enclaves 540 94 121 -2.4 17%
B2c High Density & High Rise Bangladeshi enclaves 614 110 137 -2.3 18%
C3b Settled Asians East End Asians 103 12 23 -2.3 12%
D2b Urban Elites City central 2,508 508 562 -2.3 20%
A1a Intermediate Lifestyles Struggling suburbs 10,865 2,585 2,433 3.1 24%
H1a Ageing City Fringe Detached retirement 1,027 311 230 5.3 30%
F2a London Life-Cycle Affluent suburbs 12,476 3,428 2,793 12.0 27%
A1b Intermediate Lifestyles Struggling suburbs 20,603 5,542 4,613 13.7 27%
A2b Intermediate Lifestyles Suburban localities 6,172 2,206 1,382 22.2 36%
F2b London Life-Cycle Affluent suburbs 8,765 3,067 1,962 24.9 35%
H2a Ageing City Fringe Not quite Home Counties 9,999 3,531 2,239 27.3 35%
A2c Intermediate Lifestyles Suburban localities 10,497 3,877 2,350 31.5 37%
A2a Intermediate Lifestyles Suburban localities 7,497 2,989 1,679 32.0 40%
H1c Ageing City Fringe Detached retirement 10,462 4,306 2,342 40.6 41%
H1b Ageing City Fringe Detached retirement 7,617 3,396 1,705 40.9 45%
20
Table A2. Conversion rates for social groups admitted via the ED and then progressing to the general surgical and medical critical care unit
LOAC Super group Sub group ED admitted CCU admitted CCU expected Difference as STDEV Conversion
C2a Settled Asians Transport service workers 45 17 3 8.2 37.8%
C2b Settled Asians Transport service workers 78 16 5 4.8 20.5%
C1a Settled Asians Asian owner occupiers 448 47 30 3.2 10.5%
C3a Settled Asians East End Asians 22 5 1 2.9 22.7%
All C above Settled Asians 593 85 39 7.3 14.3%
G2a Multi-ethnic Suburbs Public sector & service 894 77 59 2.4 8.6%
A1a Intermediate Lifestyles Struggling suburbs 2,585 197 170 2.0 7.6%
D1c Urban Elites Educational advantage 793 67 52 2.0 8.4%
D1b Urban Elites Educational advantage 113 13 7 2.0 11.5%
F1b London Life-Cycle City enclaves 1,297 67 85 -2.0 5.2%
B3a High Density & High Rise Students & minority mix 3,571 200 235 -2.3 5.6%
A1b Intermediate Lifestyles Struggling suburbs 5,542 315 365 -2.6 5.7%
E2a City Vibe Graduation occupation 5,883 327 388 -3.1 5.6%
F1a London Life-Cycle City enclaves 2,446 122 161 -3.1 5.0%
E2b City Vibe Graduation occupation 2,955 148 195 -3.3 5.0%
E1a City Vibe City & student fringe 16,697 963 1100 -4.1 5.8%
B1b High Density & High Rise Disadvantaged diaspora 7,218 382 476 -4.3 5.3%
B1c High Density & High Rise Disadvantaged diaspora 7,124 366 469 -4.8 5.1%
H2a Ageing City Fringe Not quite Home Counties 3,531 156 233 -5.0 4.4%
F2a London Life-Cycle Affluent suburbs 3,428 144 226 -5.4 4.2%
A2b Intermediate Lifestyles Suburban localities 2,206 79 145 -5.5 3.6%
F2b London Life-Cycle Affluent suburbs 3,067 98 202 -7.3 3.2%
A2a Intermediate Lifestyles Suburban localities 2,989 90 197 -7.6 3.0%
A2c Intermediate Lifestyles Suburban localities 3,877 116 255 -8.7 3.0%
H1c Ageing City Fringe Detached retirement 4,306 123 284 -9.5 2.9%
H1b Ageing City Fringe Detached retirement 3,396 77 224 -9.8 2.3%
H2b Ageing City Fringe Not quite Home Counties 7,723 261 509 -11.0 3.4%
21
Table A3. Case-mix differences in the CCU as measured by different types of specialist nursing input. Proportion of care days are relative to the all-admissions average
LOAC Admissions Av LOS
Ratio Basic respiratory
Advanced respiratory
Basic
cardiovascular
Advanced cardiovascular
Renal Neurological Liver Dermatological Gastrointestinal
Grand Total
8,360 7.6 2.7 100% 100% 100% 100% 100% 100% 100% 100% 100%
London 5,580 7.6 2.6 102% 99% 100% 96% 91% 88% 71% 89% 100%
Non-London
2,780 7.6 2.8 97% 102% 100% 108% 119% 124% 158% 122% 101%
E1a 966 7.4 2.5 104% 94% 100% 77% 74% 70% 38% 80% 97%
B1b 384 6.7 2.5 86% 82% 90% 92% 97% 66% 63% 56% 78%
B1c 369 8.0 2.6 94% 113% 109% 93% 97% 89% 78% 51% 106%
E2a 328 7.2 2.6 105% 90% 94% 84% 82% 67% 61% 109% 95%
A1b 317 7.4 2.6 120% 90% 101% 78% 72% 96% 62% 64% 99%
G2b 310 8.0 2.6 113% 100% 107% 91% 92% 74% 63% 103% 105%
H2b 265 8.8 2.7 119% 122% 112% 128% 100% 118% 61% 71% 122%
E1b 238 8.6 2.7 109% 120% 113% 125% 117% 80% 85% 170% 112%
A1a 204 8.4 2.7 101% 128% 107% 105% 95% 137% 93% 61% 118%
B3a 201 7.7 2.7 84% 99% 101% 102% 84% 152% 65% 164% 99%
H2a 158 7.5 2.7 101% 97% 92% 114% 119% 100% 64% 101% 104%
F2a 155 6.7 2.6 82% 85% 89% 92% 81% 90% 166% 41% 82%
E2b 150 6.7 2.5 80% 91% 93% 75% 43% 82% 89% 117% 81%
H1c 128 6.7 2.6 108% 70% 86% 116% 78% 73% 42% 31% 91%
F1a 124 7.8 2.7 106% 115% 105% 118% 86% 93% 38% 71% 108%
A2c 117 7.2 2.7 86% 93% 90% 137% 124% 96% 62% 77% 88%
B3b 106 6.2 2.5 93% 71% 82% 65% 48% 97% 66% 50% 74%
F2b 103 8.5 2.6 139% 89% 116% 94% 91% 117% 114% 101% 117%
A2a 91 7.8 2.8 95% 118% 103% 128% 81% 89% 80% 216% 113%
G2a 87 6.9 2.7 74% 96% 93% 94% 77% 134% 44% 9% 91%
G1b 85 7.1 2.5 78% 104% 84% 99% 93% 61% 79% 87% 84%
22
LOAC Admissions Av LOS
Ratio Basic respiratory
Advanced respiratory
Basic
cardiovascular
Advanced cardiovascular
Renal Neurological Liver Dermatological Gastrointestinal
H1b 78 11.2 2.8 147% 141% 144% 182% 204% 119% 49% 170% 157%
B1a 76 7.0 2.6 91% 87% 113% 31% 47% 66% 42% 203% 91%
D2(a-d) 72 4.9 2.6 72% 62% 64% 80% 86% 28% 128% 26% 47%
F1b 71 8.0 2.8 129% 88% 108% 84% 158% 161% 67% 26% 112%
D1c 67 8.0 2.7 120% 95% 103% 76% 109% 120% 109% 289% 107%
C1a 49 5.5 2.5 46% 78% 70% 91% 76% 34% 149% 70% 59%
H1a 29 10.0 2.6 231% 117% 129% 117% 43% 57% 44% 37% 157%
B2(a-c) 27 8.4 2.6 90% 123% 128% 35% 17% 198% 0% 0% 128%
G1a 24 5.4 2.4 52% 73% 56% 89% 75% 24% 132% 0% 64%
C1b 21 8.5 2.7 48% 155% 109% 169% 129% 55% 76% 0% 116%
C2a 20 8.6 2.8 73% 148% 89% 154% 87% 63% 270% 146% 131%
C2b 20 8.6 3.2 107% 122% 108% 177% 240% 58% 493% 305% 104%
D1a 16 3.8 2.3 42% 50% 56% 8% 18% 49% 79% 0% 38%
D1b 15 6.6 2.8 60% 104% 96% 49% 71% 181% 106% 0% 96%
C4(a,b) 14 6.5 2.9 72% 92% 76% 138% 121% 132% 272% 95% 78%
Fig. A1. Spatial co-ordinates (Easting, northing) for the home address of Londoners attending the KCH emergency department over a three-year period
_________________________________________________________________________________ © 2016 Beeknoo and Jones; This is an Open Access article distributed under the terms of the Creative Commons Attribution License (http://creativecommons.org/licenses/by/4.0), which permits unrestricted use, distribution, and reproduction in any medium, provided the original work is properly cited.
155000 160000 165000 170000 175000 180000 185000 190000 195000 200000
N
o
rt
h
in
g
(
m
e
te
rs
)
Easting (meters)
Peer-review history: