_____________________________________________________________________________________________________
*Corresponding author: Email: [email protected];
www.sciencedomain.org
Behavior Correlates of Post-Stroke Disability Using
Data Mining and Infographics
Sunmoo Yoon
1*and Jose Gutierrez
21
School of Nursing, Columbia University, New York, USA.
2
Department of Neurology, Columbia University, New York, USA.
Authors’ contributions
This work was carried out in collaboration between both authors. Authors SY and JG designed the study, wrote the manuscript, critically revised the manuscript for important intellectual content, had full access to all of the data in the study, and take responsibility for the integrity of the data and the accuracy of the data analysis. Both authors read and approved the final manuscript.
Article Information
DOI: 10.9734/BJMMR/2016/21601
Editor(s):
(1) Xin-an Liu, Neuroscience Department, the Scripps Research Institute, Scripps, Florida, USA.
Reviewers:
(1) Fernando Barra Quilez, Hospital MAZ, Zaragoza, Spain. (2)Xing Li, Mayo Clinic College of Medicine, USA. Complete Peer review History:http://sciencedomain.org/review-history/11610
Received 25th August 2015 Accepted 14th September 2015 Published 29th September 2015
ABSTRACT
Purpose: Disability is a potential risk for stroke survivors. This study aims to identify disability risk
factors associated with stroke and their relative importance and relationships from a national behavioral risk factor dataset.
Methods: Data of post-stroke individuals in the U.S (n=19,603) including 397 variables were
extracted from a publically available national dataset and analyzed. Data mining algorithms including C4.5 and linear regression with M5s methods were applied to build association models for post-stroke disability using Weka software. The relative importance and relationship of 70 variables associated with disability were presented in infographics for clinicians to understand easily.
Results: Fifty-five percent of post-stroke patients experience disability. Exercise, employment and
satisfaction of life were relatively important factors associated with disability among stroke patients. Modifiable behavior factors strongly associated with disability include exercise (OR: 0.46, P<0.01) and good rest (OR 0.37, P<0.01).
Conclusions: Data mining is promising to discover factors associated with post-stroke disability
from a large population dataset. The findings can be potentially valuable for establishing the
Yoon and Gutierrez; BJMMR, 11(5): 1-12, 2016; Article no.BJMMR.21601
priorities for clinicians and researchers and for stroke patient education. The methods may generalize to other health conditions.
Keywords: Stroke; patient outcome; data mining; visualization.
1. INTRODUCTION
In the United States, seven million stroke patients live beyond the acute stroke phase with significant disability and impairment [1]. Most have varying levels of disability [2]. Information provided by clinicians to patients and their families is often focused on etiology or pathophysiological facts such as the size and location of brain lesions [3]. In clinical settings, due to the sudden onset of the disease, stroke patients are often uncertain about their long-term prognosis. Nevertheless, predictors related to long-term stroke outcomes, such as early rehabilitation, smoking, drinking, early stroke recognition, and social support, have been rarely communicated to clinicians [2,4-6]. Moreover, patient-level phenotypes are vital for designing personalized stroke management after an initial incident but are often underused.
To date, methods to investigate post-stroke disability risk factors have been limited to traditional population-level statistics, which allow us to compute only a smaller number of variables or to test a limited number of hypotheses. Stroke research results have been poorly communicated to clinicians who should translate and apply such knowledge at bedside [3,7]. Meanwhile, mining algorithms have been successfully applied to discover medical knowledge from large datasets by investigating hundreds or thousands of variables simultaneously [8]. Data mining has been an established method for studying genomics, phenotypes, pharmacology, or other biomedical problems, [9-17] and have been effectively used to discover correlates of diseases such as hypertension [14], health failure [16], gastrointestinal bleeding [17], diabetes [11], metabolic syndromes [12], and occupational injuries [15]. Infographics have been used to effectively facilitate the intuitive presentation of complex mining studies [18-20].
Data mining studies rarely incorporate clinical domain experts whose decisions are critical for every step of the analysis. Further, data mining studies seldom utilize a conceptual framework to provide guidance for interpreting the results and generating hypotheses. In contrast, we incorporated a validated conceptual framework to
guide analysis and interpretation, and used clinical expert decision in every analytic step. The purpose of this paper is to present a disability outcomes association model for post-stroke patients based on data mining and an infographics method for presenting such results to clinicians.
2. METHODS
2.1 Data and Tools
The dataset was obtained in 2011 from the Behavioral Risk Factor Surveillance System (BRFSS), the world’s largest, ongoing health survey released by The Centers for Disease Control and Prevention (CDC) in the United States [21]. The BRFSS comprises de-identified publicly available data, exempt from institutional review board (IRB) approval. We identified total 19,603 patients who were previously diagnosed with stroke (patient self-report, interview in 2010) from 451,075 BRFSS respondents. Data were prepared in SAS and analyzed using Weka v3.7 [22] to build the disability association model.
2.2 Conceptual Framework
and emotional problems, such as “during the past 30 days, for how long did poor physical or mental health keep you from doing your usual activities, such as self-care, work, or recreation?”
2.3 Data Mining Process
As shown in Fig. 2, the iterative process8 of analysis consists of the following steps: problem understanding, data understanding, data preparation, model development, model evaluation.
2.3.1 Reducing dimensionality and projecting data
Stroke experts deleted manually duplicate or irrelevant variables (e.g. phone number, disaster preparedness, and dental cleaning), resulting in 156 variables from 397 initial variables. The 397 initial variables were given to each stroke experts independently to identify irrelevant variables,
followed by a consensus meeting. Next, stroke experts grouped 156 variables into the following categories based on the conceptual framework: 1) medical conditions, 2) demographic factors, 3) modifiable behavior factors; 4) social support; and 5) access to health care. Next, stroke experts further filtered variables resulting in 139 variables and applied a correlation-based algorithm CFS attribute evaluator [22], which evaluates the worth of a subset of variables by considering the individual predictive ability. For the modifiable behavior category, 11 strongly associated variables were further selected by stroke domain experts. For other sub-categories, several iterations of transformation and selection processes resulted in 12 variables for the medical condition category, 11 variables for the demographics category, 4 variables for the social support category, and 4 variables for the health care access category. Missing values (.00%-3.25%) were not replaced by computational imputation.
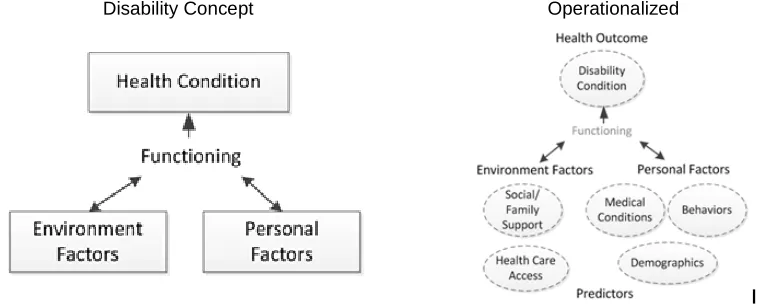
Disability Concept Operationalized
Fig. 1. WHO’s international classification of functioning, disability, and health (ICH) (Left), operationalized concepts of ICF (Right)
Yoon and Gutierrez; BJMMR, 11(5): 1-12, 2016; Article no.BJMMR.21601
2.3.2 Association modeling and validation
First, in order to examine overall association of variables, the relative importance of each variable was calculated by linear regression with M5 [24]. M5 method are chosen for this study because it is one of few advanced machine learning schemes to compute the class with continuous variables [25]. M5 splits and prunes recursively performing regression, then greedily drops terms for the cases improving the effort estimates. Not only has M5 method been proven effectively to hand both enumerated attributes and missing values, but also it has advantages of producing compact and comprehensive regression model [24-26]. The calculated relative importance was visualized using Tableau software.
Next, in order to examine detailed information regarding how the variables were related, disability association models of each category were generated. In order to avoid algorithm dependency, several different data mining algorithms suggested as top 10 data mining algorithms were applied first to build the models [27-29]. C4.5 (J48) and Adaboost (AdaboostM1), which are known as being built accurately and based on sound theories, were applied to the data set. The artificial neural network (MultilayerPerceptron) [24,25] were applied to build a association model because it is known as a powerful technique for complex disease and utilized across various scientific disciplines. Although the neural network shows the high accuracy of association, the other algorithms were applied further because the results are technically difficult to understand the hidden layer [26]. We also chose one of the most accurate Random Forest algorithms which runs efficiently on large databases [27]. The model built by C4.5 (J48) was chosen based on model accuracy and the model interpretability. Our selected algorithm, C4.5 (J48) is known as a statistical classifier which builds decision trees using the concept of information entropy. J48 finds the normalized information gain from splitting on each variable, selects the highest, and recursively creates node that splits on the best normalized information gain and add those nods as children [27,28] Unlike Adaboost, artificial neural network and Random forest, C4.5(J48) produces a visualization model in a tree form which is intuitive and relatively easy to understand and transformarable into infographics.
The association models were validated using the cross-validation function in Weka. It automatically
divided the dataset into two. The association models were generated from the first subset of data, and tested on the other subset of data. The model’s accuracy (correctly classified instances) was tested by applying a 10-fold cross validation, meaning that our dataset was randomly divided into a training set (90% of cases) and a validation set (10% of cases). We evaluated the model’s performance using proportion correctly classified and the area of under the receiver operating characteristic curve (AUC) [30].
3. RESULTS
3.1 Characteristics of the Study
Population
The characteristics of personal, environmental and the health conditions of the stroke survivors are summarized in Table 1.
The socio-demographic characteristics and the health conditions of the stroke survivors are summarized in Table 1. The mean age was 66.5 (SD=15.2) with 62% being female. The majority of respondents were White (76%) followed by Blacks (11%) and Hispanics (5%) in the U.S. Forty six percent had some college-level education or higher. Fifty one percent were retired, and 15% were employed after their first stroke. In terms of health care access, 7% answered they had no health care coverage. In fact, 14% reported that they could not see doctors due to cost. More than half said their activities were limited due to physical, mental or emotional problems. One third had comorbidities such as myocardial infarction and angina. Approximately 40% were former smokers, while nearly 20% were current smokers. Forty percent were required to use assistive device such as a wheel chair or cane. Twenty eight percent had fallen within 3 months, 44% of whom were injured from the fall.
3.2 Association Models
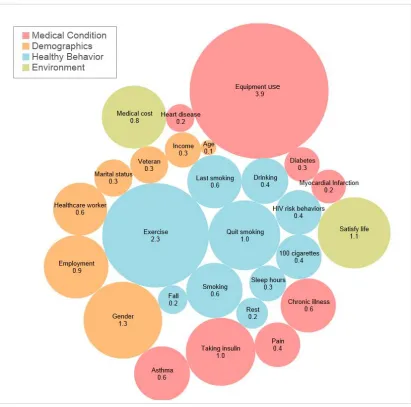
The infographic in Fig. 4 illustrates different categories of associations generated by C4.5 algorithm: 1) medical conditions, 2) demographics, 3) modifiable behaviors, 4) health care access, and 5) social and family support. The first three are personal factors and the latter two are environmental factors. Table 2 summarizes the results.
3.2.1 Personal factor-medical conditions
The medical condition category included variables related to heart attack, angina, cancer,
snoring, depression, asthma, diabetes, and insulin use. Use of assistive device (e.g., a cane or a walker) and asthma appeared as the correlates of disability among stroke survivors (model accuracy 69%, AUC 71%). As previously mentioned, the outcome variable (disability) in this study depicted the one whose usual activities such as self-care, work or recreation are affected due to mental, emotional and physical problems over 15 days per month. Those diagnosed with asthma were 1.5 times more likely to have disabilities (probability 0.57 vs 0.37, OR: 2.13, 95% CI: 1.93 to 2.35, P<0.0001).
Fig. 3. Infographics of correlates of disability among post-stroke patients (number and size representing β calculated by linear regression and M5’s methods representing relative importance using weka software, model fit: correlation coefficeint 0.47, root mean squared
Yoon and Gutierrez; BJMMR, 11(5): 1-12, 2016; Article no.BJMMR.21601
Table 1. Characteristics of stroke survivors in 2011 a national survey (N=19,458)
Characteristics Sample Characteristics Sample
Personal factors Personal factors
Demographics Modifiable behaviors
Age, years, mean 66.5 (SD=15.2) Smoking
Sex (female) 12,137 (62%) Current everyday 2,704 (14%)
Race/ ethnicity Current someday 1,041 (5%)
White 14,825 (76%) Former smoke 7,480 (39%)
Black 2,103 (11%) Never smoke 8,100 (42%)
Other 675 (3%) Fall in 3 months
Multiracial 532 (3%) Yes 5,455 (28%)
Hispanic 985 (5%) No 12,484 (64%)
Education level General Health
Never attend 42 (0%) Excellent 756 (4%)
Grades 1-8 years 1,246 (6%) Very good 2,744 (14%)
Grades 9-11 years 2,226 (12%) Good 5,499 (28%)
Grade 12 6,923 (36%) Fair 5,699 (29%)
College 1-3 years 5,071 (26%) Poor 4,637(24%)
College >= 4 years 3,919 (20%) Health not good past month
Employment Physical, days, mean 11 (SD=12.5)
Employed for wages 2,208 (11%) Mental, days, mean 6 (SD=10.2)
Self-employed 705 (4%) Both, days, mean 10 (SD=11.2)
Out of work > 1 year 543 (3%) Disability
Out of work < 1 year 306 (2%) Yes 10,827 (55%)
A homemaker 1,238 (6%) No 8,631 (44%)
A student 58 (0%) Not sure 125 (1%)
Retired 9,909 (51%) Refused 19 (0%)
Unable to work 4,382 (23%)
Marital Status Equipment use
Married 8,049 (41%) Yes 7,537 (39%)
Divorced 3,580 (18%) No 11,894 (61%)
Widowed 5,790 (30%)
Separated 536 (3%) Environmental factors
Never Married 1,249 (7%) Health care access
Medical conditions Have coverage 18,085 (93%)
Myocardial infarction 5,731 (30%) No coverage 1,318 (7%)
Coronary heart disease 4,890 (26%) Not see doctor due to cost
Asthma 3,826 (20%) Cost barrier 2,775 (14%)
Injury by fall 2,371 (44%) No cost barrier 16,605 (86%)
3.2.2 Personal factor-demographics
The analysis revealed employment status as the strongest correlates among demographic factors, compared to other socio-economic determinants such as income, education and ethnicity/race (model accuracy 61%, AUC 66%). Half of retired stroke patients (51%) are 1.17 times more likely to have disability if their income level is less than $25,000 per year (probability 0.55 vs 0.47, OR 1.29, 95% CI: 1.26 to 1.51, P <0.0001). Stroke survivors with higher education were 1.10 times more likely to have disability among the retired stroke survivors (probability 0.53 vs 0.48, OR 1.21, 95% CI: 1.12 to 1.31, P<0.0001).
3.2.3 Personal factor-modifiable behaviors
Quality of rest and exercise appeared as the stronger indicators of disability among stroke
Yoon and Gutierrez; BJMMR, 11(5): 1-12, 2016; Article no.BJMMR.21601
smoking, last time smoked, frequency of using chewing tobacco, snuff, or snus. Whether the total number of cigarettes smoked in an entire life was less than 100 cigarettes (5 packs) was a stronger indicator than frequency or period of smoking cessation. Stroke survivors who smoked 100 cigarettes in their entire life were more likely to have disabilities regardless of being a former smoker or a daily smoker.
3.2.4 Environmental factor-health care access
Stroke survivors who could not see a doctor when needed due to cost during the past 12 months, were more likely to have disabilities. Among those without cost barriers who had a primary health provider, stroke survivors with no health insurance were less likely to have disabilities (model accuracy 56%, AUC 56%).
3.2.5 Environmental factor-social or family support
Compared to the fact that the number of adult women in a family did not influence the outcome, the number of men in a family (> 3 men in a family) was associated with the positive stroke outcome (model accuracy 56%, AUC 51%). The infographics showed that disability was increased when frequency of social support is decreased.
4. DISCUSSION
A data mining approach was used to discover the degree of association over hundreds of risk factors related to disability for stroke population from a national dataset. Our novel mining approach executed by clinical domain experts and using a conceptual framework to organize the data mining process adds new knowledge of the relative importance and relationship of 70 variables associated with disability to the field. This can help establishing the priorities to focus on for clinicians and stroke researchers. This study introduced relatively unknown factors of stroke disability such as employment, quality of rest, and asthma status as a new knowledge. In addition, this study complements the known risk factors of stroke disability (e.g., exercise, sleep, diabetes, smoking, heart disease and age) with the models explaining the relationship of the variables. Moreover, this study provides additional information of contradictory correlates such as race and ethnicity. This will be further discussed below.
Data mining process executed by stroke domain experts efficiently generated clinically suitable association models for disability from hundreds
of variables, which possibly contain thousands of theoretical combinations of conditions. Modern data mining in its nature requires clinical domain expertise in each step, from in-depth problem understanding to results interpretation, in order to find clinically meaningful and applicable new knowledge. For this quest, this study offers insights for clinicians about how to apply emerging modern techniques using free-software and publically available data for other health conditions. Next we discuss three interesting findings of risk factors of disability.
First, in demographics, employment status was identified as a primary factor associated with disability. Despite to the benefits such as empowerment, sense of self-control and happiness, only half of stroke patients are usually able to go back to work [31,32]. In this study, stroke patients answering employed (15%) were more likely not to have disability. Our finding may consider for multidisciplinary stroke care teams paying attention for the patients’ employment status, [33] considering the fact that the more younger people are attacked by stroke [31]. Further, Hispanics were less likely to have disabilities than others among unemployed stroke survivors. Mixed results have been reported regarding racial disparities and stroke outcomes [34-36]. Our study provides evidence that Hispanics have a better outcome than others among the unemployed stroke population.
Second, in medical conditions, asthma showed as strong correlates of disability. Asthma status was the strong predictor regardless of status of heart disease or diabetes. Even if individuals with heart diseases such as coronary artery disease or myocardial infarction, stroke patients without asthma were less likely to have disability. Although association between asthma and cardiovascular diseases has been reported in several studies, the association between asthma and stroke has been rarely reported [37]. In terms of diabetes and stroke, contradictory results have been shown in previous studies [38]. Our study finding further explains that asthma was a stronger predictor than diabetes. The association with asthma and stroke were relatively unknown; this may be a new avenue to explore.
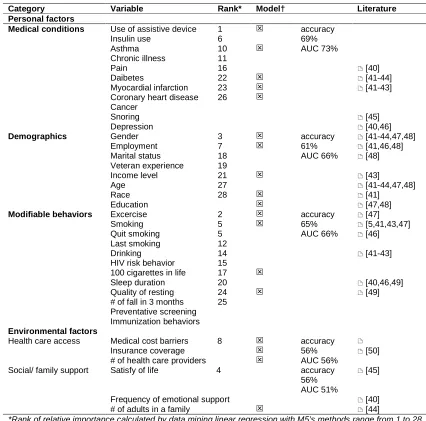
Table 2. Variables associated with disability among stroke survivors
Category Variable Rank* Model† Literature
Personal factors
Medical conditions Use of assistive device 1 accuracy
69% AUC 73%
Insulin use 6
Asthma 10
Chronic illness 11
Pain 16 [40]
Daibetes 22 [41-44]
Myocardial infarction 23 [41-43]
Coronary heart disease 26
Cancer
Snoring [45]
Depression [40,46]
Demographics Gender 3 accuracy
61% AUC 66%
[41-44,47,48]
Employment 7 [41,46,48]
Marital status 18 [48]
Veteran experience 19
Income level 21 [43]
Age 27 [41-44,47,48]
Race 28 [41]
Education [47,48]
Modifiable behaviors Excercise 2 accuracy
65% AUC 66%
[47]
Smoking 5 [5,41,43,47]
Quit smoking 5 [46]
Last smoking 12
Drinking 14 [41-43]
HIV risk behavior 15
100 cigarettes in life 17
Sleep duration 20 [40,46,49]
Quality of resting 24 [49]
# of fall in 3 months 25
Preventative screening Immunization behaviors Environmental factors
Health care access Medical cost barriers 8 accuracy
56% AUC 56%
Insurance coverage [50]
# of health care providers
Social/ family support Satisfy of life 4 accuracy
56% AUC 51%
[45]
Frequency of emotional support [40]
# of adults in a family [44]
*Rank of relative importance calculated by data mining linear regression with M5’s methods range from 1 to 28. Blank means the variable were not seleced by M5 algorithm.
†Variables included in the association model for stroke disability detected by C4.5 algorithm. The association models are presented in Fig. 3
Our study finding regarding quality of rest and exercise as the main correlates among over a hundred behaviors is one of our unique contributions to stroke self-management programs. In particular ‘8-day threshold increased to 13 days for the one who regularly exercises’ may feed the body of knowledge of such programs. In terms of smoking, stroke survivors who smoked 100 cigarettes in their entire life were more likely to have a disability regardless of being a former smoker or an every day smoker. This contains clinical implication that
accurate assessment of the amount of smoking in the practice may be needed.
Yoon and Gutierrez; BJMMR, 11(5): 1-12, 2016; Article no.BJMMR.21601
patients with greater stroke severity. Further, subtypes of stroke were not taken into account in this study because of unavailability of the variable. In addition, only a few common data mining association methods such as C4.5, Adaboost, Neuroal network and RandomForest) were applied. Further studies applying different machine learning algorithms (e.g. ensemble methods) with longitudinal dataset will strengthen the results.
5. CONCLUSION
Association data mining may not only offer implications for clinicians but also help generate new hypotheses regarding stroke outcomes. Simple infographics may enhance and comprehensibility of the study results for clinicians, and have potential for patient education.
6. FUNDING
The study was supported by T32NR007969. Manuscript preparation was also supported by R01 HS019853.
CONSENT
It is not applicable.
ETHICAL APPROVAL
It is not applicable. This study used de-identified publically available BRFSS (http://www.cdc.gov/brfss/) which is considered to not qualify as “research” with “human subjects” per applicable federal regulation.
ACKNOWLEDGEMENTS
The authors would like to thank Maria Patrao, BSN, RN, Deborah Schauer, BSN, RN, Joneb Alday, MS, RN, and Millie Hepburn, MSN, RN from Stroke Care Unit at Columbia University Medical Center, Suzanne Bakken, Chunhua Weng and Riccardo Miotto, PhD from the department of biomedical informatics, and Claire Wang Mailman School of Public health at Columbia University for their expertise.
COMPETING INTERESTS
Authors have declared that no competing interests exist.
REFERENCES
1. Cadilhac DA, Hoffmann S, Kilkenny M, Lindley R, Lalor E, Osborne RH, et al. A phase ii multicentered, single-blind, randomized, controlled trial of the stroke self-management program. Stroke. 2011; 42:1673-1679.
2. Chen SY, Winstein CJ. A systematic review of voluntary arm recovery in hemiparetic stroke: Critical predictors for meaningful outcomes using the international classification of functioning, disability, and health. J Neurol Phys Ther. 2009;33:2-13.
3. Halfon N. Addressing health inequalities in the us: A life course health development approach. Soc Sci Med. 2012;74:671-673. 4. Desrosiers J, Noreau L, Rochette A,
Bourbonnais D, Bravo G, Bourget A. Predictors of long-term participation after stroke. Disabil Rehabil. 2006;28:221-230. 5. Alberti A, Agnelli G, Caso V, Venti M,
Acciarresi M, D'Amore C, et al. Non-neurological complications of acute stroke: Frequency and influence on clinical outcome. Intern Emerg Med. 2011; 6(Suppl 1):119-123.
6. Chau JP, Thompson DR, Twinn S, Chang AM, Woo J. Determinants of participation restriction among community dwelling stroke survivors: A path analysis. BMC Neurol. 2009;9:49.
7. Luscher TF. The bumpy road to evidence: Why many research findings are lost in translation. European Heart Journal; 2013. 8. Tan P, Steinbach M, Kumar V. Introduction
to data mining: Addison wesley; 2006. 9. Panzarasa S, Quaglini S, Sacchi L,
Cavallini A, Micieli G, Stefanelli M. Data mining techniques for analyzing stroke care processes. Studies in health technology and informatics. 2010;160:939-943.
11. Kim HS, Shin AM, Kim MK, Kim YN. Comorbidity study on type 2 diabetes mellitus using data mining. The Korean journal of internal medicine. 2012;27:197-202.
12. Huang YC. The application of data mining to explore association rules between metabolic syndrome and lifestyles. The HIM Journal. 2013;42:29-36.
13. Guiza F, Van Eyck J, Meyfroidt G. Predictive data mining on monitoring data from the intensive care unit. Journal of Clinical Monitoring and Computing. 2013;27:449-453.
14. Egan BM. Prediction of incident hypertension. Health implications of data mining in the 'big data' era. Journal of Hypertension. 2013;31:2123-2124.
15. Cheng CW, Leu SS, Cheng YM, Wu TC, Lin CC. Applying data mining techniques to explore factors contributing to occupational injuries in taiwan's construction industry. Accident; Analysis and Prevention. 2012;48:214-222.
16. Austin PC, Tu JV, Ho JE, Levy D, Lee DS. Using methods from the data-mining and machine-learning literature for disease classification and prediction: A case study examining classification of heart failure subtypes. Journal of Clinical Epidemiology. 2013;66:398-407.
17. Abd Elrazek AE, Mahfouz HM, Metwally AM, El-Shamy AM. Mortality prediction of nonalcoholic patients presenting with upper gastrointestinal bleeding using data mining. European Journal of Gastroenterology & Hepatology; 2013. 18. Myatt GJ, Hohnson WP. Making sense of
data iii: A practical guide to designing interactive data visualizations. Wiley; 2011. 19. Tufte ER. Beatiful evidence. Cheshire, Connecticut, USA,: Graphics Press; 2006. 20. Ware C. Information visualization:
Perception for design 3rd (ed.). Morgan Kaufmann; 2004.
21. (CDC). CfDCaP. Behavioral risk factor surveillance system survey data; 2011. 22. Hall M, Frank E, Holmes G, Pfahringer B,
Reutemann P, IH W. The weka data mining software: An update; sigkdd explorations; 2009.
23. World Health Organization (WHO). International classification of functioning, disability and health (icf); 2001.
24. Quinlan JR. Learning with continuous classes. 5th Australian Joint Conference
on Artificial Intelligence, Singapore. 1992;343-348.
25. Zhang D, Tsai J. Advances in machine learning applications in software engineering-a two stage zone regression method for global characterization of a project database; 2007.
26. Wang YIW. Induction of model trees for predicting continuous classes. 9th
European Conference on Machine Learning; 1997.
27. Karimi K, Hamilton HJ. Timesleuth: A tool for discovering causal and temporal rules. ICTAI; 2002.
28. Quinlan JR. C4.5: Programs for machine learning; 1993.
29. Wu XD, Kumar V, Quinlan JR, Ghosh J, Yang Q, Motoda H, et al. Top 10 algorithms in data mining. Knowl Inf Syst. 2008;14:1-37.
30. Li HY, Hu YA. Comments and modifications on: "Adaptive cmac neural control of chaotic systems with a pi-type learning algorithm" [expert systems with applications 36 (2009) 11836-11843]. Expert Syst Appl. 2012;39:3886-3887. 31. Jones F, Riazi A. Self-efficacy and
self-management after stroke: A systematic review. Disabil Rehabil. 2011;33:797-810. 32. Varona JF. Long-term prognosis of
ischemic stroke in young adults. Stroke Res Treat. 2010;2011:879817.
33. Albert SJ, Kesselring J. Neurorehabilitation of stroke. J Neurol; 2011.
34. Cushman M, Cantrell RA, McClure LA, Howard G, Prineas RJ, Moy CS, et al. Estimated 10-year stroke risk by region and race in the united states: Geographic and racial differences in stroke risk. Ann Neurol. 2008;64:507-513.
35. Rabadi MH, Rabadi FM, Hallford G, Aston CE. Does race influence functional outcomes in patients with acute stroke undergoing inpatient rehabilitation? Am J Phys Med Rehabil; 2012.
36. Roth DL, Haley WE, Clay OJ, Perkins M, Grant JS, Rhodes JD, et al. Race and gender differences in 1-year outcomes for community-dwelling stroke survivors with family caregivers. Stroke. 2011;42:626-631.
Yoon and Gutierrez; BJMMR, 11(5): 1-12, 2016; Article no.BJMMR.21601
38. Winell K, Paakkonen R, Pietila A, Reunanen A, Niemi M, Salomaa V. Prognosis of ischaemic stroke is improving similarly in patients with type 2 diabetes as in nondiabetic patients in finland. Int J Stroke. 2011;6:295-301.
39. Jones F. Strategies to enhance chronic disease self-management: How can we apply this to stroke? Disabil Rehabil. 2006;28:841-847.
40. Teasdale TW, Engberg AW. Psychosocial consequences of stroke: A long-term population-based follow-up. Brain injury: [BI]. 2005;19:1049-1058.
41. Bhalla A, Wang Y, Rudd A, Wolfe CD. Differences in outcome and predictors between ischemic and intracerebral hemorrhage: The south london stroke register. Stroke. 2013;44:2174-2181. 42. Engstad T, Viitanen M, Arnesen E.
Predictors of death among long-term stroke survivors. Stroke. 2003;34:2876-2880.
43. Paul SL, Sturm JW, Dewey HM, Donnan GA, Macdonell RA, Thrift AG. Long-term outcome in the north east melbourne stroke incidence study: Predictors of quality of life at 5 years after stroke. Stroke. 2005;36:2082-2086.
44. Ronning OM, Stavem K. Predictors of mortality following acute stroke: A cohort study with 12 years of follow-up. Journal of stroke and cerebrovascular diseases: The official journal of National Stroke Association. 2012;21:369-372.
45. von Sarnowski B, Kleist-Welch Guerra W, Kohlmann T, Moock J, Khaw AV, Kessler C, et al. Long-term health-related quality of life after decompressive hemicraniectomy in stroke patients with life-threatening
space-occupying brain edema. Clinical Neurology and Neurosurgery. 2012;114: 627-633.
46. Waje-Andreassen U, Thomassen L, Jusufovic M, Power KN, Eide GE, Vedeler CA, et al. Ischaemic stroke at a young age is a serious event--final results of a population-based long-term follow-up in western norway. European Journal of Neurology: The Official Journal of the European Federation of Neurological Societies. 2013;20:818-823.
47. Krarup LH, Truelsen T, Gluud C, Andersen G, Zeng X, Korv J, et al. Prestroke physical activity is associated with severity and long-term outcome from first-ever stroke. Neurology. 2008;71:1313-1318.
48. Ojala-Oksala J, Jokinen H, Kopsi V, Lehtonen K, Luukkonen L, Paukkunen A, et al. Educational history is an independent predictor of cognitive deficits and long-term survival in postacute patients with mild to moderate ischemic stroke. Stroke. 2012; 43:2931-2935.
49. Cereda CW, Petrini L, Azzola A, Ciccone A, Fischer U, Gallino A, et al. Sleep-disordered breathing in acute ischemic stroke and transient ischemic attack: Effects on short- and long-term outcome and efficacy of treatment with continuous positive airways pressure--rationale and design of the sas care study. Int J Stroke. 2012;7:597-603
50. Gezmu T, Gizzi MS, Kirmani JF, Schneider D, Moussavi M. Disparities in acute stroke severity, outcomes, and care relative to health insurance status. Journal of Stroke and Cerebrovascular Diseases: The Official Journal of National Stroke Association; 2013.
© 2016 Yoon and Gutierrez; This is an Open Access article distributed under the terms of the Creative Commons Attribution License (http://creativecommons.org/licenses/by/4.0), which permits unrestricted use, distribution, and reproduction in any medium, provided the original work is properly cited.
Peer-review history: