Impact of gestational risk factors on maternal cardiovascular system
María Perales
1,2, Alejandro Santos-Lozano
1,3, Fabian Sanchis-Gomar
1, María Luaces
4, Helios
Pareja-Galeano
1,5, Nuria Garatachea
1,6, Rubén Barakat
7*, Alejandro Lucia
1,5*
1Research Institute, Hospital 12 de Octubre (‘i+12’), Madrid, Spain; 2Camilo Jose Cela University, Madrid, Spain; 3GIDFYS, Department of Health
Sciences, European University Miguel de Cervantes, Valladolid, Spain; 4Hospital Clínico San Carlos, Madrid, Spain; 5European University, Madrid,
Spain; 6Facultad de Ciencias de la Salud y del Deporte, GENUD (Growth, Exercise, Nutrition and Development) Research Group, Instituto
Agroalimentario de Aragón -IA2- (Universidad de Zaragoza-CITA), Zaragoza, Spain; 7AFIPE Research Group, Technical University of Madrid,
Madrid, Spain
Contributions: (I) Conception and design: M Perales, F Sanchis-Gomar, A Lucia, N Garatachea, R Barakat; (II) Administrative support: N Garatachea, H Pareja-Galeano; (III) Provision of study materials or patients: M Luaces, H Pareja-Galeano; (IV) Collection and assembly of data: M Luaces, R Barakat; (V) Data analysis and interpretation: M Perales, A Santos-Lozano, A Lucia, F Sanchis-Gomar; (VI) Manuscript writing: All authors; (VII) Final approval of manuscript: All authors.
*These authors contributed equally for the senior authorship.
Correspondence to: Fabian Sanchis-Gomar, MD, PhD. Research Institute of Hospital 12 de Octubre (‘i+12’), 6th Floor, Laboratories Sector, CAA Building, Avda. de Córdoba s/n, 28041 Madrid, España. Email: fabian.sanchis@uv.es.
Background: Scarce evidence is available on the potential cardiovascular abnormalities associated with some common gestational complications. We aimed to analyze the potential maternal cardiac alterations related to gestational complications, including body mass index (BMI) >25 kg/m2, gaining excessive weight, or developing
antenatal depression.
Methods: The design of this study was a secondary analysis of a randomized controlled trial. Echocardiography was performed to assess cardiovascular indicators of maternal hemodynamic, cardiac remodeling and left ventricular (LV) function in 59 sedentary pregnant women at 20 and 34 weeks of gestation.
Results: Starting pregnancy with a BMI >25 kg/m2, gaining excessive weight, and developing antenatal depression
had no cardiovascular impact on maternal health (P value >0.002). Depressed women were more likely to exceed weight gain recommendations than non-depressed women (P value <0.002).
Conclusions: The evaluated gestational complications seem not to induce cardiovascular alterations in hemodynamic, remodeling and LV function indicators. However, developing antenatal depression increases the risk of an excessive weight gain. This finding is potentially important because excessive weight gain during pregnancy associates with a higher risk of cardiovascular diseases (CVD) later in life.
Keywords: Pregnancy; weight; depression; cardiovascular disease (CVD); echocardiography
Submitted May 04, 2016. Accepted for publication May 15, 2016. doi: 10.21037/atm.2016.06.18
View this article at: http://dx.doi.org/10.21037/atm.2016.06.18
Introduction
The maternal cardiovascular system undergoes profound changes to support the increasing demands of fetal growth and development during pregnancy (1). Some studies showed that some maternal obstetric complications can lead to abnormal changes that may ultimately increase the maternal and fetal risk of cardiovascular disease (CVD) (2-6). Along
disease in GDM patients is approximately 70% higher than in patients without GDM (7).
It is estimated that an increasing number of women develop CVD during pregnancy, raising the risk to 0.2–4% of all pregnancies in western countries (8,9), largely due to the increasing presence of maternal cardiovascular risk factors (10). In the general population, a high body mass index (BMI) is linked to heart failure, including abnormal LV function and structure (11,12). Although weight gain is expected during pregnancy, mothers who start their pregnancy being overweight or even obese have an increased risk of many maternal and fetal complications such as excessive weight gain, which can lead to other long-term maternal health consequences including CVD (13), or antenatal depression, which enhances the risk of pre-eclampsia (14).
Despite these concerns, the adverse effects of these common complications on the maternal cardiovascular system remain uncertain. Thus, the knowledge of the risks associated with CVD during pregnancy and their management is important for advising women before and during pregnancy. The main objective of this study was to assess the potential maternal cardiac alterations associated with starting pregnancy with a BMI >25 kg/m2, gaining excessive weight, and developing antenatal depression, based on echocardiographic indicators of maternal hemodynamics, cardiac remodeling and LV function. We hence hypothesized that these complications may alter the maternal cardiovascular system during pregnancy.
Methods
Study characteristics
The present study was a secondary analysis of a randomized controlled trial (clinicaltrials.gov identifier NCT01723098) performed from February 2009 to March 2013 (15). Informed consent was obtained from all enrolled participants. The study was approved by the Research Ethics Committee of the Hospital Universitario de Fuenlabrada (Madrid, Spain; approval number 240/09) and was in accordance with the ethical guidelines of the Declaration of Helsinki (modified in 2008).
Only those healthy pregnant women (n=121) who were randomly allocated to the standard care program group in the aforementioned trial were included in the present study. They met the following inclusion criteria: (I) having no obstetric or medical complications (based on the American college of obstetricians and gynecologists guidelines
(ACOG) (16); (II) time of pregnancy <16 weeks; (III) not exercising regularly for more than 30 min (3 d·week−1); (IV)
able to communicate in Spanish; (V) followed throughout pregnancy and giving birth at the Hospital Universitario de Fuenlabrada. Participants received regular general counseling regarding healthy habits (nutritional and physical activity) by their obstetricians and midwives.
Data collection
Personal data were obtained from participants during their first prenatal visit (9–11 weeks of gestation) through a structured questionnaire at the beginning of the study and before group allocation. Pregnancy outcomes were also collected and obtained from the medical records at delivery. Maternal pre-pregnancy BMI, maternal gestational weight gain and the diagnoses of GDM were collected from medical records. Pregnant women were divided into two groups, depending on whether they were at risk or not for each obstetric complication:
(I) Pre-pregnancy maternal BMI (risk = BMI ≥25 kg/m2; non-risk BMI <25 kg/m2);
(II) Maternal gestational weight gain classified as “excessive-risk” or “adequate non-“excessive-risk” based on the Institute of Medicine (IOM) guidelines (13): “underweight” women (pre-gestational BMI ≤18.5 kg/m2) weight gain: risk 18 kg; non-risk ≤18 kg; “normal weight” (pre-gestational BMI 18.5−24.9 kg/m2) weight gain: risk >16 kg; non-risk ≤16 kg; “overweight” women (pre-gestational BMI 25–29 kg/m2) weight gain: risk >11.5 kg; non-risk ≤11.5 kg; and “obese” women (pre-gestational BMI ≥30 kg/m2) weight gain: risk >9 kg; non-risk ≤9 kg;
(III) Antenatal depression was assessed by the center for epidemiological studies depression (CESD) scale: risk (depressed women) = CESD score ≥16; non-risk (non-depressed women) = CESD score <16.
Primary outcomes
previous study (15) and outlined below:
(I) Hemodynamic variables: systolic and diastolic blood pressure (SBP/DBP), heart rate (HR), stroke volume (SV), cardiac output (CO), and total vascular resistance (TVR);
(II) Cardiac remodeling variables: LA area and volume, LV diastolic diameter (LVDD), LV systolic diameter (LVSD), interventricular septal thickness (IVST), posterior wall thickness (PWT), posterior wall thickness at systole (PWTs), relative wall thickness (RWT), LV mass (LVM), LV mass index (LVMI), wall stress (cESS); LV geometry pattern: normal pattern, concentric remodeling, eccentric remodeling, and concentric hypertrophy;
(III) LV function variables: LV ejection fraction (LVEF), fractional shortening (FS), early filling velocity (E), atrial filling velocity (A), deceleration time of E wave (DT), and isovolumetric relaxation time (IVRT).
Secondary outcomes
Secondary outcomes included duration (dilation, delivery and childbirth time) and type (normal, instrumental, cesarean) of labor, occurrence of pre-term delivery (≤259 days), newborns’ gestational age, weight, height and head circumference at birth, Apgar score at 1 and 5 min, and pH of the umbilical cord.
Statistical analysis
Statistical analyses were performed with the Stata Statistical Software Package (version 13, Stata Corp, College Station, TX) and IBM SPSS 22 package (SPSS, Inc., Chicago, IL) for Mac. The intention-to-treat principle was used
considering baseline values as posttest values when posttest data were missing.
A two-factor ANOVA repeated measures analysis [group (non-obstetric complication, obstetric complication group) by time (at 20 and 34 weeks)] was used to assess the effect of obstetric complications on study outcomes (or its equivalent non-parametric test in the case of non-parametrical distribution). Moreover, differences between the frequencies of women by obstetric complication group (pre-pregnancy maternal BMI, weight gain or antenatal depression) in each categorical variable at 20 and 34 weeks were assessed by the Chi-square test (χ2) (or Fisher’s test if all expected cell frequencies are not equal to or greater than 5). Unpaired Student’s t-test (or its equivalent non-parametric test) was used to compare the pregnancy outcome net change (post– pre outcome values) by each obstetric complication group.
Finally, univariate Kaplan-Meier analysis of dilation, delivery and childbirth duration, respectively, by obstetric complication group was calculated. The log rank test was used to compare the curves. Data are shown as mean ± standard deviation (SD) or n/percentage, where appropriate. To minimize the risk of statistical error type I, all the analyses were corrected for multiple comparisons using the stringent Bonferroni method, in which the threshold P value is obtained by dividing 0.05 by the number of comparisons [threshold P value set at ≤0.002 (i.e., 0.05 divided by the number of outcomes in these analyses (n=27)].
Results
Maternal characteristics at the beginning of the study are presented in Table 1. A total of 59 participants completed the study, including primary and/or secondary outcomes.
Primary outcomes
Analyses based on pre-gestational BMI
The results of repeated measures two-factor ANOVA revealed a significant time effect from 20 to 34 weeks of gestation (P<0.002) for several primary outcomes related to changes in maternal hemodynamics (decrease in SV), cardiac remodeling (increase in LVM), and LV function (decrease in early filling velocity and E/A ratio) (Table 2). Twenty-six women (77%) with BMI <25 kg/m2 presented a normal cardiac pattern, 4 (12%) presented concentric remodeling, and 2 (6%) presented eccentric hypertrophy. Similarly, 20 (59%) women with BMI ≥25 kg/m2 presented a normal cardiac pattern, 7 (21%) presented concentric Table 1 Maternal characteristics at the beginning of the study
Variables Pregnant women (n=59)
Age (years) 31±4
Previous pregnancies (%)
0 60
1 37
≥2 7
Table 2 Outcomes variables by group (pre-gestational BMI <25 kg·m-2 vs. ≥25 kg·m-2) at second (20 weeks) and third (34 weeks) trimesters
Outcomes Group (kg·m−2) N 20 weeks of
gestation
34 weeks of gestation
P value (group)
P value (time)
P value (interaction) Hemodynamic
SBP (mmHg) BMI <25 25 106±8 109±15 0.014 0.493 0.359
BMI ≥25 19 114±10 113±9 — — —
DBP (mmHg) BMI <25 24 61±7 64±12 0.025 0.424 0.612
BMI ≥25 19 67±8 68±9 — — —
HR (beats·min−1) BMI <25 29 79±9 80±11 0.156 0.028 0.201
BMI ≥25 23 81±12 86±13 — — —
SV (mL·beat−1) BMI <25 31 56±13 54±12 0.885 0.001* 0.355
BMI ≥25 23 57±12 53±12 — — —
CO (mL·min-1) BMI <25 30 4,442±1,064 4,243±984 0.544 0.128 0.565
BMI ≥25 23 4,554±1,066 4,463±1,047 — — — CO index (mL·min−1·m−2) BMI <25 28 2,674±610 2,490±574 0.309 0.011 0.714
BMI ≥25 21 2,485±562 2,347±637 — —
TVR (dynes·s·cm−5) BMI <25 28 1,467±377 1,577±491 0.724 0.171 0.457
BMI ≥25 23 1,542±364 1,576±386 — — — Cardiac remodeling
LA area (mm) BMI <25 34 18±3 17±3 0.789 0.111 0.583
BMI ≥25 25 18±3 17±3 — — —
LA volume (mm3) BMI <25 34 50±11 49±13 0.667 0.071 0.215
BMI ≥25 25 51±17 46±11 — — —
LVDD (mm) BMI <25 34 45±15 45±1 0.041 0.265 0.110
BMI ≥25 24 47±1 48±1 — — —
LVSD (mm) BMI <25 34 27±3 27±4 0.039 0.330 0.831
BMI ≥25 24 28±3 29±3 — — —
IVST (mm) BMI <25 34 8±1 9±2 0.797 0.019 0.597
BMI ≥25 25 8±2 9±1 — — —
PWT (mm) BMI <25 34 8±2 9±2 0.918 0.021 0.276
BMI ≥25 25 8±2 9±2 — — —
PWTs (mm) BMI <25 33 14±3 15±3 0.864 0.148 0.451
BMI ≥25 25 15±2 15±2 — — —
RWT (mm) BMI <25 34 4±1 4±1 0.276 0.125 0.074
BMI ≥25 24 4±1 4±1 — — —
LVM (g) BMI <25 34 115±26 127±38 0.133 0.001* 0.740
BMI ≥25 24 129±38 139±33 — — —
LVMI (g·m−2) BMI <25 32 68±17 74±22 0.699 0.004 0.880
BMI ≥25 22 67±15 72±13 — — —
cESS (kdynes·cm−2) BMI <25 30 98±27 98±29 0.134 0.698 0.784
BMI ≥25 22 109±24 106±25 — — —
LV function
LVEF (%) BMI <25 32 71±5 70±7 0.798 0.878 0.169
BMI ≥25 23 70±7 70±6 — — —
FS (%) BMI <25 34 41±4 40±6 0.542 0.894 0.241
BMI ≥25 24 39±6 40±4 — — —
Table 2 (continued)
Outcomes Group (kg·m−2) N 20 weeks of
gestation
34 weeks of gestation
P value (group)
P value (time)
P value (interaction) E (m·s−1) BMI <25 32 96±18 89±19 0.011 0.001* 0.657
BMI ≥25 23 86±18 77±13 — — —
A (m·s−1) BMI <25 32 54±11 60±15 0.108 0.046 0.217
BMI ≥25 23 61±15 63±12 — — —
E/A BMI <25 32 1.8±0.5 1.5±0.4 0.002 <0.001* 0.264 BMI ≥25 23 1.4±0.4 1.2±0.3 — — — DT (ms) BMI <25 32 148±37 146±37 0.029 0.083 0.144
BMI ≥25 22 134±41 118±40 — — —
IVRT (ms) BMI <25 30 75±12 79±17 0.296 0.105 0.801
BMI ≥25 17 70±18 75±20 — — —
Threshold P value set at 0.002 [i.e., 0.05 divided by the number of outcomes in these analyses (n=27)]. *, P<0.002. A, atrial filling velocity; cESS, wall stress; CO, cardiac output; CO, index, cardiac output index; DBP, diastolic blood pressure; DT, deceleration time of E wave; E, early filling velocity; FS, fractional shortening; HR, heart rate; IVRT, isovolumetric relaxation time; IVST, interventricular septal thickness; LA, left atrial; LV, left ventricular; LVDD, LV diastolic diameter; LVEF, LV ejection fraction; LVM, LV mass; LVMI, LV mass index; LVSD, LV systolic diameter; PWT, posterior wall thickness; PWTs, posterior wall thickness at systole; RWT, relative wall thickness; SBP, systolic blood pressure; SV, stroke volume; TVR, total vascular resistance.
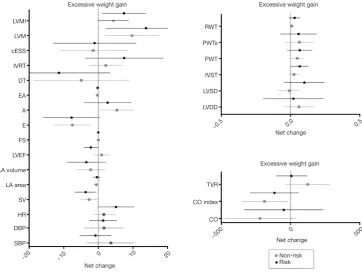
remodeling, 1 (3%) presented concentric hypertrophy, and 4 (12%) presented eccentric hypertrophy remodeling (P=0.43). No significant differences were found in any of the remaining pregnancy outcomes’ net change by group (Figure 1).
Analyses based on gestational weight gain
Analyses based on maternal gestational weight gain showed a significant time effect from 20 to 34 weeks of gestation, related to changes in hemodynamics (decrease in SV), cardiac remodeling (increase in LVM), and LV function (decrease in early filling velocity and E/A ratio) (P<0.002) (Table 3). No effects were found in group-time interaction for hemodynamics and cardiac remodeling [women in risk (71% normal pattern, 6% concentric remodeling, 3% concentric hypertrophy and 11% eccentric hypertrophy) vs. women in non-risk (74% normal pattern, 9% concentric remodeling and 9% eccentric hypertrophy), P=0.89] or LV function (Table 3, all P≥0.002). No significant differences were found in any of the remaining pregnancy outcomes’ net change by group (Figure 2).
Analyses based on antenatal depression (first trimester) Results from depressed pregnant women in the first trimester of pregnancy showed a significant time effect in LV function (decrease in E/A ratio; P=0.002). No differences were found in hemodynamic or cardiac remodeling variables [women in risk (60% normal pattern, 11% concentric remodeling, 2%
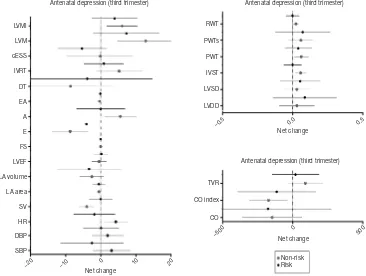
concentric hypertrophy and 11% eccentric hypertrophy) versus women in non-risk (80% normal pattern, 7% concentric remodeling and 7% eccentric hypertrophy), P=0.67] (Table 4), or in any of the remaining pregnancy outcomes’ net change by group (Figure 3).
Analyses based on antenatal depression (third trimester) Significant time effects were found in cardiac remodeling and LV function between depressed and non-depressed women at the third trimester of pregnancy, presenting as an increase in LVM and a decrease in E/A ratio, respectively (P≤0.001) (Table 5). Thirty-one non-risk women (72%) presented a normal cardiac pattern, 5 (12%) a concentric remodeling and 3 (7%) an eccentric hypertrophy. Similarly, 28 (65%) at risk women presented a normal cardiac pattern, 5 (12%) a concentric remodeling, 1 (2%) a concentric hypertrophy and 5 (12%) an eccentric hypertrophy remodeling (P=0.82). Moreover, depressed pregnant women were more likely to exceed weight gain recommendations than non-depressed women (P<0.002). Finally, no significant differences were found in any of the remaining pregnancy outcomes’ net change by group (Figure 4).
Secondary outcomes
(Tables 2-5, Figures 1-4). Also, the delivery duration curves were similar as revealed by log rank test between all groups of risk and non-risk women [P>0.05; BMI risk women [median (range) of dilation phase duration 510 min (range, 120–1,200 min); expulsion phase duration 136 min (range, 5–209 min); childbirth phase duration 6 min (range, 3–30 min)] vs. BMI non-risk women [dilation 360 min (range, 30–1,260 min); expulsion 83 min (range, 8–226 min); childbirth time 5 min (range, 3–15 min)]; excessive weight gain non-risk women [dilation 480 min (range, 120–1,260 min); expulsion 129 min (range, 5–209 min); dilation 5 min (range, 3–30 min)] vs. excessive weight gain risk women [dilation 345 min (range, 30–1,080 min); expulsion 101 min (range, 8–226 min); childbirth 5 min (range, 3–15 min)]; antenatal depression (first trimester) non-risk women [dilation 435 min (range, 30–1,260 min); expulsion 87 min (range, 5–226 min); childbirth 5 min (range, 3–30 min)] vs. antenatal depression (first trimester) risk women [dilation 540 min (range,
120–1,080 min); expulsion 133 min (range, 11–198 min); childbirth 5 min (range, 3–10 min)]; antenatal depression (third trimester) risk women [dilation 480 min (range, 30–1,260 min); expulsion 136 min (range, 8–226 min); childbirth 5 min (range, 3–30 min)] vs. antenatal depression (third trimester) non-risk women [dilation 300 min (range, 180–1,080 min); expulsion 49 min (range, 5–205 min); childbirth 5 min (range, 5–10 min)].
Discussion
Contrary to our original hypothesis, we found that excessive weight gain, developing antenatal depression or starting pregnancy with a BMI >25 kg/m2 has no impact on echocardiographic indicators of maternal hemodynamics, cardiac remodeling or LV function during the period of pregnancy assessed. Similar and significant cardiovascular changes were found between pregnant women with and Figure 1 Cardiovascular indicators based on pre-gestational BMI. Risk = BMI ≥25 kg/m2; non-risk BMI <25 kg/m2. A, atrial filling
velocity; BMI, body mass index; cESS, wall stress; CO, cardiac output; CO index, cardiac output index; DBP, diastolic blood pressure; DT, deceleration time of E wave; E, early filling velocity; FS, fractional shortening; HR, heart rate; IVRT: isovolumetric relaxation time; IVST, interventricular septal thickness; LA, left atrial; LVDD, LV diastolic diameter; LVEF, LV ejection fraction; LVM, LV mass; LVMI, LV mass index; LVSD, LV systolic diameter; PWT, posterior wall thickness; PWTs, posterior wall thickness at systole; RWT, relative wall thickness; SBP, systolic blood pressure; SV, stroke volume; TVR, total vascular resistance.
LVMI
LVM
cESS
IVRT
DT
EA
A
E
FS
LVEF
LA volume
LA area
SV
HR
DBP
SBP
RWT
PWTs
PWT
IVST
LVSD
LVDD
TVR
CO index
CO
BMI BMI
BMI Net change
Net change
Net change
−20 −10
−0.5
−500 0 500
0.0 0.5
10 20
0 Non-risk
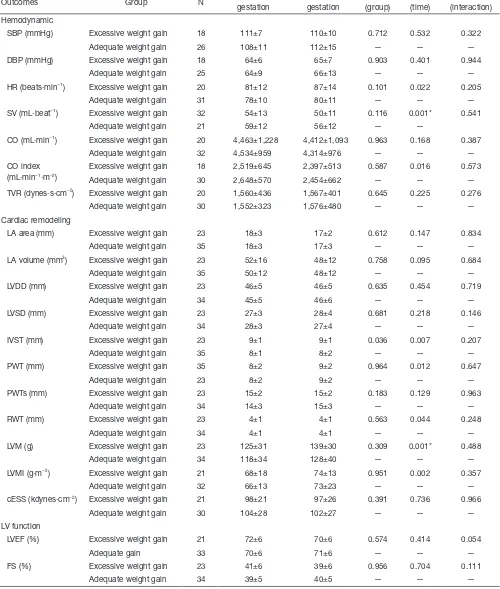
Table 3 Outcomes variables by group (excessive weight gain vs. adequate weight gain) at second (20 weeks) and third (34 weeks) trimesters
Outcomes Group N 20 weeks of gestation
34 weeks of gestation
P value (group)
P value (time)
P value (interaction) Hemodynamic
SBP (mmHg) Excessive weight gain 18 111±7 110±10 0.712 0.532 0.322 Adequate weight gain 26 108±11 112±15 — — — DBP (mmHg) Excessive weight gain 18 64±6 65±7 0.903 0.401 0.944
Adequate weight gain 25 64±9 66±13 — — — HR (beats·min−1) Excessive weight gain 20 81±12 87±14 0.101 0.022 0.205
Adequate weight gain 31 78±10 80±11 — — — SV (mL·beat−1) Excessive weight gain 32 54±13 50±11 0.116 0.001* 0.541
Adequate weight gain 21 59±12 56±12 — —
CO (mL·min−1) Excessive weight gain 20 4,463±1,228 4,412±1,093 0.963 0.168 0.387
Adequate weight gain 32 4,534±959 4,314±976 — — — CO index
(mL·min−1·m−2)
Excessive weight gain 18 2,519±645 2,397±513 0.587 0.016 0.573 Adequate weight gain 30 2,648±570 2,454±662 — — — TVR (dynes·s·cm−5) Excessive weight gain 20 1,560±436 1,567±401 0.645 0.225 0.276
Adequate weight gain 30 1,552±323 1,576±480 — — — Cardiac remodeling
LA area (mm) Excessive weight gain 23 18±3 17±2 0.612 0.147 0.834 Adequate weight gain 35 18±3 17±3 — — — LA volume (mm3) Excessive weight gain 23 52±16 48±12 0.758 0.095 0.684
Adequate weight gain 35 50±12 48±12 — — — LVDD (mm) Excessive weight gain 23 46±5 46±5 0.635 0.454 0.719
Adequate weight gain 34 45±5 46±6 — — — LVSD (mm) Excessive weight gain 23 27±3 28±4 0.681 0.218 0.146
Adequate weight gain 34 28±3 27±4 — — — IVST (mm) Excessive weight gain 23 9±1 9±1 0.036 0.007 0.207
Adequate weight gain 35 8±1 8±2 — — — PWT (mm) Excessive weight gain 35 8±2 9±2 0.964 0.012 0.647
Adequate weight gain 23 8±2 9±2 — — — PWTs (mm) Excessive weight gain 23 15±2 15±2 0.183 0.129 0.963
Adequate weight gain 34 14±3 15±3 — — — RWT (mm) Excessive weight gain 23 4±1 4±1 0.563 0.044 0.248
Adequate weight gain 34 4±1 4±1 — — — LVM (g) Excessive weight gain 23 125±31 139±30 0.309 0.001* 0.488
Adequate weight gain 34 118±34 128±40 — — — LVMI (g·m−2) Excessive weight gain 21 68±18 74±13 0.951 0.002 0.357
Adequate weight gain 32 66±13 73±23 — — — cESS (kdynes·cm−2) Excessive weight gain 21 98±21 97±26 0.391 0.736 0.966
Adequate weight gain 30 104±28 102±27 — — — LV function
LVEF (%) Excessive weight gain 21 72±6 70±6 0.574 0.414 0.054
Adequate gain 33 70±6 71±6 — — —
FS (%) Excessive weight gain 23 41±6 39±6 0.956 0.704 0.111 Adequate weight gain 34 39±5 40±5 — — —
Table 3 (continued)
Outcomes Group N 20 weeks of gestation
34 weeks of gestation
P value (group)
P value (time)
P value (interaction) E (m·s−1) Excessive weight gain 21 86±22 78±15 0.029 0.001* 0.906
Adequate weight gain 33 96±15 88±19 — — — A (m·s−1) Excessive weight gain 21 59±15 61±12 0.635 0.044 0.523
Adequate weight gain 33 56±12 61±15 — — — E/A Excessive weight gain 21 1.5±0.5 1.3±0.3 0.043 <0.001* 0.618
Adequate weight gain 33 1.7±0.5 1.4±0.5 — — — DT (ms) Excessive weight gain 21 134±35 123±39 0.108 0.116 0.530
Adequate weight gain 33 147±41 142±40 — — — IVRT (ms) Excessive weight gain 19 68±17 76±21 0.117 0.075 0.329
Adequate weight gain 28 77±12 79±15 — — — Threshold P value set at 0.002 [i.e., 0.05 divided by the number of outcomes in these analyses (n=27)]. *, P<0.002. A, atrial filling velocity; cESS, wall stress; CO, cardiac output; CO, index, cardiac output index; DBP, diastolic blood pressure; DT, deceleration time of E wave; E, early filling velocity; FS, fractional shortening; HR, heart rate; IVRT, isovolumetric relaxation time; IVST, interventricular septal thickness; LA, left atrial; LV, left ventricular; LVDD, LV diastolic diameter; LVEF, LV ejection fraction; LVM, LV mass; LVMI, LV mass index; LVSD, LV systolic diameter; PWT, posterior wall thickness; PWTs, posterior wall thickness at systole; RWT, relative wall thickness; SBP, systolic blood pressure; SV, stroke volume; TVR, total vascular resistance.
Figure 2 Cardiovascular indicators based on gestational weight gain. “Underweight” women: risk = weight gain >18 kg; non-risk ≤18 kg; “normal weight”: risk= weight gain >16 kg; non-risk ≤16 kg; “overweight” women: risk = weight gain >11.5 kg; non-risk ≤11.5 kg; “obese” women: risk = weight gain >9 kg; non-risk ≤9 kg. A, atrial filling velocity; BMI, body mass index; cESS, wall stress; CO, cardiac output; CO index, cardiac output index; DBP, diastolic blood pressure; DT, deceleration time of E wave; E, early filling velocity; FS, fractional shortening; HR, heart rate; IVRT: isovolumetric relaxation time; IVST, interventricular septal thickness; LA, left atrial; LVDD, LV diastolic diameter; LVEF, LV ejection fraction; LVM, LV mass; LVMI, LV mass index; LVSD, LV systolic diameter; PWT, posterior wall thickness; PWTs, posterior wall thickness at systole; RWT, relative wall thickness; SBP, systolic blood pressure; SV, stroke volume; TVR, total vascular resistance.
LVMI
LVM
cESS
IVRT
DT
EA
A
E
FS
LVEF
LA volume
LA area
SV
HR
DBP
SBP
RWT
PWTs
PWT
IVST
LVSD
LVDD
TVR
CO index
CO
Net change
Excessive weight gain Excessive weight gain Excessive weight gain
Net change
Net change
−20 −10
−0.5
−500 0 500
0.0 0.5
10 20
0 Non-risk
Table 4 Outcomes variables by group (depressive vs. non-depressive at 1st trimester) at second (20 weeks) and third (34 weeks) trimester
Outcomes Group N 20 weeks of gestation
34 weeks of gestation
P value (group)
P value (time)
P value (interaction) Hemodynamic
SBP (mmHg) Non-depressive 34 109±8 112±14 0.571 0.911 0.292
Depressive 10 110±14 108±9 — — —
DBP (mmHg) Non-depressive 33 64±8 66±11 0.727 0.622 0.656
Depressive 10 64±10 64±8 — — —
HR (beats·min−1) Non-depressive 41 79±9 83±12 0.855 0.469 0.078
Depressive 11 81±16 80±13 — — —
SV (mL·beat−1) Non-depressive 42 57±12 53±12 0.069 0.068 0.069
Depressive 12 56±14 56±12 — — —
CO (mL·min−1) Non-depressive 42 4,447±1,037 4,302±879 0.567 0.168 0.898
Depressive 11 4,654±1,162 4,478±879 — — — CO index (mL·min−1·m−2) Non-depressive 40 2,611±575 2,439±638 — — —
Depressive 9 2,512±693 2,368±410 0.717 0.061 0.769 TVR (dynes·s·cm−5) Non-depressive 40 1,508±375 1,590±477 0.577 0.378 0.580
Depressive 11 1,473±366 1,494±283 — — — Cardiac remodeling
LA area (mm) Non-depressive 44 18±3 17±3 0.839 0.180 0.985
Depressive 15 18±3 17±2 — — —
LA volume (mm3) Non-depressive 44 51±13 48±12 0.708 0.130 0.838
Depressive 15 50±14 47±11 — — —
LVDD (mm) Non-depressive 43 46±4 47±5 0.275 0.342 0.645
Depressive 15 44±7 45±6 — — —
LVSD (mm) Non-depressive 43 28±3 28±4 0.042 0.335 0.789
Depressive 15 26±3 27±4 — — —
IVST (mm) Non-depressive 44 8±1 0.84±0.16 0.079 0.138 0.138
Depressive 15 9±1 9±1 — — —
PWT (mm) Non-depressive 44 8±2 9±2 0.100 0.049 0.673
Depressive 15 9±2 9±2 — — —
PWTs (mm) Non-depressive 44 14±3 15±3 0.638 0.161 0.894
Depressive 14 14±2 15±2 — — —
RWT (mm) Non-depressive 43 3±1 4±1 0.022 0.285 0.255
Depressive 15 4±1 4±1 — — —
LVM (g) Non-depressive 43 118±29 131±36 0.424 0.008 0.453 Depressive 15 128±41 136±38 — — — LVMI (g·m−2) Non-depressive 41 67±16 73±20 0.957 0.019 0.618
Depressive 13 69±16 73±16 — — —
cESS (kdynes·cm−2) Non-depressive 40 104±28 104±29 0.293 0.539 0.554
Depressive 12 98±21 93±20 — — —
LV function
LVEF (%) Non-depressive 42 70±6 69±6 0.009 0.876 0.752
Depressive 15 74±4 74±4 — — —
FS (%) Non-depressive 43 39±6 39±5 0.102 0.974 0.845
Depressive 15 41±5 41±6 — — —
Table 4 (continued)
Outcomes Group N 20 weeks of gestation
34 weeks of gestation
P value (group)
P value (time)
P value (interaction) E (m·s−1) Non-depressive 42 93±17 84±19 0.984 0.017 0.374
Depressive 13 90±23 86±16 — — —
A (m·s−1) Non-depressive 42 56±12 62±14 0.821 0.210 0.210
Depressive 13 60±18 60±13 — — —
E/A Non-depressive 42 1.7±0.4 1.4±0.4 0.826 0.002* 0.118 Depressive 13 1.5±0.7 1.4±0.5 — — — DT (ms) Non-depressive 41 144±35 135±38 0.664 0.291 0.686
Depressive 13 137±50 133±49 — — — IVRT (ms) Non-depressive 36 71±15 76±19 0.210 0.315 0.474
Depressive 11 79±11 80±12 — — —
Threshold P value set at 0.002 [i.e., 0.05 divided by the number of outcomes in these analyses (n=27)]. *, P<0.002. A, atrial filling velocity; cESS, wall stress; CO, cardiac output; CO, index, cardiac output index; DBP, diastolic blood pressure; DT, deceleration time of E wave; E, early filling velocity; FS, fractional shortening; HR, heart rate; IVRT: isovolumetric relaxation time; IVST, interventricular septal thickness; LA, left atrial; LV, left ventricular; LVDD, LV diastolic diameter; LVEF, LV ejection fraction; LVM, LV mass; LVMI, LV mass index; LVSD, LV systolic diameter; PWT, posterior wall thickness; PWTs, posterior wall thickness at systole; RWT, relative wall thickness; SBP, systolic blood pressure; SV, stroke volume; TVR, total vascular resistance.
Figure 3 Cardiovascular indicators based on antenatal depression (first trimester). Risk (depressed women) = CESD score ≥16; non-risk (non-depressed women) = CESD score <16. A, atrial filling velocity; BMI, body mass index; cESS, wall stress; CO, cardiac output; CO index, cardiac output index; DBP, diastolic blood pressure; DT, deceleration time of E wave; E, early filling velocity; FS, fractional shortening; HR, heart rate; IVRT: isovolumetric relaxation time; IVST, interventricular septal thickness; LA, left atrial; LVDD, LV diastolic diameter; LVEF, LV ejection fraction; LVM, LV mass; LVMI, LV mass index; LVSD, LV systolic diameter; PWT, posterior wall thickness; PWTs, posterior wall thickness at systole; RWT, relative wall thickness; SBP, systolic blood pressure; SV, stroke volume; TVR, total vascular resistance.
LVMI
LVM
cESS
IVRT
DT
EA
A
E
FS
LVEF
LA volume
LA area
SV
HR DBP
SBP
RWT
PWTs
PWT
IVST
LVSD
LVDD
TVR
CO index
CO
Net change
Net change Antenatal depression (first trimester)
Antenatal depression (first trimester)
Antenatal depression (first trimester)
Net change
−20 −10
−0.5
−500 0 500
0.0 0.5
10 20
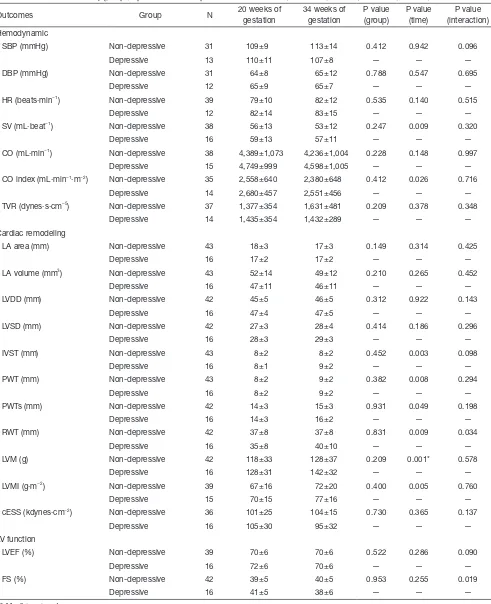
Table 5 Outcomes variables by group (depressive vs. non-depressive at third trimester) at second (20 weeks) and third (34 weeks) trimester
Outcomes Group N 20 weeks of gestation
34 weeks of gestation
P value (group)
P value (time)
P value (interaction) Hemodynamic
SBP (mmHg) Non-depressive 31 109±9 113±14 0.412 0.942 0.096 Depressive 13 110±11 107±8 — — — DBP (mmHg) Non-depressive 31 64±8 65±12 0.788 0.547 0.695
Depressive 12 65±9 65±7 — — —
HR (beats·min−1) Non-depressive 39 79±10 82±12 0.535 0.140 0.515
Depressive 12 82±14 83±15 — — —
SV (mL·beat−1) Non-depressive 38 56±13 53±12 0.247 0.009 0.320
Depressive 16 59±13 57±11 — — —
CO (mL·min−1) Non-depressive 38 4,389±1,073 4,236±1,004 0.228 0.148 0.997
Depressive 15 4,749±999 4,598±1,005 — — — CO index (mL·min−1·m−2) Non-depressive 35 2,558±640 2,380±648 0.412 0.026 0.716
Depressive 14 2,680±457 2,551±456 — — — TVR (dynes·s·cm−5) Non-depressive 37 1,377±354 1,631±481 0.209 0.378 0.348
Depressive 14 1,435±354 1,432±289 — — — Cardiac remodeling
LA area (mm) Non-depressive 43 18±3 17±3 0.149 0.314 0.425
Depressive 16 17±2 17±2 — — —
LA volume (mm3) Non-depressive 43 52±14 49±12 0.210 0.265 0.452
Depressive 16 47±11 46±11 — — —
LVDD (mm) Non-depressive 42 45±5 46±5 0.312 0.922 0.143
Depressive 16 47±4 47±5 — — —
LVSD (mm) Non-depressive 42 27±3 28±4 0.414 0.186 0.296
Depressive 16 28±3 29±3 — — —
IVST (mm) Non-depressive 43 8±2 8±2 0.452 0.003 0.098
Depressive 16 8±1 9±2 — — —
PWT (mm) Non-depressive 43 8±2 9±2 0.382 0.008 0.294
Depressive 16 8±2 9±2 — — —
PWTs (mm) Non-depressive 42 14±3 15±3 0.931 0.049 0.198
Depressive 16 14±3 16±2 — — —
RWT (mm) Non-depressive 42 37±8 37±8 0.831 0.009 0.034
Depressive 16 35±8 40±10 — — —
LVM (g) Non-depressive 42 118±33 128±37 0.209 0.001* 0.578 Depressive 16 128±31 142±32 — — — LVMI (g·m−2) Non-depressive 39 67±16 72±20 0.400 0.005 0.760
Depressive 15 70±15 77±16 — — —
cESS (kdynes·cm−2) Non-depressive 36 101±25 104±15 0.730 0.365 0.137
Depressive 16 105±30 95±32 — — — LV function
LVEF (%) Non-depressive 39 70±6 70±6 0.522 0.286 0.090
Depressive 16 72±6 70±6 — — —
FS (%) Non-depressive 42 39±5 40±5 0.953 0.255 0.019
Depressive 16 41±5 38±6 — — —
Table 5 (continued)
Outcomes Group N 20 weeks of gestation
34 weeks of gestation
P value (group)
P value (time)
P value (interaction) E (m·s−1) Non-depressive 39 92±15 83±16 0.711 0.007 0.417
Depressive 16 92±25 87±23 — — —
A (m·s−1) Non-depressive 39 56±12 61±12 0.315 0.073 0.606
Depressive 16 60±15 63±17 — — —
E/A Non-depressive 39 1.6±0.5 1.4±0.4 0.627 <0.001* 0.312 Depressive 16 1.5±0.6 1.4±0.4 — — — DT (ms) Non-depressive 38 143±38 136±38 0.724 0.163 0.898
Depressive 16 140±44 132±47 — — — IVRT (ms) Non-depressive 32 74±16 79±19 0.310 0.206 0.479
Depressive 15 71±11 73±14 — — —
Threshold P value set at 0.002 [i.e., 0.05 divided by the number of outcomes in these analyses (n=27)]. *, P<0.002. A, atrial filling velocity; cESS, wall stress; CO, cardiac output; CO, index, cardiac output index; DBP, diastolic blood pressure; DT, deceleration time of E wave; E, early filling velocity; FS, fractional shortening; HR, heart rate; IVRT: isovolumetric relaxation time; IVST, interventricular septal thickness; LA, left atrial; LV, left ventricular; LVDD, LV diastolic diameter; LVEF, LV ejection fraction; LVM, LV mass; LVMI, LV mass index; LVSD, LV systolic diameter; PWT, posterior wall thickness; PWTs, posterior wall thickness at systole; RWT, relative wall thickness; SBP, systolic blood pressure; SV, stroke volume; TVR, total vascular resistance.
Figure 4 Cardiovascular indicators based on antenatal depression (third trimester). Risk (depressed women) = CESD score ≥16; non-risk (non-depressed women) = CESD score <16. A, atrial filling velocity; BMI, body mass index; cESS, wall stress; CO, cardiac output; CO index, cardiac output index; DBP, diastolic blood pressure; DT, deceleration time of E wave; E, early filling velocity; FS, fractional shortening; HR, heart rate; IVRT: isovolumetric relaxation time; IVST, interventricular septal thickness; LA, left atrial; LVDD, LV diastolic diameter; LVEF, LV ejection fraction; LVM, LV mass; LVMI, LV mass index; LVSD, LV systolic diameter; PWT, posterior wall thickness; PWTs, posterior wall thickness at systole; RWT, relative wall thickness; SBP, systolic blood pressure; SV, stroke volume; TVR, total vascular resistance.
LVMI
LVM
cESS
IVRT
DT
EA
A
E
FS
LVEF
LA volume
LA area
SV
HR
DBP
SBP
RWT
PWTs
PWT
IVST
LVSD
LVDD
TVR
CO index
CO
Net change
Net change
Antenatal depression (third trimester) Antenatal depression (third trimester)
Antenatal depression (third trimester)
Net change
−20 −10
−0.5
−500 0 500
0.0 0.5
10 20
without these complications over time (from 20 to 34 weeks of gestation). These cardiovascular changes are considered physiological in pregnant women (18-22). Previous studies showed that these three complications can lead to an increased risk for CVD later in life (13,14,23-25).
Excessive weight gain can lead to higher postpartum weight retention and higher weight status in subsequent pregnancies that increase the risk for maternal CVD, cancer, type II diabetes and obesity (13,23,24). In turn, developing antenatal depression in early pregnancy is linked to the risk of subsequent pre-eclampsia (OR =3.1; 95% CI: 1.4–6.9) (14). A prospective study found that pre-eclampsia increases the risk of death from CVD, particularly in women who developed this complication by 34 weeks of gestation [hazard ratio =9.54 (95% CI: 4.50–20.26)] (25).
Having a high BMI is a recognized risk factor for CVD in the general population. It is reported that men present a 5% increased risk of clinical heart failure with every 1 kg/m2 increase in BMI, and in women this risk is even higher, approximating 7% (11). Elevated BMI seems to alter LV morphology and diastolic function (11,12). A recent prospective study with a median participant follow-up of 37 years reported that women with higher pre-gestational BMI had a higher risk of death from CVD than those with normal BMI. The most frequent causes of death were coronary heart disease (12.3%) and stroke (6%) (26).
Despite the evidence for the long-term consequences on cardiovascular health, the present study shows that the brief period of time established to evaluate potential complications appears to be too short to alter maternal cardiovascular health. By contrast, other complications such as gestational hypertension and GDM alter LV structure and function in only a few weeks (3,7). As described, cardiovascular response to acute stress is an important risk predictor of health outcomes. This risk depends on the duration and strength of stressor exposure (27). Notably, gestational hypertension occurs at 20 weeks of gestation (28) and GDM appears in the early second trimester in patients at high risk (16–18 weeks) and around 24–28 weeks in normal-risk women (29). However, antenatal depression tends to be more frequent during the second and third trimester of pregnancy (30,31). Similarly, a recent study of 172 pregnant women reported that 45% of them had excessive weight gain in the second half of pregnancy, and 55% exceeded weight gain recommendations in the first half of pregnancy (32). The absence of cardiovascular alterations in women who exceed normal weight gain, and in women with antenatal
depression, may be due to their appearance later than GDM and hypertension. Importantly, the present study shows that depressed women are more likely to exceed weight gain recommendations, which is consistent with other studies (33,34). This result highlights the importance of finding alternative treatments to control and reduce depression symptoms to prevent excessive weight gain and its consequent negative health effects for the mother and the fetus (13).
No effect of the aforementioned complications was found for newborn outcomes in our study. However, adverse health effects for newborns have been described because of these complications (13,35,36). With regard to high pre-gestational BMI and excessive weight gain, the common related adverse effects on newborns are preterm birth, cesarean section and macrosomia (13,35). A recent systematic review reported that the increased risk of premature birth and low birth weight associated with antenatal depression remains controversial (36). Thus, further studies are needed to determine whether adverse effects increase the risks for prematurity and low birth weight.
The main limitations of the present study were the small sample size since it was divided into complicated and non-complicated groups, and the high dropout rate of pregnant women, which call for new strategies to enhance patient adherence to the study. Nevertheless, this is the first study to examine the influence of the aforementioned common complications, during this period of pregnancy, on maternal health by echocardiography assessment with a wide range of cardiovascular variables. Future research should be directed towards examining the effect of common obstetrics complications for both understanding their impact on the maternal and fetal cardiovascular system in the long and short-term, and for initiating alternative treatments to control them.
In conclusion, becoming pregnant with a BMI higher than 25, gaining excessive weight during pregnancy or developing antenatal depression does not seem to generate short-term negative consequences on maternal cardiovascular health. However, developing antenatal depression increases the risk for excessive weight gain. The rising incidence of these gestational complications highlights the need for further research in this field.
Acknowledgements
Footnote
Conflicts of Interest: The authors have no conflicts of interest to declare.
Ethical Statement: The study was approved by the Research Ethics Committee of the Hospital Universitario de Fuenlabrada (Madrid, Spain; approval number 240/09) and was in accordance with the ethical guidelines of the Declaration of Helsinki (modified in 2008) and written informed consent was obtained from all patients.
References
1. Weissgerber TL, Wolfe LA. Physiological adaptation in early human pregnancy: adaptation to balance maternal-fetal demands. Appl Physiol Nutr Metab 2006;31:1-11. 2. Valensise H, Novelli GP, Vasapollo B, et al. Maternal
diastolic dysfunction and left ventricular geometry in gestational hypertension. Hypertension 2001;37:1209-15. 3. Novelli GP, Valensise H, Vasapollo B, et al. Left
ventricular concentric geometry as a risk factor in gestational hypertension. Hypertension 2003;41:469-75. 4. Novelli GP, Valensise H, Vasapollo B, et al. Are gestational
and essential hypertension similar? Left ventricular geometry and diastolic function. Hypertens Pregnancy 2003;22:225-37.
5. Schannwell CM, Schneppenheim M, Perings SM, et al. Alterations of left ventricular function in women with insulin-dependent diabetes mellitus during pregnancy. Diabetologia 2003;46:267-75.
6. Freire CM, Nunes Mdo C, Barbosa MM, et al. Gestational diabetes: a condition of early diastolic abnormalities in young women. J Am Soc Echocardiogr 2006;19:1251-6. 7. Sullivan SD, Umans JG, Ratner R. Gestational diabetes:
implications for cardiovascular health. Curr Diab Rep 2012;12:43-52.
8. Sociedad Europea de cardiologia (ESC). Guía de práctica clínica de la ESC para el tratamiento de las enfermedades cardiovasculares durante el embarazo. Rev Esp Cardiol 2012;65:171.e1-e44.
9. Weiss BM, von Segesser LK, Alon E, et al. Outcome of cardiovascular surgery and pregnancy: a systematic review of the period 1984-1996. Am J Obstet Gynecol 1998;179:1643-53.
10. Gelson E, Johnson M. Effect of maternal heart disease on pregnancy outcomes. Expert Rev Obstet Gynecol 2010;5:605-17.
11. Kenchaiah S, Evans JC, Levy D, et al. Obesity and the risk of heart failure. N Engl J Med 2002;347:305-13.
12. Wong CY, O'Moore-Sullivan T, Leano R, et al. Alterations of left ventricular myocardial characteristics associated with obesity. Circulation 2004;110:3081-7.
13. Rasmussen KM, Yaktine AL, editors. Weight gain during pregnancy: reexamining the guidelines. Washington (DC): National Academies Press (US), 2009.
14. Kurki T, Hiilesmaa V, Raitasalo R, et al. Depression and anxiety in early pregnancy and risk for preeclampsia. Obstet Gynecol 2000;95:487-90.
15. Perales M, Santos-Lozano A, Sanchis-Gomar F, et al. maternal cardiac adaptations to a physical exercise program during pregnancy. Med Sci Sports Exerc 2016;48:896-906. 16. Committee on Obstetric Practice. ACOG committee
opinion. Exercise during pregnancy and the postpartum period. Number 267, January 2002. American College of Obstetricians and Gynecologists. Int J Gynaecol Obstet 2002;77:79-81.
17. Sahn DJ, DeMaria A, Kisslo J, et al. Recommendations regarding quantitation in M-mode echocardiography: results of a survey of echocardiographic measurements. Circulation. 1978;58:1072-83.
18. Fok WY, Chan LY, Wong JT, et al. Left ventricular diastolic function during normal pregnancy: assessment by spectral tissue Doppler imaging. Ultrasound Obstet Gynecol 2006;28:789-93.
19. Melchiorre K, Sharma R, Thilaganathan B. Cardiac structure and function in normal pregnancy. Curr Opin Obstet Gynecol 2012;24:413-21.
20. Savu O, Jurcuţ R, Giuşcă S, et al. Morphological and functional adaptation of the maternal heart during pregnancy. Circ Cardiovasc Imaging 2012;5:289-97. 21. Volman MN, Rep A, Kadzinska I, et al. Haemodynamic
changes in the second half of pregnancy: a longitudinal, noninvasive study with thoracic electrical bioimpedance. BJOG 2007;114:576-81.
22. Estensen ME, Beitnes JO, Grindheim G, et al. Altered maternal left ventricular contractility and function during normal pregnancy. Ultrasound Obstet Gynecol 2013;41:659-66.
23. Zhang C, Rexrode KM, van Dam RM, et al. Abdominal obesity and the risk of all-cause, cardiovascular, and cancer mortality: sixteen years of follow-up in US women. Circulation 2008;117:1658-67.
25. Mongraw-Chaffin ML, Cirillo PM, Cohn BA.
Preeclampsia and cardiovascular disease death: prospective evidence from the child health and development studies cohort. Hypertension 2010;56:166-71.
26. Mongraw-Chaffin ML, Anderson CA, Clark JM, et al.
Prepregnancy body mass index and cardiovascular disease mortality: the Child Health and Development Studies. Obesity (Silver Spring) 2014;22:1149-56.
27. Christian LM. Physiological reactivity to psychological stress in human pregnancy: current knowledge and future directions. Prog Neurobiol 2012;99:106-16.
28. Leeman L, Dresang LT, Fontaine P. Hypertensive disorders of pregnancy. Am Fam Physician 2016;93:121-7.
29. Pintaudi B, Fresa R, Dalfrà M, et al. Level of
implementation of guidelines on screening and diagnosis of gestational diabetes: A national survey. Diabetes Res Clin Pract 2016;113:48-52.
30. Castro e Couto T, Cardoso MN, Brancaglion MY, et al. Antenatal depression: prevalence and risk factor patterns
across the gestational period. J Affect Disord 2016;192:70-5. 31. Bennett HA, Einarson A, Taddio A, et al. Prevalence of
depression during pregnancy: systematic review. Obstet Gynecol 2004;103:698-709.
32. Davenport MH, Ruchat SM, Giroux I, et al. Timing of excessive pregnancy-related weight gain and offspring adiposity at birth. Obstet Gynecol 2013;122:255-61. 33. Wright C, Bilder D, DeBlasis T, et al. Psychosocial factors
associated with gestational weight gain in a low-income cohort. J Health Care Poor Underserved 2013;24:332-43. 34. Hill B, Skouteris H, McCabe M, et al. A conceptual model
of psychosocial risk and protective factors for excessive gestational weight gain. Midwifery 2013;29:110-4. 35. Abenhaim HA, Kinch RA, Morin L, et al. Effect of
prepregnancy body mass index categories on obstetrical and neonatal outcomes. Arch Gynecol Obstet 2007;275:39-43. 36. Gentile S. Untreated depression during pregnancy: Short-
and long-term effects in offspring. A systematic review. Neuroscience 2015. [Epub ahead of print].