DOI: http://dx.doi.org/10.26483/ijarcs.v8i7.4272
Volume 8, No. 7, July – August 2017
International Journal of Advanced Research in Computer Science
RESEARCH PAPER
Available Online at www.ijarcs.info
ISSN No. 0976-5697
THRESHOLD SEGMENTATION USING MODIFIED 2D-OTSU PSO
ALGORITHM
M. Rajalakshmi
Research Scholar in Department of Computer Science Avinashilingam Institute for Women
Coimbatore, India
Dr. P. Subashini
Professor in Department of Computer Science Avinashilingam Institute for Women
Coimbatore, India
Abstract: Median filter is a technique which applied to remove impulse noise in image processing. Filtered images are carried out to the next level of operations, such as segmentation and object recognition, etc. In this study chili x-ray images are taken for analysis. The chili x-ray images were preprocessed using existing algorithms such as Average filter, Median filter, Wiener filter, Gamma intensity correction and CLAHE, and proposed algorithms such as 4-connected Median filter, weighted 4-connected median filter and Optimized connected Median filter using PSO. Texture regions are extracted by gabor filter. From the extracted texture regions Modified Range filter along with Adaptive Particle Swarm Optimization were applied to extract textures. To perform the next level operation such as segmentation, fixed threshold and Otsu threshold with PSO were applied. However seeds and fungus affected portions of chili x-ray images were not clear. To overcome the above problem this research paper proposes a well-organized algorithm and it is known as modified 2-D Otsu PSO algorithm. It performs better than the previous threshold algorithms. Performance measures are taken to prove that the proposed algorithm works better than the previous methods.
Keywords: Threshold; Particle Swarm Optimization; Chili x-ray image; Otsu; morphological operators.
1. INTRODUCTION
Threshold is a process used to convert image pixels into black and white is known as binarization [1]. Threshold value obtained as higher than the value of the image pixel than the particular image pixel was converted into white. Likewise Threshold value obtained was lower than the value of the image pixel than the particular pixel was converted into black [12]. It is a very simple and an important process in the recognition pipeline [6]. The performance of a threshold process shows directly its impacts on the classification process.
Images taken in real-time environment may consist of various artifacts such as shadow, background noise, contrast variation level etc. Accurate binarization of the images taken in real-time environment is very complex and important one. Separating the object from the noise background is a challenging work under various circumstances [15]. An improper selection of threshold interprets the object wrongly as noise and interprets the noise wrongly as object. This will turn into degrading performance.
Otsu’s method of threshold is the most powerful and global threshold method. It performs image binarization based on the histogram shape of an image. Otsu algorithm assumes that the image for binarization contains only foreground and background pixels [5]. It computes the optimal threshold by minimizing the intra-class variance that separates the foreground pixels from background pixels [10].
In the prior research work, Particle Swarm Optimization has effectively implemented in many application areas. Now, the PSO algorithm has applied to resolve the crisis of threshold segmentation. Zahara et al. [7] employed the PSO algorithm to select the threshold of an image with multi-modal histograms. P.Yin [13], finds the optimal threshold by calculating cross entropy by using PSO algorithm. Sathya et
al. [14] proposed multi level threshold segmentation based on PSO algorithm with the image histograms. Hongmei et al. [17] proposed an improved PSO algorithm to segment images by adopting the maximum entropy. AndreL et al. [3] proposed color image segmentation based on image entropy. In this proposed work toxin contaminated and uncontaminated chilies were taken. These chili x-ray images were preprocessed by some existing algorithms and also with the proposed preprocessing algorithms. After preprocessing the chili x-ray images were texture segmented [2] using gabor and range filter. Subsequent to range filter process the images were binarized with fixed threshold method. Following to the threshold process of an image, the results obtained for the chili image segmentation was not in acceptable manner. Because some of the chilies were contaminated and the position of the seeds were covered by the fungus which seems difficult to predict well. To improve the image quality, the selection of threshold value for binarization was further improved by applying particle swarm optimization with Otsu algorithm. The result of the above process also contains unclear seeds in chili x-ray images. Fitness function in the particle swarm optimization was slightly modified to obtain better segmentation results. Finally the binarized chili x-ray images were processed by some morphological functions to provide better segmentation results.
The present study has organized in the following scheme: section 2 deals with the proposed method used, the results and discussions are explained in section 3, whereas the final conclusions are explained and in section 4 all the references taken for the study were given.
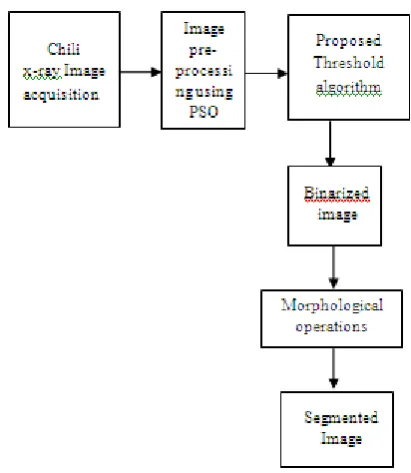
In order to reduce the complexity of classification, the gray scale image was converted into binary image by a selection of threshold value. Binarization can be achieved either by the function of local threshold or global threshold algorithms [3]. Figure 1 shows the block diagram of the binarization method.
Figure 1. Flow of proposed work
In the fixed threshold method one threshold value was given for the entire image. On the implication of one threshold value, the entire image pixels are classified into black and white i.e., foreground and background. This can be written as follow in the equation 1.
T(x, y)= (1)
where refers the image pixel of the input image and T(x,y) refers the pixel of the thresholded image.
A. Fixed threshold method
In this threshold method, a particular intensity value was used as a separator, i.e., the image pixel values were clustered into two sets, namely foreground and background [9]. On the trial error method, an optimal threshold value was selected to do the above function. The threshold value selected was a scalar number and it was applied to binarize the image by using the following equation 2.
Ib (x, y) = (2)
where Ib(x, y) refers the binarized image and T refers fixed threshold value selected by the trial error method.
B. Otsu Algorithm.
The main aim of Otsu Algorithm is to find the threshold value where as the sum of the foreground and background value spread out has to be minimum [7]. Threshold value T is obtained by Equation 3.
T = (3)
where μ0 refers to the average grey value of the object point,μ1 refers to the average grey value of the background
C. Proposed threshold algorithms
In the image processing techniques, there are many applications are used to differentiate the foreground from the background by employing their gray level value of pixels. Among them threshold is an important and efficient tool to do the above mentioned function [21]. Threshold function can be done by many methods. Each method has its own advantages as well as disadvantages. Among the various methods Maximum class square error is an efficient method to find the perfect threshold where the pixels of the image in a group are close to one another [20]. Despite finding of correct threshold for efficient separation of foreground from the background leads to optimization problem. In order to overcome the above stated problem Particle swarm optimization was employed in the proposed research work. Earlier studies also employed particle swarm optimization for the same kind of problem [8].
PSO algorithm
Particle swarm optimization is a best optimization algorithm was developed by Kennedy and Eberhart. It is a very simple and well known algorithm [11]. The model of PSO has been designed in such a manner to attain the maximum benefits from its nearby particles. It can be easily implemented and applied to solve many optimization problems.
Let X and V refer to the particle’s current position and velocity respectively [4]. At the iteration m, each particle
position j is noted by and a velocity
is noted by in the entire search space n. Position of each particle and velocity is updated by using the equations (4) and (5) as follows.
(4)
(5)
where m is the current iteration number, c1 and c2 values are chosen as equal to 2, w is the energy weight and r1, r2 are the random numbers generated in between [0,1].
The fitness function of each particle are obtained as follows in the equations (6), (7) and (8).
f1(g)= (6)
f2(g) = (7)
f(p) = max (8) where p is obtained from particle’s position which lies between 0 and 255.
refers the number of pixels whose gray value is less than p,
refers the number of pixels whose gray value is greater than p,
is the average of pixels whose gray value is less than p,
is the average of pixels whose gray value is greater than p,
is the median of pixels whose gray value is less than p and
is the median of pixels whose gray value is greater than p.
The PSO algorithm starts its functions with randomly generated population. Each Particle position and velocities were initialized. Objective function was calculated by using equation (8) i.e. maximum value of fitness functions f1(g) and f2(g). The pbest and gbest are two important variables which represent the best particle position in local and the best particle position in global respectively. The proposed PSO algorithm was given below:
Algorithm
Step 1: The particle position and their velocity are initialized.
Step 2: Using the equation (8) compute the objective function.
Step 3: The local and global best position of particles were updated. Search the maximum value which satisfies the condition f(pbest) < f(xj). Continue the search until f(pbest) < f(gbest) reaches and record the corresponding particle position as best threshold value.
Step 4: Update the particle position and velocity using the equations (4) and (5).
Step 5: Repeat steps 2 to 4 until stop criterion is satisfied or the desired optimal result has been reached.
D.Morphological operations:
The aim of morphological operations is to obtain perfection on improper structure of an image [19]. Morphological operations such as Close, Majority, Thicken, and Remove are used in this research. The Closing operation is applied to bring the smooth sections of contour in the chili binary image. It fills the gap in the contour by the process of eliminating the small holes. The Closing is computed by using the following equation (9).
B) (9) The Majority is another morphological operation which sets a pixel value as one when five or more neighborhood pixels have the value of one. On the contrary it sets pixels value as zero.
Thickening operation helps that to strengthen the selected portions of object pixels of chili binary image. Thus the thickened chili binary image contains original chili image pixels and additional strengthened object pixels. The Thicken is calculated by using the following equation (10).
(10)
The Remove is another morphological operation which is used to remove interior pixels of an image. It retains the outline of the image shape in the neighborhood.
3. IMPLEMENTATION RESULTSANDDISCUSSION
The images are undertaken to threshold through the algorithms which are shown above. To evaluate these algorithms two performance measures were taken such as Uniformity, Gray level contrast, Precision, Recall and Accuracy were taken. A Mean value of these measures were taken as standard for the final evaluation criteria. If the mean value is greater, then it indicates that the threshold segmentation result is good.
Uniformity Measure: A good threshold selection divides the
image into unique region parts. Each region has uniform property [22]. It is measured using the following equation (11).
∑∑
( )
= =
=
Mx yi M
j
j
i
X
Um
1 1
2
,
(11) where Mx, My are the dimensions of the input image and X is the input vector.
Gray-Level Contrast: Threshold image segmentation is
dividing the image into two different is bigger, the gray-level contrast is bigger [22]. And the performance of the threshold segmentation algorithms is evaluated by using the following equation 12.
gc = (12)
where ff represents the mean of gray value of foreground object and fb represents the mean of gray value of background. The high gray level contrast indicates better segmentation result obtained through threshold algorithm [4]. The Precision, Recall and Accuracy measures are calculated by using the following equations (13), (14) and (15)
Precision= (13)
Recall= (14)
F1= (15)
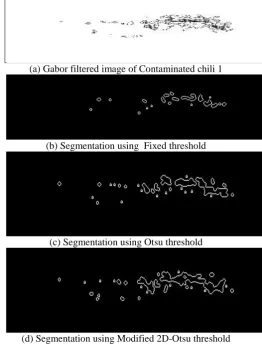
where TP is the number of uncontaminated samples in the class, FP is the number of contaminated samples classified as uncontaminated samples, FN is the number of uncontaminated samples classified as contaminated samples, TN is the number of contaminated samples in the class[18]. The performance measures of the above three filtering methods were shown in table 4. The threshold segmentation results for 4-connected Median filter are shown in figure 2, 3, 4, 5 and their performance measures are shown in table 1.
(a) Gabor filtered image of Contaminated chili 1
(b) Segmentation using Fixed threshold
(d) Segmentation using Modified 2D-Otsu threshold Figure2. Threshold segmentation results of 4-connected Median filter for contaminated chili1
(a) Gabor filtered image of Contaminated chili 2
(b) Segmentation using Fixed threshold
(c) Segmentation using Otsu threshold
(d) Segmentation using Modified 2D-Otsu threshold Figure3. Threshold segmentation results of 4-connected
Median filter for contaminated chili2
(a) Gabor filtered image of Uncontaminated chili 1
(b) Segmentation using Fixed threshold
(c) Segmentation using Otsu threshold
(d) Segmentation using Modified 2D-Otsu threshold Figure4. Threshold segmentation results of 4-connected Median filter for uncontaminated chili1
(a)Gabor filtered image of Uncontaminated chili 2
(b) Segmentation using Fixed threshold
(c) Segmentation using Otsu threshold
(d) Segmentation using Modified 2D-Otsu threshold Figure5. Threshold segmentation results of 4-connected Median filter for uncontaminated chili2
Table1. Performance measures of Threshold algorithms for 4-connected Median filter
Image Measure/ Method
Fixed threshol
d
Otsu threshol d + PSO
Modifie d 2D Otsu PSO
Contaminated chili 1
Uniformit
y 1.00 1.00 0.99
Gray level contrast
0.99 0.99
Contaminated chili 2
Uniformit
y 1.00 0.99 0.99
Gray level contrast
0.99 0.98
0.99
Mean 0.99 0.99 0.99
Uncontaminat ed chili 1
Uniformit
y 1.00 1.00 1.00
Gray level contrast
0.99 0.99 0.99
Mean 0.99 0.99 0.99
Uncontaminat ed chili 2
Uniformit
y 0.99 0.99 0.98
Gray level contrast
0.98 0.97 0.97
Mean 0.99 0.98 0.98
The threshold segmentation results of the Weighted 4-connected Median filter are shown in figure 6, 7, 8, 9 and their performance measures are shown in table 2.
(a) Gabor filtered image of Contaminated chili 1
(b) Segmentation using Fixed threshold
(c) Segmentation using Otsu threshold
(d) Segmentation using Modified 2D-Otsu threshold Figure6. Threshold segmentation results of the Weighted
4-connected Median filter for contaminated chili1
(a) Gabor filtered image of Contaminated chili 2
(b) Segmentation using Fixed threshold
(c) Segmentation using Otsu threshold
(d) Segmentation using Modified 2D-Otsu threshold Figure7. Threshold segmentation results of Weighted
4-connected Median filter for contaminated chili2
(a) Gabor filtered image of Uncontaminated chili 1
(b) Segmentation using Fixed threshold
(d) Segmentation using Modified 2D-Otsu threshold
Figure8. Threshold segmentation results of the Weighted 4-connected Median filter for uncontaminated chili1
(a) Gabor filtered image of Uncontaminated chili 2
(b) Segmentation using Fixed threshold
(c) Segmentation using Otsu threshold
(d) Segmentation using Modified 2D-Otsu threshold Figure9. Threshold segmentation results of the Weighted
4-connected Median filter for uncontaminated chili2
Table2. Performance measures of Threshold algorithms for Weighted 4-connected Median filter
Image Measure/ Method
Fixed threshol
d
Otsu threshol d + PSO
Modifie d 2D Otsu PSO
Contaminated chili 1
Uniformit
y 1.00 0.99 0.99
Gray level contrast
0.99 0.98 1.00
Mean 0.99 0.99 0.99
Contaminated chili 2
Uniformit
y 0.99 0.99 0.99
Gray level contrast
0.98 0.98 0.98
Mean 0.99 0.99 0.99
Uncontaminat Uniformit
Gray level contrast
1.0 1.0 1.0
Mean 1.0 1.0 1.0
Uncontaminat ed chili 2
Uniformit
y 1.00 1.00 1.00
Gray level contrast
0.99 0.99 0.99
Mean 0.99 0.99 0.99
[image:6.595.311.574.248.594.2]The threshold segmentation results for the Optimized connected Median filter using PSO are shown in figure 10, 11, 12, 13 and their performance measures are shown in table 3.
(a) Gabor filtered image of Contaminated chili 1
(b) Segmentation using Fixed threshold
(c) Segmentation using Otsu threshold
(d) Segmentation using Modified 2D-Otsu threshold Figure10. Threshold segmentation results of the Optimized connected Median filter using PSO for Contaminated chili1
(a) Gabor filtered image of Contaminated chili 2
(c) Segmentation using Otsu threshold
(d) Segmentation using Modified 2D-Otsu threshold Figure11. Threshold segmentation results of the Optimized connected Median filter using PSO for contaminated chili2
(a) Gabor filtered image of Uncontaminated chili 1
(b) Segmentation using Fixed threshold
(c) Segmentation using Otsu threshold
(d) Segmentation using Modified 2D-Otsu threshold Figure12. Threshold segmentation results of the Optimized connected Median filter using PSO for Uncontaminated chili 1
(a) Gabor filtered image of Uncontaminated chili 2
(b) Segmentation using Fixed threshold
(c) Segmentation using Otsu threshold
(d) Segmentation using Modified 2D-Otsu threshold Figure13. Threshold segmentation results of Optimized connected Median filter using PSO for Uncontaminated chili 2
Table3. Performance measures of the Threshold algorithms for Optimized connected Median filter using PSO
Image Measure/ Method
Fixed threshol
d
Otsu threshol d + PSO
Modifie d 2D Otsu PSO
Contaminated chili 1
Uniformit
y 0.99 0.99 0.99
Gray level contrast
0.98 0.98 0.97
Mean 0.99 0.99 0.98
Contaminated chili 2
Uniformit
y 0.99 0.98 0.98
Gray level contrast
0.97 0.96 0.96
Mean 0.97 0.97 0.97
Uncontaminat ed chili 1
Uniformit
y 0.99 0.99 0.99
Gray level contrast
0.99 0.98 0.98
Mean 0.99 0.99 0.99
Uncontaminat ed chili 2
Uniformit
y 0.99 0.97 0.98
Gray level contrast
0.97 0.95 0.95
Mean 0.97 0.96 0.97
Filter Method Measure/ Method Fixed threshold Otsu threshold + PSO Modified 2D Otsu PSO 4-connected Median filter
Precision 65 57 75
Recall 50 64 72
Accuracy 72 58 74
Weighted
4-connected Median filter
Precision 88 57 88
Recall 92 64 96
Accuracy 90 58 92
Optimized connected Median filter using
PSO
Precision 69 57 78
Recall 72 64 72
Accuracy 70 58 76
Discussion
In this research work 50 chili x-ray images were taken. Among them 25 were contaminated and 25 were uncontaminated. The contaminated chili seeds were surrounded by fungus. Uniformity, Gray level Contrast, mean value of the both, Precision, Recall, Accuracy were taken as performance measures to verify the segmentation results. From the comparison of the above tables, it infers among the three filters, ‘Uniformity and Gray level Contrast and their mean value, Precision, Recall, Accuracy of the Weighted 4 connected median filter has obtained higher performance measure than the others. The implementation of Fixed threshold shows more seeds in the Optimized connected Median filter using PSO, little lesser seeds in the Weighted 4 connected median filter and a very low seeds in 4 connected median filter. The same result were obtained for the Otsu threshold and Modified 2D Otsu PSO. However in comparison of the seeds structure appearance in the chili x-ray images, Optimized connected Median filter using modified 2D Otsu PSO has clear appearance of more seeds than the others. Hence Optimized connected Median filter using modified 2D Otsu PSO provides better segmentation results than the other threshold methods.
4.CONCLUSION
Segmentation is a process which partitions the image into several meaningful parts. Threshold segmentation divides the image into two levels i.e below the threshold level are turned into black and above the threshold level are turned into white. In this proposed work 50 chili images were taken for the segmentation purpose. These 50 chili images were preprocessed with the existing filters and the proposed methods. The preprocessed images were taken for the segmentation process. Texture regions are extracted by gabor filter. From the extracted texture regions Modified Range filter along with Adaptive Particle Swarm Optimization were applied to extract the textures. Further the chili x-ray images were segmented by fixed threshold method. The performance metric obtained was high however the images of the seeds are not clear and visible manner. In addition to the above process PSO and Otsu are adopted to improve the chili images. Yet the inner structure
fitness function of PSO is slightly modified to overcome the above drawback and it is applied to the threshold selection. The resultant images structure is clear and understandable than the previous methods. Performance measures were taken and are uniformity, gray level contrast, average of both, precision, recall and accuracy. The performance measure results were also ensures the same. Finally the researcherconcludes that the Optimized connected Median filter along with modified 2D Otsu PSO provides better segmentation results.
5.REFERENCES
1) Abdou and W. Pratt, “Quantitative design and evaluation of enhancement/ thresholding edge detectors”, Proc. IEEE, vol. 67, May 1979, pp. 753–763.
2) Amanpreet Kaur, M.D. Singh, “An Overview of PSO- Based
Approaches in Image Segmentation”, International Journal of Engineering and Technology Volume 2 No. 8, August, 2012,pp.1349-1357.
3) AndreL.Barbieri, G.F.deArruda, FranciscoA.Rodrigues,
OdemirM.Bruno, Luciano da Fontoura Costa, “An entropy based approach to automatic image segmentation of satellite images”, Physica A, 390, 2011, pp. 512-518.
4) Anita Tandan, Rohit Raja, Yamini Chouhan, “Image
Segmentation Based on Particle Swarm Optimization Technique”, International Journal of Science, Engineering and Technology Research (IJSETR), Vol. 3, Issue 2, February 2014,pp.257-260.
5) B. Naga Gayathri Divya, K. Sowjanya, “Otsu’s Method Of
Image Segmentation Using Particle Swarm Optimization Technique”, International Journal Of Scientific Engineering And Technology Research, Vol.04, Issue no.10, April-2015, pp. 1805-1808.
6) Cristina Stolojescu-Crisan, Stefan Holban,” A Comparison of X-Ray Image Segmentation Techniques”, Advances in Electrical and Computer Engineering, Vol. 13, Number 3, 2013,pp.85-92.
7) E. Zahara, S. S. Fan and D. Tsai,”Optimal multithresholding using a hybrid optimization approach”, Pattern Recognition Letters, Elsevier, 26, 2005,pp. 1082-1095.
8) Elham Akbari Baniani, Abdolah Chalechale, “Hybrid PSO
and Genetic Algorithm for Multilevel Maximum Entropy Criterion Threshold Selection”, International Journal of Hybrid Information Technology Vol.6, No.5, 2013, pp.131-140.
9) J. Min, M. W. Powell and K. W. Bowyer,” Automated
Performance Evaluation of Range Image segmentation Algorithms”, IEEE Transactions on Systems, Man and Cybernetics Part, Vol. 34 2004, pp. 263.
10) Kalpana Chauhan, M. L. Dewal, Rajeev Kumar Chauhan,
Manojkumar Rohit, ”Regurgitation Area Segmentation Using the Particle Swarm Optimization and Multilevel Threshold
Selection”, International Journal of Computer and
Communication Engineering, Volume 4, Number 4, July 2015, pp. 282-289.
11) Kennedy. J, and R. Eberhart, “Particle Swarm Optimization”, Proceedings of the IEEE conference on neural networks – ICNN_95,Perth, Australia,1995, pp. 1942-1948.
12) Kite, T.D., Evans, B.L., Daamera-Venkata, N., and Bovil, A.C.: “Image Quality Assessment Based on a Degradation Model”,in IEEE Trans. Image Processing, vol.9, 2000, pp.909-922.
13) P. D. Sathya, R. Kayalvizhi, ”PSO-Based Tsallis
14) P. Yin, “Multilevel minimum cross entropy threshold selection based on particle swarm optimization”, Applied Mathematics and Computation, Vol. 184, 2007,pp. 503-513. 15) P.Subashini, N.Sridevi,” An Optimal Binarization Algorithm
Based onParticle Swarm Optimization”, International Journal of Soft Computing and Engineering (IJSCE), Vol.1, Issue-4, September 2011,pp.32-36.
16) Ravi S, A M Khan,” Morphological Operations for Image Processing: Understanding and its Applications”, NCVSComs-13 Conference Proceedings, 2013, pp.17-19.
17) T. Hongmei, W. Cuixia, H. Liying, and W. Xia, ”Image
Segmentation Based on Improved PSO,”the proceedings of the International Conference on Computer and Communication Technologies in Agriculture Engineering(CCTAE2010), 2010,pp.191-194.
18) S.K.Mahendran, S.Santhosh Baboo, “An Enhanced Tibia
Fracture Detection Tool Using Image Processing and Classification Fusion Techniques in X-Ray Images”,Global
Journal of Computer Science and Technology, Volume 11, Issue 14, Version 1.0, August 2011,pp. 23-28.
19) S.K.Mahendran, S.Santhosh Baboo,” Enhanced Automatic
X-Ray Bone Image Segmentation using Wavelets and Morphological Operators”, 2011 International Conference on Information and Electronics Engineering (IPCSIT, Vol.6, 2011, pp. 125-129.
20) Vinod Kumar, Anil Saini, “Detection system for lung cancer based on neural network: X-Ray validation performance”, International Journal of Enhanced Research in Management & Computer Applications, Vol. 2, Issue 9, Nov.-Dec., 2013, pp. 40-47.
21) Zhiwei Ye, Zhengbing Hu, Zhengbing Hu, Hongwei Chen,
“Image Segmentation Using Thresholding and Swarm Intelligence, Journal Of Software, Vol. 7, No. 5, May 2012, pp.1074-1082.
22) Yubing Dong, Mingjing Li , and Ying Sun,” Evaluation