DOI: http://dx.doi.org/10.26483/ijarcs.v9i2.5567
Volume 9, No. 2, March-April 2018
International Journal of Advanced Research in Computer Science
RESEARCH PAPER
Available Online at www.ijarcs.info
ISSN No. 0976-5697
HANDS ON MEDICATION USING DATA VISUALISATION TOOL
K.Varsha, B.Teepthika, K.Vinay, B.Kiran Sai Varma
B.Tech, IT, PVPSITVijayawada,Andhra Pradesh, India
Dr B V Subba Rao*
Prof & HOD of IT Department, PVPSIT Vijayawada, Andhra Pradesh, India
Abstract: Tableau is a Data Visualization tool that is extensively used for Business Intelligence but it is not limited to it. This can also be used to provide information about medicines to people. It helps to craft interactive graphs and charts in the form of dashboards and worksheets which helps individuals to understand in an effective way. And all of this is made probable with gesticulation as easy as drag and drop! It helps people to know in detail about the diseases and its symptoms, first-aid and safety measures are provided so that they can be medicated easily within the reach of the people .If there is any serious issue or drastic symptoms of the diseases the top doctors for the particular diseases in the city with their details plotted in a map view so that the patient can concern a doctor. This information is very much useful for each and every individual and health sector.
Keywords: A Data Visualization, Tableau, first-aid, health
I. INTRODUCTION
Many people suffer from different types of diseases that they are not aware off. Before taking some medicines or any type of action on their suffering they must get the knowledge on the problem. They must have a clear idea on their condition. No one can just simply take whatever medicine they get without knowing the actual condition.
Through our scheme work “MEDICATION IN HANDS” we can know the symptoms of particular diseases before going to the doctor we can take necessary precautions and first-aid if necessary. We can consult the specialist for a particular disease with the help of the information provided in our project Medication in hands.
This application is meant for showing a particular to medication in hands
The main goal of this application is to get full fledged data about a particular place of hospital and people are medicated easily.
Some of the elements have been presented in this application, they are:
II.DATA COLLECTION
[image:1.595.317.479.430.618.2]Our tableau project MEDICATION IN HANDS that helps each and every single person when they are in need to know about their health condition and what action they have to take for that condition. It consist of the symptoms, causes, disease name , first-aid that can be done at home, medicines recommended for that particular disease, approximate cost of the medicine, if any surgery required or not, if required what is it, cost of the surgery, doctors available for that disease treatment, doctors location, doctors contact number for appointment ,hospital location. This all data is helpful for each and every person in need.
Table I
S. No Diseases Symptoms Causes
First-aid Medicine Safety measures
Surgery
Approx-surgery cost
Name of the doctor
Qualification Hospital name Contact number Latitude Longitude Area
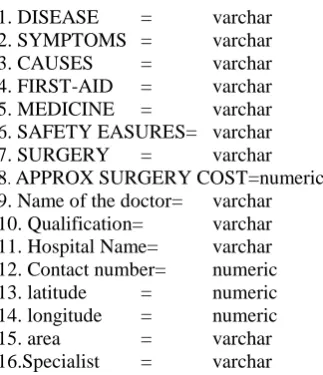
2.1 Datatypes for the Collected Attributes:
Fields and Datatypes
1. DISEASE = varchar
2. SYMPTOMS = varchar
3. CAUSES = varchar
4. FIRST-AID = varchar
5. MEDICINE = varchar
6. SAFETY EASURES= varchar
7. SURGERY = varchar
8. APPROX SURGERY COST=numeric
9. Name of the doctor= varchar
10. Qualification= varchar
11. Hospital Name= varchar
12. Contact number= numeric
13. latitude = numeric
14. longitude = numeric
15. area = varchar
16.Specialist = varchar
This tableau software consists of important tools such as file, dashboard, map and server.
DASHBOARD: A dashboard is a collection of several
worksheets and supporting information shown in a single place so you can compare and monitor a variety of data simultaneously.
For example, you may have a set of views that you review every day. Rather than flipping through each worksheet, you can create a dashboard that displays all the views at once.
The tableau file will be saved with an extension “. tbsl”. These files can be of various types of formats of data like Excel
Text file Access JSON file Spatial file Statistical file More...
MAPS: The application need to visualize the data
geographically, we can plot the data on a map in Tableau.
SERVER: Tableau Server public is the option where the
tableau application is linked with the web application to get the information. The Tableau Software [1] is an online solution for sharing, distributing, and collaborating on content created in Tableau Shareable. Create workbooks and views, dashboards, and data sources in Tableau Desktop, and then publish this content to the server.
III.DATA PREPROCESSING
Latitude is an angle which ranges from 0° at the Equator to 90° (North or South) at the poles
Longitude is a geographic coordinate that specifies the east-west position of a point on the Earth's surface [2].
With the help of Latitude and Longitude we can spot a particular location of the specific doctor and hospital in the map[3].
IV.EXPERIMENTAL RESULTS AND DATA VISUALIZATION
Details of a particular hospital like hospital name, latitude, longitude, area, contact number, name of the doctor, qualification, specialists etc when we hover mouse on it.
Detailed view of the doctors information in our sheet2 like doctors name, qualification, contact number, area, specialist, latitude longitude details of the hospital etc
Data sets in our project sheet2 using which we provided the information like contact number, latitude, longitude, area, specialist in our map
View of the map, in which we display filters like area, contact number, hospital name, and latitude, and longitude, name of the doctor, qualification, specialist, and these filters can be used to display the data.
V. CONCLUSION
We are able to successfully created an interactive graphs and charts in the form of dashboards and worksheets which helped people to understand in an most effective way. We made it possible with gestures as simple as drag and drop. It helped the people to know in detail about the diseases and its symptoms[6], first-aid and safety measures are also provided so that they can be medicated easily within the reach of the people .If there is any serious issue or drastic symptoms of the diseases the eminent expertise doctors for the particular diseases in the city with their details plotted in a map view so that the patient can concern a doctor.
VI. REFERENCES
[1] www.mindmajix.com.
[2]
[3] Tableau for Beginners – Data Visualisation made easy from www.analyticsvidya.com
[5] Packtz, Learning Tableau 10, 4th edition, Joshua Milligan,2017
[6] Keet ,Tableau for health care, Corporate renianssance group, 2015.
AUTHORS PROFILE
K.Varsha, presently studying in the Department of Information Technology branch in P.V.P Siddhartha Institute of Technology, Vijayawada, affiliated to Jawaharlal Nehru Technological University. She has given seminar on Apache Hadoop and Palm vein technology. She has attended workshop/seminars on IOT, Cyber security, Python. She is currently working on the mini project Library management system. Her current research interests are Tableau, Big data.
B.Teepthika, presently studying in the Department of Information Technology branch in P.V.P Siddhartha Institute of Technology, Vijayawada, affiliated to Jawaharlal Nehru Technological University. She has given seminar on Blue jacking and Skinput technology. She has attended workshop/seminars onPython, IOT,Cyber security. She is currently working on the mini project Automation of monthly report. Her current research interests are Tableau,Search Engine and its Optimization.
K.Vinay, presently studying in the Department of Information Technology branch in P.V.P Siddhartha Institute of Technology, Vijayawada, affiliated to Jawaharlal Nehru Technological University. He has given seminar on Big data analytics. He has attended workshop/seminars on Python IOT,Cyber security. He is currently working on the mini project Smart appointment in hospitals. His current research interests are Tableau,IOT.
Dr. B.V.Subba Rao, presently working as Professor and Head of the Department of Information Technology branch in P.V.P Siddhartha Institute of Technology, Vijayawada, affiliated to Jawaharlal Nehru Technological University. He has a total of 15 years of rich experience comprising teaching, research and industry. He has published 34 papers in International Journals and 8 papers in national Journals and