A Method to Determine External Horizontal
Overhang Projection Considering the Window
Solar Angle Properties in Hot and Humid Climate
Dilshan Remaz Ossen
Department of Architecture, Faculty of Built Environment, Universiti Teknologi Malaysia, 81310 Skudai, Johor, Malaysia
ABSTRACT: A method to determine the optimum overhang projection ratio using
total solar energy transmittance (G value) of a window system is presented. The method consists in determining the ideal hourly G value of the window and transmitted heat gains on main cardinal orientations; east, west, north and south. These G-values were utilized to determine the solar radiation intensities for the respective hours of the day. The results were based on the solar radiation data obtained from Subang Meteorological Station, Subang Malaysia, for the year 2001. The results showed that comparison between the window properties and the amount of solar energy transmitted, enable to predict more realistic shading hypothesis than shading device calculations based on incident angle only. The above results suggested optimum overhang ratio of 1.6 (~1.59) for east orientation, overhang ratio between 1.90 and 2.04 for west orientation, overhang ratio between 0.8 and 0.7 for north orientation and between 0.6-0.5 for south orientation. An important benefit of this method is that it gives a series of options of different shading strategies internal or external, to decide based on window systems G-cos value (or solar heat gain coefficient-SHGC) for different orientations.
Keywords: solar radiation, total solar energy transmittance, incident angle
Introduction
The phenomenon of g-value was deployed by Dubois (2000) and Kuhn et.al (2000) as a reference to determine effectiveness of the shading devices. Dubois (2000) developed a method using the g-values of the window glass to determine the shading depth for temperate climate condition and for latitude 590 north. The analysis was tested only for south and west orientations. The developed chart was based on Mazria’s solar path projection.
Objective
The main objective of this study is to determine shading device geometry using incidence angle and direct beam solar radiation transmittance for east, west, north and south orientations under tropical climate conditions. A normal 3mm thick single pane glass is being used as the reference glazing.
Definition
G-Value as a measure of solar gain
The total solar energy transmittance (g-value) specifies the total fraction of incident solar energy that is transmitted through the fenestration system. The fenestration system implies both the shading device and the window system.
The g-value can be expressed (Dubois, 2000):
Gsys = Total Solar Energy Transmittance (1)
Incidence Solar Radiation on the facade
Gsys = Qsun (2)
IG* Aw
However, the diffuse component should also be considered when the shading device is mainly used for glare control.
Method
The incident angle
Intensity of direct solar radiation on any surface for a given atmospheric condition can be determined from the value of intensity of direct normal radiation. If Ibv denotes the direct solar intensity on a given window surface and the angle between normal to the surface and solar beam is (θ), then Ii is given by;
Ibv = Idn x Cos (θ ) (3)
Idn is the intensity of the direct normal radiation. Assuming for a given incident angle of (θ), the relationship between Ibv and Idn is a constant (Kθ). Thus, it can be expressed as;
Cos (θ) = Ibv / Idn = Kθ (4)
The window g-value
The solar heat transmission through a glazing is higher when the solar radiation incident perpendicular on the glazing surface. The energy received by the surface decreases when the solar beam moves away from the window normal. The window g-value indicates which portion of the incident solar radiation is transmitted and absorbed by the window and become heat in building.
0 0.1 0.2 0.3 0.4 0.5 0.6 0.7 0.8 0.9 1
0° 10° 20° 30° 40° 50° 60° 70° 80° 90°
Angle of Incidence
So
lar
Tr
an
sm
it
tance
Solar transmittance Visible transmittance Solar absorptance
Figure1: The solar transmittance (g-value), visible transmittance and solar absorptance for single clear glass window as a function of the angle of incidence
Figure 2: Instantaneous heat balances through sunlit glazing material
Transmission (τ) and absorptance (α) coefficients were determined for direct and diffuse solar radiation as follows:
Hourly solar heat gain on a vertical window surface, Qsolv (W/m2) is given by:
Since only direct solar radiation is considered, Direct Radiation:
Qsol, b = Ibv (τbNiαb) (6)
Where,
gb = (τbNiαb) (7)
τ = C1 + C2Cos (θ) + C3Cos2 (θ) + C4Cos3 (θ) + C5Cos4 (θ) + C6Cos5 (θ) (8)
And
α= A1 + A2Cos (θ) + A3Cos2 (θ) + A4Cos3 (θ) + A5Cos4 (θ) + A6Cos5 (θ) (9)
For diffuse radiation, Stephenson calculated τdif and αdif to be 0.799 and 0.0544 respectively. Values of the constants C1, C2, C3, C4, C5 & C6 and A1, A2, A3, A4, A5 & A6 depends on the glass type and the number of panes. Referred values were obtained from the DOE 2.2 Engineering manual.
The inward flowing fraction Ni of the absorbed radiation can be expressed as:
Ni = hi / (hi + ho) (10)
Where hi and ho are the heat transfer coefficients of the inside and out side glazing surfaces respectively, given in W/m2 K. Inward flowing fraction for single glazing is 0.268, reference to ASHRAE fundamentals, (1993). This value is used for present calculations.
Hence, the secondary heat transmission from the absorbed solar radiation can be given as:
Based on the above theoretical assumptions hourly values were derived from the simulation. Then correspondent g-values were determined for each set of solar altitude (β) and azimuth (φ) angles using the fundamental solar geometrical relationship. However g-values for direct solar radiation is taken into consideration as the diffuse component of radiations are independent of the sun position.
Cos (θ ) = Cos (β)* Cos (φ −ψ) (12)
Where (ψ), is the orientation of the façade from the same reference direction as the solar azimuth. If the sun is behind the façade (φ −ψ) >90 or negative (-) value is indicated.
The gθ − values obtain from the above method is the g-value for the reference
window. By normalizing the gθ values with g0 base value, (which is the maximum transmittance for any given angle, means when the angle of incidence is zero) and the new g value can be plotted according to the solar projection and super impose on a solar path diagram.
G = gθ / g0 (13)
The nomenclature for G is represented by ‘g-value’, which implies the fraction of incidence direct solar radiation (Ibv) transmitted into the interior through the corresponding glass window. The plotted normalized g value is represented by a concentric circle. The inner most circle encompasses the solar position for the g>0.9 value, the second innermost circle for g>0.8 and the third g>0.7 so on. Hence, g>0.7 value implies that 70% of solar radiation from g0 value is transmitted into the interior through the window pane.
GCos-value
G(x) Cos(x) = {g (x)} X {K (x)} (14)
The GCos-value thus specifies the fraction of direct normal solar radiation (Idn) that is transmitted in to the building through the window opening. The calculated GCos values using Subang Jaya Meteorological data for east, west, north and south orientations were shown in the following tables (Appendix 1: a, b, c & d). For East and West orientations values were obtain on all twelve months. North orientation data were tabulated for April, May, June, July and August as the direct solar radiation falls on this façade only during these months. South orientation data were collected during the months of January, February, March, September, October, November and December. One day is selected for each month to understand the correlation between each parameter described in above steps. These dates were assumed to be the maximum solar radiation received for respective months. However, for further analysis, months with highest GCos values, maximum incident and transmitted values were selected.
The obtained G(x)Cos(x) values were normalized with G(0)Cos(0)base value, (which is the maximum value for any given angle, when the angle of incidence is zero) and the new GCos- value can be plotted according to the solar projection and super impose on a solar path diagram as for g-value in step two. Similar to g-value, each GCos value encompasses solar position at given altitude and azimuth angle. E.g. Maximum values of GCos>0.9 delimits the inner most circle, GCos>0.8 next inner most circle and GCos>0.7 third inner circle so forth.
Direct Solar Gain
The intensity of the solar radiation varies throughout the day and the year depending on the location and the atmospheric conditions. The intensity direct solar radiation (Ibv) can be calculated on any surface for given atmospheric conditions using equation, (Eq. 3). Hence, total solar gain due to direct solar radiation can be obtained by;
Qsol = Idn. GCos. A (15)
The values of Qsol is calculated using solar radiation data obtained from Subang
Meteorological Station, in Kuala Lumpur and compared with window GCos-values for the main cardinal orientations, (Appendix 1: Table a, b, c, d).
Discussion of Results
The shading depth depends on the required period of the day, where the solar transmission is high. Assuming the building is occupied from 09:00 AM-17:00PM and this period can be accepted as the maximum shading is required. Since the working period is asymmetrical with respect to solar path, critical hours of solar radiation transmission for each orientation differed. The lowest horizontal shadow angle (HSA -2.30) is selected from all cardinal orientations to determine the shading length. Depth
of the device is given as a proportion to the window height, (1.82 meter or 6 feet). This dimensionless ratio; external horizontal shading depth to window glazing height, is defined as ‘overhang ratio’ (OHR).
The following procedure was used to determine the overhang ratio or the projection factor:
1. Determine the critical overheating period of the day, depending on the orientation of the fenestration. E.g. east 9:00- 12:00 hours, west 13:00- 17:00 hours, north and south between 9:00 AM and 17.00 PM hours.
2. From the tables (Appendix 1: a, b, c & d) maximum G-Cos values were identified for respective orientations.
3. Compare the solar radiation intensities obtain for the respective G-Cos values at (2).
4. Select the highest solar intensity and the correspondence G-Cos value and the correspondence overhang ratio.
1. East and West Orientation
Window angle dependent g-values and GCos-values are high (>0.9) for east orientation in the morning hours with lowest solar altitude angles and gradually decreased when sun reaches toward noon position. This implies that between 8:00 and 9:00 hours in the morning, most of the incident radiation transmits through the fenestration system (more than 90%). However, solar gain due to direct solar radiation incidence on the vertical surface is low between 8:00 and 9:00 hours compared to higher solar altitude. Vise-versa, although there is high intensity of global solar radiation (> 600 W/m2) around noon the fraction of radiation transmitted
is lower (less than 40%) than at low solar altitude solar positions. Among all the months, January, February and March (table 1) indicated a high g-value (>0.9) and GCos (>0.8) values for east orientation. This implies that over 90% of g0-value was transmitted into the building. Also, it could be stated as 10% of solar radiation transmittance was reduced from g0-value for that respective solar altitude and azimuth angles. Correspondence overhang ratios for all three days were indicated as 1.74, 1.72 & 1.59 for January, February and March respectively. But the direct solar gain is high on March 21st, compared to January and February. This indicates that
only overhang ratio of 1.59 is required to terminate maximum amount of direct solar radiation impinging on the east façade compared to overhang ratios at other low solar altitude angles. This is about 8% reduction compared to the overhang ratio at lowest solar altitude (1.74). Therefore, it can be assumed that an external horizontal shading device with an overhang ratio 1.6 (~1.59) as optimum depth for east facing fenestration. The lowest overhang ratio of less than 0.2 were reported on April, May, June, August, September, October, November and December at 12.00 noon, for east facing fenestration. The overhang ratios for fenestration on east façade range from 0.13 to 1.74 during critical hours (9:00-12:00).
between 2.04 and 1.90 is sufficient to eliminate maximum amount of direct solar radiation incident on the west façade during the critical hour (17:00) of the overheated period. The overhang ratio range varies from >0.1 to >2.53 for west orientation.
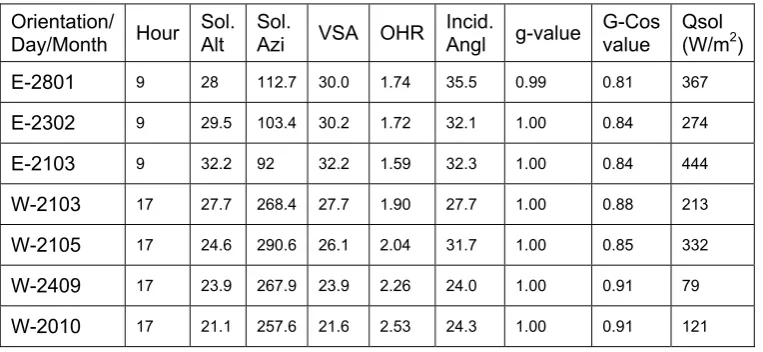
Table 1: Summary of maximum g-value and GCos-value obtain for East and West orientations.
Orientation/
Day/Month Hour Sol. Alt Sol. Azi VSA OHR Incid.Angl g-value G-Cos value Qsol (W/m2)
E-2801 9 28 112.7 30.0 1.74 35.5 0.99 0.81 367
E-2302 9 29.5 103.4 30.2 1.72 32.1 1.00 0.84 274
E-2103 9 32.2 92 32.2 1.59 32.3 1.00 0.84 444
W-2103 17 27.7 268.4 27.7 1.90 27.7 1.00 0.88 213
W-2105 17 24.6 290.6 26.1 2.04 31.7 1.00 0.85 332
W-2409 17 23.9 267.9 23.9 2.26 24.0 1.00 0.91 79
W-2010 17 21.1 257.6 21.6 2.53 24.3 1.00 0.91 121
This implies that considering the glass solar radiation transmittance or the g-value, GCos-value and the solar gain due to direct solar radiation incident on the glazing are important factor in determining the solar shading depth.
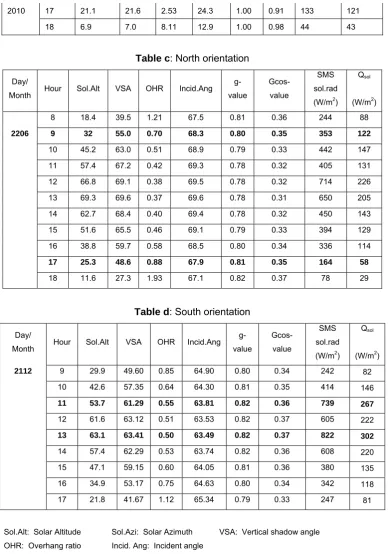
2. North and South Orientation
implies that the solar radiation transmittance is symmetrical during the maximum shading period.
Direct solar gain through south window were obtained on January, February, March, September, October, November and December. Among these months November, December and January obtained a high g-value (>0.8) and GCos-values (>0.3) than other months. As in north orientation, GCos-value is never exceeding 0.4. Thus orientation of the window itself reduces the intensity of the incident radiation by 60% during the months where the impact of solar radiation is maximum. Month of December indicated a highest g and Gcos values for south orientation and values remain constant (g>0.8, GCos>0.34) throughout the required shading period. Note that during the month of June and December the sun position is in the north solstice and south solstice respectively.
Projection factor differs from a minimum >0.1 to a maximum >0.8 for north orientation, while range for south orientation is >0.2 to >1.2. But as for the north and south orientation maximum g-value and Gcos values and their corresponding overhang ratios were shown in table 2. According to table 2, best options of overhang ratios for north and south are respectively 0.8>OHR>0.7 and 0.6>OHR>0.5.
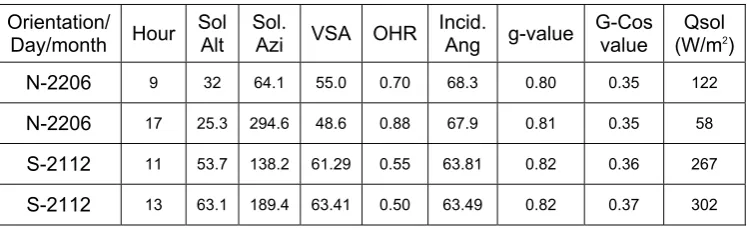
Table 2: Summary of maximum g-value and G-Cos value obtain for North and South
orientations.
Orientation/
Day/month Hour Sol Alt Sol. Azi VSA OHR Incid.Ang g-value G-Cos value (W/mQsol 2) N-2206 9 32 64.1 55.0 0.70 68.3 0.80 0.35 122
N-2206 17 25.3 294.6 48.6 0.88 67.9 0.81 0.35 58
S-2112 11 53.7 138.2 61.29 0.55 63.81 0.82 0.36 267
S-2112 13 63.1 189.4 63.41 0.50 63.49 0.82 0.37 302
Conclusion
meaningful hypothesis about the external overhang depths. Comparison between the window properties and the amount of solar energy transmitted, enable to predict more realistic shading hypothesis than shading device calculations based on incident angle only. It can be argued that, the obtained values can be defined as optimum geometry of a shading device, compared to the direct solar radiation transmittance.
The above results suggested optimum overhang ratio of 1.6 (~1.59) for east orientation, overhang ratio between 1.90 and 2.04 for west orientation, overhang ratio between 0.8 and 0.7 for north orientation and between 0.6-0.5 for south orientation. These optimum values were obtained for the building occupied period that is from 9:00 am in the morning to 17:00 pm in the evening.
A design method to define the optimum solar shading geometry was presented. Compared to shading mask method to define shading geometry, this method provide additional information on intensity of solar radiation, window solar angle dependent property and the geometrical relationship to the direct solar radiation. These additional information assists to determine the critical overheated periods affecting on a building façade at a given location and orientation. However, energy simulations need to be carried out to justify the shading hypothesis obtained from this experiment.
Another benefit of this method is that it gives a series of options of different shading strategies internal or external, to decide based on shading device gcos-value (or solar heat gain coefficient-SHGC) for different orientations. For example, a shading device (internal or external) with gcos-value with 0.4>gcos>0.3 on south window can be used to get maximum protection from solar heat gains.
obtained for horizontal surface. Data obtained on vertical surface will provide more accurate results on overheating period and on shading geometry.
Reference
ASHRAE (1993) ASHRAE Fundamentals Handbook (SI), American Society of Heating, Refrigerating and Air-conditioning Engineers, Inc. Atlanta
Dubois, Marie- Claude (2000) "A Method to define shading devices considering the ideal total solar energy transmittance". Eurosun 2000 conference, June 19-22, Copenhagen, Denmark.
Kuhun, Tilmann E; Bühler, Christopher and Platzer, Werner J (2000) "Evaluation of overheating protection with sun-shading systems". Solar Energy,69(1-6): 59-74.
Appendix 1:
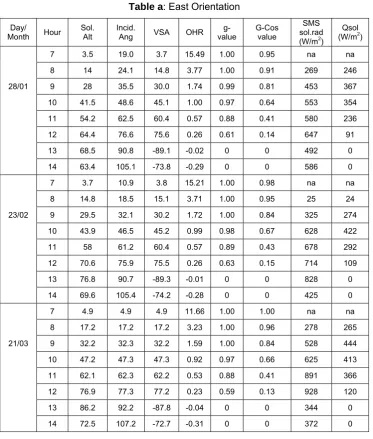
Table a: East Orientation
Day/
Month Hour
Sol. Alt
Incid.
Ang VSA OHR
g-value
G-Cos value
SMS sol.rad
(W/m2)
Qsol
(W/m2)
7 3.5 19.0 3.7 15.49 1.00 0.95 na na
8 14 24.1 14.8 3.77 1.00 0.91 269 246
28/01 9 28 35.5 30.0 1.74 0.99 0.81 453 367
10 41.5 48.6 45.1 1.00 0.97 0.64 553 354
11 54.2 62.5 60.4 0.57 0.88 0.41 580 236
12 64.4 76.6 75.6 0.26 0.61 0.14 647 91
13 68.5 90.8 -89.1 -0.02 0 0 492 0
14 63.4 105.1 -73.8 -0.29 0 0 586 0
7 3.7 10.9 3.8 15.21 1.00 0.98 na na
8 14.8 18.5 15.1 3.71 1.00 0.95 25 24
23/02 9 29.5 32.1 30.2 1.72 1.00 0.84 325 274
10 43.9 46.5 45.2 0.99 0.98 0.67 628 422
11 58 61.2 60.4 0.57 0.89 0.43 678 292
12 70.6 75.9 75.5 0.26 0.63 0.15 714 109
13 76.8 90.7 -89.3 -0.01 0 0 828 0
14 69.6 105.4 -74.2 -0.28 0 0 425 0
7 4.9 4.9 4.9 11.66 1.00 1.00 na na
8 17.2 17.2 17.2 3.23 1.00 0.96 278 265
21/03 9 32.2 32.3 32.2 1.59 1.00 0.84 528 444
10 47.2 47.3 47.3 0.92 0.97 0.66 625 413
11 62.1 62.3 62.2 0.53 0.88 0.41 891 366
12 76.9 77.3 77.2 0.23 0.59 0.13 928 120
13 86.2 92.2 -87.8 -0.04 0 0 344 0
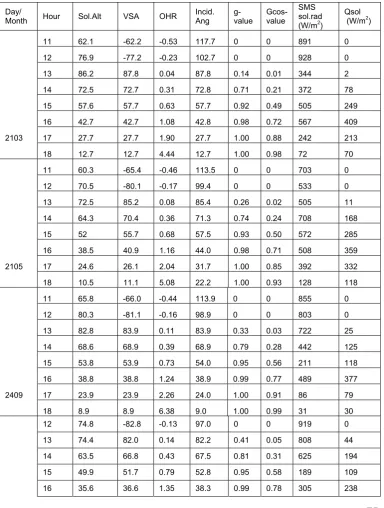
Table b: West Orientation
Day/
Month Hour Sol.Alt VSA OHR
Incid. Ang g-value Gcos-value SMS sol.rad
(W/m2)
Qsol
(W/m2)
11 62.1 -62.2 -0.53 117.7 0 0 891 0
12 76.9 -77.2 -0.23 102.7 0 0 928 0
13 86.2 87.8 0.04 87.8 0.14 0.01 344 2
14 72.5 72.7 0.31 72.8 0.71 0.21 372 78
15 57.6 57.7 0.63 57.7 0.92 0.49 505 249
16 42.7 42.7 1.08 42.8 0.98 0.72 567 409
2103 17 27.7 27.7 1.90 27.7 1.00 0.88 242 213
18 12.7 12.7 4.44 12.7 1.00 0.98 72 70
11 60.3 -65.4 -0.46 113.5 0 0 703 0
12 70.5 -80.1 -0.17 99.4 0 0 533 0
13 72.5 85.2 0.08 85.4 0.26 0.02 505 11
14 64.3 70.4 0.36 71.3 0.74 0.24 708 168
15 52 55.7 0.68 57.5 0.93 0.50 572 285
16 38.5 40.9 1.16 44.0 0.98 0.71 508 359
2105 17 24.6 26.1 2.04 31.7 1.00 0.85 392 332
18 10.5 11.1 5.08 22.2 1.00 0.93 128 118
11 65.8 -66.0 -0.44 113.9 0 0 855 0
12 80.3 -81.1 -0.16 98.9 0 0 803 0
13 82.8 83.9 0.11 83.9 0.33 0.03 722 25
14 68.6 68.9 0.39 68.9 0.79 0.28 442 125
15 53.8 53.9 0.73 54.0 0.95 0.56 211 118
16 38.8 38.8 1.24 38.9 0.99 0.77 489 377
2409 17 23.9 23.9 2.26 24.0 1.00 0.91 86 79
18 8.9 8.9 6.38 9.0 1.00 0.99 31 30
12 74.8 -82.8 -0.13 97.0 0 0 919 0
13 74.4 82.0 0.14 82.2 0.41 0.05 808 44
14 63.5 66.8 0.43 67.5 0.81 0.31 625 194
15 49.9 51.7 0.79 52.8 0.95 0.58 189 109
2010 17 21.1 21.6 2.53 24.3 1.00 0.91 133 121
18 6.9 7.0 8.11 12.9 1.00 0.98 44 43
Table c: North orientation
Day/
Month Hour Sol.Alt VSA OHR Incid.Ang
g-value Gcos-value SMS sol.rad
(W/m2)
Qsol
(W/m2)
8 18.4 39.5 1.21 67.5 0.81 0.36 244 88
2206 9 32 55.0 0.70 68.3 0.80 0.35 353 122
10 45.2 63.0 0.51 68.9 0.79 0.33 442 147
11 57.4 67.2 0.42 69.3 0.78 0.32 405 131
12 66.8 69.1 0.38 69.5 0.78 0.32 714 226
13 69.3 69.6 0.37 69.6 0.78 0.31 650 205
14 62.7 68.4 0.40 69.4 0.78 0.32 450 143
15 51.6 65.5 0.46 69.1 0.79 0.33 394 129
16 38.8 59.7 0.58 68.5 0.80 0.34 336 114
17 25.3 48.6 0.88 67.9 0.81 0.35 164 58
18 11.6 27.3 1.93 67.1 0.82 0.37 78 29
Table d: South orientation
Day/
Month Hour Sol.Alt VSA OHR Incid.Ang
g-value Gcos-value SMS sol.rad
(W/m2)
Qsol
(W/m2)
2112 9 29.9 49.60 0.85 64.90 0.80 0.34 242 82
10 42.6 57.35 0.64 64.30 0.81 0.35 414 146
11 53.7 61.29 0.55 63.81 0.82 0.36 739 267
12 61.6 63.12 0.51 63.53 0.82 0.37 605 222
13 63.1 63.41 0.50 63.49 0.82 0.37 822 302
14 57.4 62.29 0.53 63.74 0.82 0.36 608 220
15 47.1 59.15 0.60 64.05 0.81 0.36 380 135
16 34.9 53.17 0.75 64.63 0.80 0.34 342 118
17 21.8 41.67 1.12 65.34 0.79 0.33 247 81
Sol.Alt: Solar Altitude Sol.Azi: Solar Azimuth VSA: Vertical shadow angle
OHR: Overhang ratio Incid. Ang: Incident angle