ABSTRACT
HOWARD, AMANDA KELLY. Influence of instream physical habitat and water quality on the survival and occurrence of the endangered Cape Fear shiner. (Under the direction of Thomas J. Kwak and W. Gregory Cope)
The Cape Fear shiner Notropis mekistocholas is a recently described cyprinid fish endemic to the Cape Fear River Basin of North Carolina. Only five declining populations of the fish remain, and therefore, it has been listed as endangered by the U.S. Government. Determining habitat requirements of the Cape Fear shiner, including physical habitat and water quality, is critical to the species’ survival and future restoration. This study integrated the sciences of toxicology and conservation biology, and simultaneously assessed ecosystem-level influences of habitat (water and physical environments) on survival, growth,
Cape Fear shiners most frequently occupied riffles and velocity breaks (i.e., areas of swift water adjacent to slow water), moderate depths, and gravel substrates. They used habitat non-randomly with respect to available habitat, and habitat use was similar between post-spawning and spawning seasons. However, Cape Fear shiners shifted to shallower depths during the spawning season, suggesting that adequate depth distribution may be an important element of Cape Fear shiner habitat. Comparisons of suitable microhabitat among river reaches where the Cape Fear shiner is extant, rare, or extirpated suggest that suitable substrate (gravel) may be lacking where the fish is rare, and that suitable microhabitat
combinations, especially for water velocity, are rare at all sites. Cape Fear shiner density was too low to be estimated in upstream reaches of the Deep River where gravel substrate is limited. Population density ranged from 795 fish/ha to 1,393 fish/ha at three sites surveyed. Potential reintroduction sites had shallower mean depths than those at extant sites, and the extirpated site on the Rocky River contained the most suitable physical habitat, but lacked adequate water quality. A site on the Deep River where the species persists, but is rare, is a candidate reach for habitat restoration, but would require substrate alteration to improve conditions for the Cape Fear shiner.
over the test duration. Results from the in situ exposures indicate that a reintroduction site on the Rocky River does not have adequate water quality to support reintroduction, yet results from the instream habitat assessment indicate that physical habitat is similar to extant Cape Fear shiner locations.
INFLUENCE OF INSTREAM PHYSICAL HABITAT
AND WATER QUALITY ON THE SURVIVAL AND OCCURRENCE
OF THE ENDANGERED CAPE FEAR SHINER
By
AMANDA KELLY HOWARD
A thesis submitted to the graduate faculty of North Carolina State University
in partial fulfillment of the requirements for the Degree of
Master of Science
ZOOLOGY
Raleigh
2003
APPROVED BY:
Dr. Thomas J. Kwak, Co-chair of Dr. W. Gregory Cope, Co-chair of
Advisory Committee Advisory Committee
BIOGRAPHY
Amanda Kelly Howard (she prefers Mandy, always has) was born in Tucson,
Arizona, on 29 April 1976 to Carl and Carol Howard, both of southern origins. A few
months after her birth, they packed her up and moved back to Alabama, to the town of
Moody, where her maternal great-grandfather had been the first mayor. She graduated from
Moody High School in 1994 and entered Auburn University that fall to study marine biology.
At the time, she had no idea what “marine biology” meant, but she knew it wasn’t business
or finance, and that it probably had to do with science and nature, which she loved.
The turning point in her scientific direction came when she took an ichthyology class
from Dr. Carol Johnston in the winter of 1998, and was completely amazed by the diversity
of fishes in those small Alabama streams. Her interest in fishes continued to grow while she
volunteered and worked with Dr. Johnston in the ichthyology lab.
After graduating from Auburn in March 1999, she began work as a technician for the
Alabama Cooperative Fish and Wildlife Research Unit. Looking to broaden her horizons and
fulfill a lifelong dream of working in the Florida Everglades, she moved to Miami in August
1999 to work as a research technician at Florida International University. While there, she
drove airboats, conducted experimental research in Everglades National Park, and made
some terrific friends. But, she really missed the streams and fishes of the southeast and
decided to return to the south (the real south, not south Florida) to pursue a Master’s degree
at North Carolina State University in 2000. The content of this thesis dominated the
ACKNOWLEDGMENTS
First, I would like to thank Tom Kwak and Greg Cope for initiating this research and
for giving me the opportunity to study under their tutelage. Ken Pollock gave helpful
insights and suggestions about how to estimate the population sizes of a rare minnow. His
statistical guidance improved much of this thesis. This research was funded by grants from
the U.S. Geological Survey, State Partnership Program and the U.S. Fish and Wildlife
Service.
I am grateful to many state and federal agency staff that provided information and
guidance throughout the duration of this project. Tom Augspurger of the U.S. Fish and
Wildlife Service in Raleigh, North Carolina, was instrumental in the initiation of research on
the Cape Fear shiner and has given his valuable insight to this project. Discussions during
the planning stages with John Fridell and David Rabon of the U.S. Fish and Wildlife Service,
John Alderman and Judy Ratcliffe of the North Carolina Wildlife Resources Commission,
Matt Matthews and Larry Ausley of the North Carolina Department of Environment and
Natural Resources, Division of Water Quality, and Damian Shea of North Carolina State
University, also facilitated the project.
Drew Dutterer, Nick Jeffers, Ed Malindzak, Ryan Speckman, and Stephen Wilkes
assisted with data collection under harsh field conditions. Peter Lazaro helped with the water
quality analyses and also provided field assistance. A special thanks goes to Bill Pine and
Dave Hewitt for friendly support whenever I needed it and for dealing with me on a daily
basis.
The constant support of my parents has been a blessing all my life, and I am sincerely
State has been enhanced by the wonderful friendships I’ve formed with other graduate
students, and by meeting my future husband, Dave Hewitt.
Lastly, I would like to thank Dr. Carol Johnston for introducing me to the underwater
world and for instilling in me a deep respect for the scientific process. Without her
TABLE OF CONTENTS
Page
LIST OF TABLES vii
LIST OF FIGURES ix
Chapter 1: Influence of Instream Physical Habitat on the Survival and Occurrence 1 of the Endangered Cape Fear Shiner Introduction 2
Objectives 5 Methods 6
Study area 6 Microhabitat use, availability, and suitability 7 Fish microhabitat use 7
Available microhabitat surveys 9 Statistical analyses on microhabitat use and availability 10
Microhabitat suitability 10
Cape Fear shiner population density 11
Results 12
Microhabitat use, availability, and suitability 12
Post-spawning season 12
Microhabitat comparison among extant, extirpated, and rare sites 17
Spawning season 19
Summary 24 Cape Fear shiner population density 25
General behavioral and feeding observations 25
Discussion 26
Microhabitat use, availability, and suitability 26
TABLE OF CONTENTS (continued)
Page
Ecological and management implications 33
References 38
Chapter 2: Influence of Water Quality and Associated Contaminants on the 69
Survival and Growth of the Cape Fear Shiner
Introduction 70
Methods 72
Study area 72
Bioassay design and fish deployment 74
Sample collection and processing 76
Sample preparation and analysis 77
Inorganics 77
Organics 78
Quality assurance 80
Inorganics 80
Organics 81
Statistical analyses 81
Results 82
Discussion 87
Comparison of contaminant availability among sites 88
Ecological and management implications 95
References 97
LIST OF TABLES
Page
Chapter 1
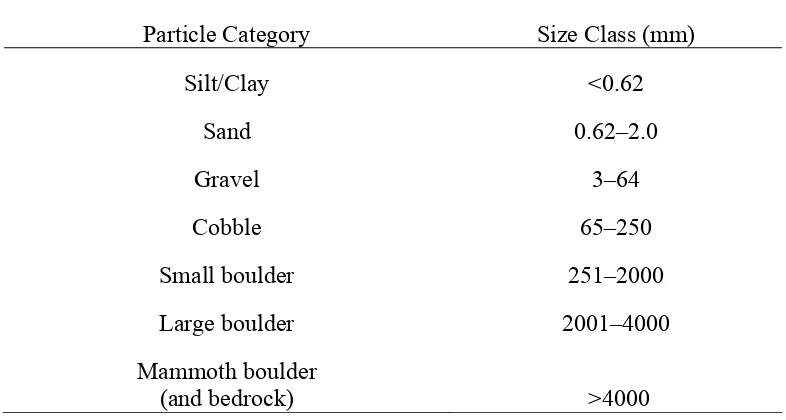
Table 1. Categories used to describe river substrate composition based 44 on a modified Wentworth particle size scale.
Table 2. Retained component loadings from principal components 45 analyses for the Rocky and Deep rivers during the post-spawning
(summer 2001) and spawning (spring 2002) seasons.
Table 3. Statistical comparisons of Cape Fear shiner microhabitat use 46 and habitat available for continuous (Kolmogorov-Smirnov two-sample tests) and categorical (chi-square test) variables in the Rocky and Deep rivers during post-spawning (summer 2001) and spawning (spring 2002). Sample sizes appear in Table 2.
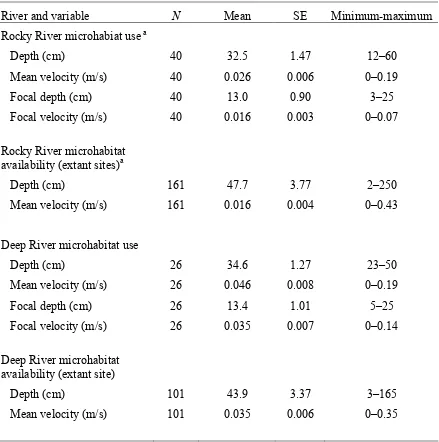
Table 4. Cape Fear shiner microhabitat use and availability statistics 47 for reaches of the Rocky and Deep rivers during the post-spawning
(summer 2001) season.
Table 5. Comparison of suitable microhabitat availability for the 48 Cape Fear shiner between reaches of the Rocky and Deep rivers during summer 2001 where the species is extant, rare, or extirpated.
Table 6. Cape Fear shiner microhabitat use and availability statistics 49 for reaches of the Rocky and Deep rivers during the spawning
(spring 2002) season.
Table 7. Cape Fear shiner population density estimates and associated 50 statistics from reaches in the Rocky and Deep rivers during the
post-spawning season (summer 2002). Site descriptions appear in Methods section. SD and Min-max are standard deviation and minimum and maximum values, respectively.
Chapter 2
LIST OF TABLES (continued)
Page Chapter 2 (continued)
Table 2. Summary of generalized hazard assessment for selected 105 inorganic and organic contaminants among sites during the 28-day in situ bioassay with Cape Fear shiners. For a given triangle, a darkened
compartment represents a measured concentration among the highest three for a given analyte at all sites; top = fish, middle = water, and bottom = sediment
Table 3. Measured concentrations in river water (µg/L) of common 106 contaminants at sites in Cape Fear shiner bioassay and the US EPA
freshwater chronic continuous criterion (FW CCC) for each contaminant. (< indicates that a sample was below the detection limit of the test)
Table 4. Measured concentrations in sediment of common contaminants 107 at sites in the Cape Fear shiner bioassay and the Canadian interim
freshwater sediment quality guidelines (ISQG). All concentrations are µg/g dry weight.
LIST OF FIGURES
Page
Chapter 1
Figure 1. Map indicating six primary sites on the Deep and Rocky rivers 51 selected for Cape Fear shiner instream physical habitat analyses and
population density estimates.
Figure 2. Plots of Cape Fear shiner microhabitat use and habitat available 52 component scores in the (a) Rocky River and (b) Deep River during
post-spawning (summer 2001). Principal component loadings and sample sizes appear in Table 2, and statistical comparisons appear in Table 3.
Figure 3. Frequency distributions of (a) depth and (b) mean column 53 velocity for Cape Fear shiner microhabitat use and availability in the
Rocky River during post-spawning (summer 2001). Use and availability distributions were compared using a Kolmogorov-Smirnov two sample test.
Figure 4. Frequency distributions of (a) substrate and (b) cover for Cape 54 Fear shiner microhabitat use and availability in the Rocky River during post-spawning (summer 2001). Use and availability distributions were compared using a Kolmogorov-Smirnov two sample test (substrate) or a Chi-square test (cover).
Figure 5. Frequency distributions of (a) depth and (b) mean column 55 velocity for Cape Fear shiner microhabitat use and availability in the
Deep River during post-spawning (summer 2001). Use and availability distributions were compared using a Kolmogorov-Smirnov two sample test.
Figure 6. Frequency distributions of (a) substrate and (b) cover for 56 Cape Fear shiner microhabitat use and availability in the Deep River
during post-spawning (summer 2001). Use and availability distributions were compared using a Kolmogorov-Smirnov two sample test (substrate) or a Chi-square test (cover).
LIST OF FIGURES (continued)
Page
Chapter 1 (continued)
Figure 8. Frequency distributions of Cape Fear shiner distance to cover 58 in the (a) Rocky River and (b) Deep River during the post-spawning
(summer 2001) and spawning (spring 2002) seasons. Post-spawning and spawning distributions were tested using a Kolmogorov-Smirnov two-sample test.
Figure 9. Cape Fear shiner microhabitat suitability for (a) depth and 59 (b) mean column velocity, based on combined data collected from the Rocky and Deep rivers during post-spawning (summer 2001).
Figure 10. Plots of Cape Fear shiner microhabitat suitability for 60 (a) substrate and (b) cover, based on combined data collected from the Rocky and Deep rivers during post-spawning (summer 2001).
Figure 11. Cape Fear shiner microhabitat use and habitat available 61 component scores in the (a) Rocky River and (b) Deep River during
spring 2002. Principal component loadings and sample sizes appear in Table 2, and statistical comparisons appear in Table 3.
Figure 12. Frequency distributions of (a) depth and (b) mean column 62 velocity for Cape Fear shiner microhabitat use and availability in the
Rocky River during spawning (spring 2002). Use and availability distributions were compared using a Kolmogorov-Smirnov two sample test.
Figure 13. Frequency distributions of (a) substrate and (b) cover for 63 Cape Fear shiner microhabitat use and availability in the Rocky River during spawning (spring 2002). Use and availability distributions
were compared using a Kolmogorov-Smirnov two sample test (substrate) or a Chi-square test (cover).
Figure 14. Frequency distributions of (a) depth and (b) mean column 64 velocity of Cape Fear shiner microhabitat use and availability in the Deep River during spawning (spring 2002). Use and availabilitydistributions were compared using a Kolmogorov-Smirnov two sample test.
Figure 15. Frequency distributions of (a) substrate and (b) cover of 65 Cape Fear shiner microhabitat use and availability in the Deep River
LIST OF FIGURES (continued)
Page Chapter 1 (continued)
Figure 16. Frequency distribution of (a) focal depth and (b) focal velocity 66 for Cape Fear shiner microhabitat use in the Rocky and Deep rivers during spawning (spring 2002).
Figure 17. Cape Fear shiner microhabitat suitability for (a) depth and 67 (b) mean column velocity, based on combined data collected from the Rocky and Deep rivers during spawning (spring 2002).
Figure 18. Cape Fear shiner microhabitat suitability for (a) substrate and 68 (b) cover, based on combined data collected from the Rocky and Deep rivers during spawning (spring 2002).
Chapter 2
Figure 1. Study sites used in the Cape Fear shiner 28-day in situ bioassay. 108
Figure 2. (a) Mean growth, (b) survival, and (c) lipid concentration of 109 Cape Fear shiners after the 28-day bioassy (Ctrl = baseline control sample on day 0 of the test) at sites in the Haw, Rocky, and Deep rivers of North Carolina. Sites accompanied by the same letter were not significantly different (P > 0.05). Error bars represent the standard error.
Figure 3. Mean concentration of cadmium (Cd) in (a) Cape Fear shiners, 110 (b) water, and (c) sediment from sites in the Haw, Rocky, and Deep rivers of North Carolina. For fish samples, Ctrl = concentrations in fish on day 0 of the 28-day test.
Figure 4. Mean concentration of copper (Cu) in (a) Cape Fear shiners, 111 (b) water, and (c) sediment from sites in the Haw, Rocky, and Deep rivers of North Carolina. For fish samples, Ctrl = concentrations in fish on day 0 of the 28-day test.
Figure 5. Mean concentration of mercury (Hg) in (a) Cape Fear shiners, 112 (b) water, and (c) sediment from sites in the Haw, Rocky, and Deep rivers of North Carolina. For fish samples, Ctrl = concentrations in fish on day 0 of the 28-day test.
LIST OF FIGURES (continued)
Page Chapter 2
Figure 7. Mean concentration of zinc (Zn) in (a) Cape Fear shiners, 114 (b) water, and (c) sediment from sites in the Haw, Rocky, and Deep rivers of North Carolina. For fish samples, Ctrl = concentrations in fish on day 0 of the 28-day test.
Figure 8. Mean concentration of polycyclic aromatic hydrocarbons 115 (PAHs) in (a) water and (b) sediment from sites in the Haw, Rocky, and Deep rivers of North Carolina.
Figure 9. Mean concentration of polychlorinated biphenyls (PCBs) 116 in (a) Cape Fear shiners, (b) water, and (c) sediment from sites in the
Haw, Rocky, and Deep rivers of North Carolina. For fish samples, Ctrl = concentrations in fish on day 0 of the 28-day test.
Figure 10. Mean concentration of chlordanes in (a) Cape Fear shiners, 117 (b) water, and (c) sediment from sites in the Haw, Rocky, and Deep rivers of North Carolina. For fish samples, Ctrl = concentrations in fish on day 0 of the 28-day test.
Figure 11. Mean concentration of DDTs in (a) Cape Fear shiners and 118 (b) water (not detected in sediment) from sites in the Haw, Rocky, and
Chapter 1
INFLUENCE OF INSTREAM PHYSICAL HABITAT ON THE
SURVIVAL AND OCCURRENCE OF THE
Introduction
Worldwide, hydrological alterations, such as dam construction and stream
channelization, and degraded water quality are producing global-scale negative effects on the environment (Rosenberg et al. 2000). Consequently, 50% of the species that are federally threatened or endangered in the United States are dependent upon life in water at some time in their life cycle (USFWS 2002). Freshwater fishes are the most diverse of all vertebrate groups, but they are also one of the most vulnerable due to ubiquitous degradation of aquatic ecosystems (Angermeier 1995; Warren et al. 2000; Duncan and Lockwood 2001).
The drainage basins of the southern United States contain the greatest diversity and number of endemic freshwater fishes in North America, north of Mexico, yet many
populations are declining; 28% (187 taxa) are recognized as extinct, endangered, threatened, or vulnerable to extinction (Burr and Mayden 1992; Warren et al. 1997, 2000). The growing imperilment of fishes and other aquatic faunas is predominantly due to human mediated changes within watersheds including construction of large and small impoundments, water withdrawals, urbanization and other land-use alterations, and environmental pollution (Moyle and Leidy 1992; Burkhead et al. 1997; Burkhead and Jelks 2001).
Habitat loss and increasing insularization of populations are factors that have been related to the extinction of species (Angermeier 1995). Cataclysmic loss of diversity via extinction is not the norm (Warren et al. 1997). Instead, regional extirpations generally precede extinction and indicate a population’s sensitivity to habitat degradation and
therefore, have a greater risk of extirpation and extinction (Warren and Burr 1994; Burkhead et al. 1997). Information relating to the ecology of rare native fishes, including habitat needs and natural history, is critical to help explain reasons for decline and to help improve
recovery efforts (Warren et al. 1997).
The Cape Fear shiner, Notropis mekistocholas (Cyprinidae), a federally endangered, restricted-range endemic of the Cape Fear River drainage, North Carolina, is among the Southeast’s declining fish species (USFWS 1987). This species is a relatively recent discovery, having first been collected in the early 1960’s by Snelson and later described by him (Snelson 1971). Since the time of its initial discovery, it has been extirpated from much of its historic range and is currently known from only five remaining populations in the Cape Fear River basin (Pottern and Huish 1985, 1986, 1987; NCWRC 1995, 1996).
Important elements of physical instream habitat that are necessary to support Cape Fear shiner populations are medium-sized rivers and streams with adequate flow and
(Pottern and Huish 1985). Pervasive and complex changes to the landscape have led to degraded water quality, habitat loss, and the fragmentation and isolation of Cape Fear shiner populations that we observe today. Prior to the initiation of this research, there was no quantitative information on the habitat ecology of the Cape Fear shiner.
The influence of dams is a critical detriment to the physical habitat of the Cape Fear shiner. The impact of dams and associated impoundments on aquatic ecosystems is
pervasive, and they harm instream physical habitat by altering flows and changing the biological and physical characteristics of river channels (Bednarek 2001); further, they disrupt metapopulation dynamics and prevent dispersal of individuals (Winston et al. 1991; Schrank et al. 2001). Construction of dams has greatly altered the Cape Fear River
ecosystem, fragmenting what was once a continuous Cape Fear shiner population into several remnant declining ones. Stream reaches that once provided continuous, highly suitable riffle–pool sequences and emersed aquatic vegetation were impounded to create unsuitable lentic surroundings and fragmenting remaining habitat patches.
Sediment transport is a natural part of the fluvial process (Waters 1995), but excessive sedimentation from soil erosion and agricultural runoff can threaten aquatic organisms (Pimentel et al. 1995). Sedimentation is the most widespread cause of stream impairment in the Cape Fear Basin (NCDWQ 1996). The Cape Fear shiner is vulnerable to excessive sedimentation, owing to its feeding habits utilizing benthic algae and spawning habitat over coarse substrate materials (Snelson 1971; Pottern and Huish 1985; personal observation).
information necessary to conserve and protect remaining habitats as well as to restore
habitats that have been degraded. It is my hope that this information will prove useful in the strategic planning and broad restoration efforts as laid out in the Cape Fear shiner recovery plan (USFWS 1988).
Objectives
Cape Fear shiner populations have steadily declined since the species’ discovery in 1962, and physical habitat degradation and poor water quality are likely causes. In Chapter 1, I focus on quantifying physical habitat suitability of the Cape Fear shiner and relate it to historical and extant locations in order to assess the habitat quality of potential reintroduction or population augmentation sites. This chapter complements Chapter 2 on water quality and toxicology of Cape Fear shiner habitat to improve our overall understanding of the fish’s ecology and assist federal and state resource management agencies in recovery and restoration of this endangered species.
Methods
Study area
The Cape Fear River rises in the north-central Piedmont region of North Carolina, near the cities of Greensboro and High Point and flows southeasterly to the Atlantic Ocean. It is one of only four basins located entirely within the state and is the largest among those, spanning a 15,000-km2 watershed and 9,735 km of freshwater streams and rivers. The basin supports approximately 22.1% of the state’s human population, including 116 municipalities and all or portions of 26 counties (NCDWQ 2000). Land use in the Cape Fear Basin is 26% agriculture, 59% forest, 6% urban, and 9% other uses (NCDWQ 1996). From 1982 to 1992 there was a 43% increase in the amount of developed land in the basin. The basin contains 54% of the state’s swine operations, and its swine populations increased 90% from 1994 to 1998 (NCDWQ 2000).
(1) Rocky River, 500 m upstream and 500 m downstream of U.S. Highway 15-501, Chatham County. Cape Fear shiner is extant; microhabitat use, availability data, summer 2001 and spring 2002; density estimate summer 2002.
(2) Rocky River, 200 m upstream of the confluence with the Deep River, Chatham County. Cape Fear shiner is extant; microhabitat use and availability data, summer 2001 and spring 2002.
(3) Rocky River, at the NC Highway 902 bridge crossing, Chatham County,. Cape Fear shiner is extirpated; microhabitat availability data only, summer 2001.
(4) Deep River, 100 m downstream of confluence with Rocky River, Chatham County. Cape Fear shiner is extant; density estimate summer 2002.
(5) Deep River, approximately 1 km downstream of Highfalls Dam, Moore County. Cape Fear shiner is extant; microhabitat use and availability data, summer 2001 and spring 2002; density estimate summer 2002.
(6) Deep River, downstream of Coleridge Dam, Randolph County. Cape Fear shiner is extant, but rare; microhabitat availability data only, summer 2001.
Microhabitat use, availability, and suitability
Fish microhabitat use. From 29 July 2001 to 5 October 2001 and from 29 April 2002 to 5 June 2002, Cape Fear shiners were observed, microhabitats were identified, and
Cape Fear shiners was observed, I dropped a colored weight to mark the precise location of the fish, and I immediately measured and recorded focal depth and focal velocity, which are defined as the distance between the fish’s snout and the substrate, and the velocity at the fish’s snout, respectively. For a group of Cape Fear shiners, I estimated the average focal depth and focal velocity of the group. Reaches were snorkeled in approximately 50-m sections. Distance to cover was also recorded at each Cape Fear shiner location. After thoroughly searching a section, we returned to each colored weight and measured physical habitat characteristics. Water depth, mean column velocity, focal velocity, focal depth, substrate composition, and associated physical cover were measured at 99 (2001) and 66 (2002) specific Cape Fear shiner locations (totals for three sites). General observations relating to feeding behavior were also recorded in 2001 and 2002. The spring 2002 microhabitat data were collected during the spawning period for this species. Although spawning related activities were observed, the data are meant to represent general
for my analysis. Associated physical cover categories were algae, American water-willow, other aquatic macrophytes, rock overhang, roots, terrestrial vegetation, and woody debris.
Available Microhabitat Surveys. During August through September 2001, coinciding with the post-spawning period in which the microhabitat use data were gathered, available microhabitat surveys were conducted at the three sites with extant Cape Fear shiner
populations (sites 1, 2, and 5) and at the two sites where the fish is rare or extirpated (sites 3 and 6). We utilized the transect and point-intercept method to quantify available
microhabitat under typical base-flow conditions (Simonson et al. 1994). At each site, we took 15 measurements of stream width to obtain a mean stream width (MSW), which we used to determine the appropriate length of the reach and distance between transects to be sampled. The location of the first transect was selected randomly, and a minimum of 10 equally-spaced transects were sampled within the reach. A minimum of 10, regularly spaced points were sampled along each transect; thus at least 100 points were sampled per reach. This is greater sampling intensity than that recommended by Simonson et al. (1994). Data collected at points sampled along each transect included all variables quantified for
microhabitat use.
Kolmogorov-Smirnov (K-S) two-sample test for depth, mean column velocity, and substrate, and a chi-square test on categorical cover data. All tests yielded P-values greater than 0.05.
Statistical analyses on microhabitat use and availability. Post-spawning (summer-fall 2001) and spawning (spring 2002) season microhabitat data were analyzed separately. I used principal components analysis (PCA) on habitat availability data for continuous variables (depth, mean column velocity, and substrate) to quantify habitat characteristics with fewer variables. Cover was omitted from this analysis. PCA was preformed separately for habitat availability data by river and period (spawning, post-spawning) for a total of four analyses. The PCA extracted linear combinations of the original variables that explained the maximum amount of variation in the data. Components with an eigenvalue near one (i.e., greater than 0.90) were retained (Stevens 2002). Microhabitat-use component scores were calculated from the scoring coefficients generated by the habitat-available PCA, stratified by river and period. Comparing microhabitat-use and availability component scores with a K-S two-sample test (Sokal and Rohlf 1981) tested for non-random habitat use. To determine which variables were responsible for component score differences, K-S two-sample tests were performed on univariate distributions of microhabitat use and availability for water depth, mean column velocity, and substrate composition. A chi-square test was performed on cover data to test for non-random cover use. All statistical analyses were performed using PC SAS v8.1 (1999-2000).
composition, and cover), according to river (Rocky River sites combined), and then results for each variable were standardized to a maximum of 1.0, with a value of 1.0 designating the most suitable range or categories, with suitability of other ranges or categories decreasing toward zero. To determine overall species suitability for each variable, suitability values for each range or category of a variable in the two rivers were summed, and those results were standardized to 1.0 again. This analysis was preformed separately for data from each period (spawning, post-spawning).
Cape Fear shiner population density
Cape Fear shiner population density was estimated using the strip transect method (Buckland et al. 2001), that is, snorkeling through a measured strip transect and visually counting all individuals in the transect. Populations were estimated at two sites in the Deep River and one in the Rocky River (sites 1, 4, and 5) during summer 2002. Surveying was also attempted at two other sites where the Cape Fear shiner is considered extant, just below the Coleridge Dam and at SR 1456 (Howard’s Mill Road), both in the Deep River. Only two individual Cape Fear shiners were observed at SR 1456 after intensive snorkeling, and no Cape Fear shiners were observed below the Coleridge Dam. Due to the low density of the Cape Fear shiner at these two sites, it was not possible to generate reasonable density estimates for either site.
reduce bias associated with the visual assessment of strip width, I used weights attached to flagging tape and a float to mark the boundary of the strip being sampled. Cape Fear shiners are often found in clusters. To account for this clumped distribution, I counted all fish in a cluster if more than 50% of the individuals were within the strip boundary, and conversely I did not count individuals in the cluster if more than 50% were outside the strip boundary (Buckland et al. 2001). The width and length of each transect, and the number of Cape Fear shiners in each was recorded to approximate Cape Fear shiner density (fish/hectare). Mean stream width was incorporated to calculate number of fish per linear kilometer of river. I generated mean Cape Fear shiner density for each site and associated confidence intervals among the 10 transects using standard statistical methods (Sokal and Rohlf 1981). These estimates represent minimum densities due to the possibility that individual fish in the strip were not detected.
Results
Microhabitat use, availability, and suitability
Post-spawning season. Available habitat in the Rocky River (sites 1 and 2) during the post-spawning season (summer 2001) was described by gradients from riffle to pool
(component 1) and from bank to thalweg (i.e., the swiftest, deepest part of the channel; component 2; Table 2). Two principal components explained a combined 77% of the
were deep, with lower velocities, and coarser substrate (i.e., boulder or bedrock), relative to riffles that were shallow with higher velocities and finer substrates (i.e., gravel or cobble). Component 2 (bank-thalweg) was interpreted as describing a gradient from near-bank to mid-channel areas, because it was positively loaded on substrate and mean velocity (Figure 2a). Near-bank areas in the Rocky River had fine substrates (i.e., silt and sand) and lower velocities, compared to mid-channel areas (thalweg) with higher velocities and coarse substrates.
Cape Fear shiners occupied microhabitats in the Rocky River during the post-spawning season that were most often associated with riffle habitat (Figure 2a). I found the Cape Fear shiner most frequently associated with moderate depths (40-49 cm), water velocity breaks (i.e., areas of swift water adjacent to slow water), cobble substrates, and emersed vegetation (American water-willow) (Figures 4-5), which are all characteristics associated with riffles. This result was supported by K-S two-sample comparisons between habitat available PCA scores and Cape Fear shiner microhabitat use scores, indicating that Cape Fear shiners occupied microhabitats in a non-random manner with respect to component 1 (riffle-pool) (P = 0.003; Table 3). Distributions of component 2 (bank-thalweg) scores of
microhabitat use and availability were not significantly different (P = 0.65; Table 3), indicating that the Cape Fear shiner used habitat in a random manner with respect to near-bank or mid-channel.
Figures 3-4), indicating non-random habitat use in the Rocky River by this species. Mean values of depth varied moderately between those for fish use and availability (37.5 cm versus 43.0 cm; Table 4), as did means of use and availability for mean velocity (0.037 m/s versus 0.031m/s). Cobble was the most frequently encountered substrate at Cape Fear shiner locations (Figure 4a). Cape Fear shiners were not associated with physical cover at a majority of microhabitat locations in the Rocky River, but among cover objects with which the Cape Fear shiner associated, American water-willow was the most common (Figure 4b).
Available post-spawning habitat in the Deep River (site 5) was described by gradients from bank to thalweg (component 1) and from pool to riffle (component 2; Table 2). Two principal components explained a combined 73% of the variance in the Deep River (Table 2). All three variables were significantly correlated with component 1, and depth and substrate were significantly correlated with component 2 (Table 2). Component 1 (bank-thalweg) was interpreted as describing areas from near-bank to the thalweg, because it was positively loaded on depth, mean velocity, and substrate (Figure 2b). Bank areas in the Deep River have fine substrates (i.e. silt and sand), relative to the thalweg which was deep, with the highest velocities, and coarse substrates (i.e. boulder or bedrock). Component 2 (pool-riffle) was interpreted as describing the gradient from pool to riffle because it was negatively loaded on depth and positively loaded on substrate (Figure 2b). Pools in the Deep River had finer substrates, such as silt and sand, as compared to pools in the Rocky, which had coarser substrates, and riffles in the Deep River had coarse substrates such as gravel, cobble, and boulders (Figure 2a and b).
were not associated with physical cover at a majority of locations, but when they associated with cover, it was most commonly American water-willow (Figure 6b). Their habitat use with respect to riffle-pool and bank-thalweg gradients was non-random as indicated by distributions of component 1 (P = 0.033) and component 2 (P = 0.022) scores for habitat availability and microhabitat use (Table 3). Univariate comparisons of the frequency distributions of available habitat and microhabitat use for depth and cover were also
significantly different (Figures 5a, 6b), and the use and availability means for depth differed moderately (41.2 cm versus 35.3 cm; Table 4), similar to those in the Rocky River.
However, mean velocity distributions were not significantly different in the Deep River (P = 0.25; Figure 3b) even though a substantial difference in mean values occurred (0.048 m/s versus 0.106 m/s; Table 4), and the comparison for substrate composition was marginally significant (P = 0.065; Figure 6a), suggesting that Cape Fear shiners occupied microhabitats randomly with respect to velocity and substrate in the Deep River. This result may be due to the greater proportion of finer substrates (i.e., gravel and cobble) and the range of mean velocities available in the Deep River. Because the range of depths occupied by the Cape Fear shiner in the Deep River was very narrow (30-60 cm; Figure 5a) and the frequency distributions are significantly different for depth (P = 0.001), the Cape Fear shiner is
selective for depth in the Deep River. This conclusion is further supported by the cluster of habitat use components scores, which correspond to moderate depths between riffles and pools and between the bank and thalweg (Figure 2b).
River was 10.4 cm and mean focal velocity was 0.022 m/s (Table 4). Cape Fear shiners were most frequently located at focal depths of 10–15 cm and focal velocities from 0-0.02 m/s in both rivers (Figure 7). Mean focal depth in both rivers is one-third or less than mean total depth, and this is expected for an epi-benthic species whose primary food source is detritus and plant material located on or in the substrate (Snelson 1971; personal communication, John Groves, North Carolina Zoological Park, Asheboro). Mean focal velocities were lower than mean column velocities of Cape Fear shiner locations in both rivers (Table 4).
Cape Fear shiners were more frequently located farther from cover in the Deep River than in the Rocky River during the post-spawning season. Cape Fear shiners were located within 25 cm of cover at 70% of locations in the Rocky River (Figure 8a). In contrast, only 24% of locations in the Deep River during the post-spawning season were within 25 cm of cover, and 66% of locations were greater than 50 cm from cover (Figure 8b). Cover was available in the Rocky and Deep Rivers at 45% and 52% of the availability points, respectively, with similar proportions of available American water-willow in both rivers (Figures 4b, 6b). American water-willow occupies areas with similar depths, velocity, and substrate, as does the Cape Fear shiner. Therefore, the more distance from cover of
microhabitat use locations in the Deep River may be explained by the greater availability of optimal substrates and velocities that were not associated with American water-willow beds. And conversely, available microhabitats that were most suitable for Cape Fear shiner and American water-willow were in shorter supply in the Rocky River, which may have lead to a closer association with American water-willow.
in some characteristics from those most frequently occupied by Cape Fear shiners. Most suitable microhabitats had similar depth, higher mean velocity, similar substrate, and a greater cover association with the aquatic macrophyte American water-willow (Figures 3–6 and 9–10). The most suitable Cape Fear shiner habitat, based on relative proportions of microhabitat use and availability from both rivers (three sites total) was 40–49 cm deep, with mean water velocity of 0.16–0.19 m/s, over gravel substrate, and associated with beds of American water-willow (Figures 9–10).
Microhabitat comparison among extant, extirpated, and rare sites. Comparisons of mean values of physical variables describing use and availability among river reaches where the Cape Fear shiner is extant, rare, or extirpated revealed shallower mean water depths at rare or extirpated sites, relative to those extant, and mean velocities that were similar among sites. Mean depth of the reach sampled in the Rocky River where the Cape Fear shiner has been extirpated (site 3) was 16 cm (37%) lower than that of two reaches where the Cape Fear shiner is extant (sites 1 and 2) and 10.5 cm (28%) lower than mean depth of microhabitats occupied by the fish in that river (Table 2). The same trend occurred in the Deep River where the mean depth of a reach where the Cape Fear shiner is extant, but rare (site 6) was 7.8 cm (22%) lower than that of a site where the fish is extant and common (site 5) and 13.7 cm (33%) lower than occupied microhabitats in that river (Table 4). Mean depths of
velocity of the Deep River reach where the fish is rare was lower than that of the extant reach, both were greater than that of occupied microhabitats (Table 4).
Comparing of proportions of suitable microhabitat available among river reaches where the Cape Fear shiner is extant, rare, or extirpated suggests that habitat similar to extant sites is available at rare or extirpated sites in both rivers, with the exception of a lack of suitable substrate at the rare site in the Deep River. In the Rocky River, the site where the fish is extirpated contained proportions of suitable microhabitats for depth (40–49 cm, 11.2% versus 12.4%), mean velocity (0.16–0.19 m/s, 0.7% versus 0.8%), substrate (gravel, 14.4% versus 11.6%), and cover (American water-willow, 23.9% versus 13.2%) that were
equivalent or exceeded those proportions of extant sites (Table 5). Similarly at Deep River sites, the proportion of suitable depth (40–49 cm, 17.8% versus 13.6%), mean velocity (0.16– 0.19 m/s, 4.1% versus 1.7%), and cover (American water-willow, 17.2% versus 9.3%) at the rare site exceeded those corresponding proportions at the extant site. Conversely, there was a much lower percentage of suitable substrate (gravel, 4.7% versus 26.3%) at the rare site versus the extant site of the Deep River (Table 5). The low proportion of gravel substrate available at the Deep River site where the Cape Fear shiner is rare (site 6) is not likely due to embeddedness by fine sediments (i.e., silt and sand), as only 5% of the substrate at the rare site was composed of fine sediment, while 32% of the substrate at the extant site (site 5) was fine particles.
suitable mean velocity at the extant site of the Rocky River to 26.3% for suitable substrate at the extant site on the Deep River (Table 5). Considering that suitable microhabitat for a fish species must provide the proper combination of suitable characteristics for depth, velocity, substrate, and cover, it is reasonable to conclude that the occurrence of those conditions in the river reaches surveyed is very rare.
Spawning season. Available habitat in the Rocky River (sites 1 and 2) during
spawning season (spring 2002) was described by gradients from riffle to pool (component 1) and from thalweg to bank (component 2; Table 2; Figure 11a). Two principal components explained a combined 71% of the variance in the data (Table 2). All three variables were significantly correlated with component 1, and substrate and mean velocity were significantly correlated with component 2 (Table 2). The interpretation of the axes from the PCA on habitat available data from the Rocky River during summer 2001 and spring 2002 are identical, and therefore the description will not be repeated here (refer to section on Post-spawning season).
were very rare in the Rocky River in the spring (Figure 12b), possibly due to drought conditions. The K-S two-sample comparisons between habitat available component scores and microhabitat use scores for PC 1 and PC 2 were both significantly different (P = 0.0001 and P = 0.0012, respectively; Table 3). This result indicates that Cape Fear shiners occupied microhabitat selectively or non-randomly with respect to both axes. Faster velocities were in short supply (Figures 11a and 12b), and Cape Fear shiner microhabitat use scores are
clustered nearer the riffle end of the component 1 axis. Deeper water was available with coarse substrates (i.e., boulders), but Cape Fear shiners were selecting for microhabitats with substrates finer than boulders (i.e., gravel and cobble) with shallower depth in or near (i.e., velocity breaks) moderate mean velocities.
Available habitat in the Deep River (site 5) during the spawning season was described by gradients from riffle to pool (component 1) and from bank to thalweg (component 2; Table 2). Two principal components explained a combined 73% of the variance in the data (Table 2). All three variables were significantly correlated with component 1 (a consistent trend in the analyses) and depth and mean velocity were significantly correlated with component 2 (Table 2). Component 1 (riffle-pool) was
interpreted as describing the gradient from riffles to pools because it was positively loaded on depth and substrate, and negatively loaded on mean velocity (Figure 11b). Pools in the Deep River were deep, with coarse substrate and slower velocities. Component 2 (bank-thalweg) was interpreted as describing the gradient between near-bank areas and the thalweg because it was positively loaded on substrate and mean velocity (Figure 11b). Near-bank areas in the Deep River had fine substrates (i.e., silt and sand), whereas the thalweg had higher velocities and coarser substrates.
In the Deep River during the spawning season, Cape Fear shiners were most frequently associated with shallower depths (30–39 cm versus 40–49; Figures 6a and 15a) than during the post-spawning season, and the distributions of available depth during the post-spawning and spawning season were not significantly different (P > 0.20) in a two-sample K-S test. Cape Fear shiners were most frequently associated with velocities of 0– 0.03 m/s, gravel substrate, and did not associate with cover at a majority of locations, but American water-willow was the most common cover type used (Figures 14a and 15). The distributions of component 1 scores for microhabitat use and habitat available were
with respect to component 1 (riffle-pool), and randomly with respect to component 2 (bank-thalweg). Cape Fear shiners occupied microhabitats that were relatively shallow with higher velocities than those habitats available, and this result is consistent for all principal
components analyses (Figure 11b).
Univariate comparisons of microhabitat use and availability frequency distributions were significantly different for all four variables (Figures 14–15; Table 3), again indicating non-random habitat use during the spawning season. Categories used most frequently are those associated with riffles, with the exception of mean velocity; however, higher velocities are in short supply (Figure 14b). Mean values of depth varied moderately between those for fish use and availability (34.6 cm versus 43.9 cm), as did means of use and availability for mean velocity (0.035 m/s versus 0.046 m/s). Cape Fear shiners occupied microhabitats during the spawning season that were shallower than those occupied during the post-spawning season.
velocity used in the Rocky River during the spawning season was slightly less than that occupied during the post-spawning season.
Cape Fear shiners were found near cover more frequently in the Deep River than in the Rocky River during the spawning season, and they were most frequently found within 25 cm of cover in both rivers during both seasons (Figure 8a and b). American water-willow is used in greater frequency than its availability (Figures 13a and 15b), and it is the most common cover object available in both rivers. For reasons discussed in the previous section, Cape Fear shiners closely associate with characteristics of habitat that also favor American water-willow, and while these areas of vegetation may be optimal habitat, it is likely that with the appropriate combination of depth, velocity, and substrate, Cape Fear shiners will occupy areas without cover. This is supported by the occurance of fish as far as 275 cm from a cover object (Figure 8a).
The Cape Fear shiner’s distance to cover varied among rivers and seasons. They occupied microhabitats closer to cover objects during the post-spawning season than during the spawning season in the Rocky River (Figure 8a). The frequency distributions of distance to cover in the Rocky River between seasons were significantly different (P = 0.0228; Figure 8a). The opposite result was found in the Deep River where Cape Fear shiners were more closely associated with cover objects during the spawning season than during the post-spawning season (Figure 8b). However, the frequency distributions of distance to cover in the Deep River between seasons were only marginally significantly different (P = 0.0730), suggesting that the association with cover was similar between the seasons.
spawning season, and these differed in some characteristics from those most frequently occupied by the Cape Fear shiner during the post-spawning season. Most suitable
microhabitats had shallower depth, higher mean velocities, similar substrate, and a similar association with American water-willow (Figures 12–15 and 17–18), relative to the post-spawning season results (Figures 9–10). Thus, the most suitable Cape Fear shiner habitat, based on relative proportions of microhabitat use and availability from both rivers (three sites total) was 20–29 cm deep, with mean velocity of 0.16–0.19 m/s, over gravel substrate, and associated with beds of American water-willow (Figures 17–18). Suitable depth was shallower during the spawning season, relative to the post-spawning season (20–29 cm versus 40–49 cm). Suitable velocity was slower during the spawning season (0.16–0.19 m/s versus 0.08–0.11 m/s; Figures 9–10 and 17–18).
Summary. Cape Fear shiners occupied riffle-type habitat, as interpreted from the PCA, and occupied habitats selectively during both seasons. Microhabitat use was similar between rivers during both seasons, and differed between seasons with respect to depth and mean velocity occupied. Cape Fear shiners occupied habitats with shallower depths and slower velocity in both rivers during the spawning season relative to the post-spawning season. Cape Fear shiners were not associated with cover at the majority of locations. When associated with a cover object, it was most frequently American water-willow. The Cape Fear shiner was more closely associated with American water-willow during the
Cape Fear shiner population density
Mean population density varied from 795 fish/ha to 1,393 fish/a during summer 2002. Cape Fear shiner mean population density in the Rocky River (site 1) was 1,393 fish/hectare with a 95% confidence interval of 97–2,690 fish/hectare (Table 7). A mean of 19.2 Cape Fear shiners were observed in the ten strip transects sampled, and the mean area surveyed per strip transect was 0.012 ha. Mean population density in the Deep River at site 4 was 795 fish/ha with a 95% confidence interval of 0–1,773 fish/ha, and at site 5 mean population density was 1,056 fish/ha with a 95% confidence interval of 179–1,933 fish/ha (Table 7). A mean of 6.4 fish were observed at the ten strip transects sampled at site 4, and a mean of 10.1 fish were observed at site 5. The mean area surveyed was 0.0084 ha at site 4 and 0.0079 ha at site 5 (Table 7). Mean fish density per kilometer was 6,270 fish/km at site 1, 4,768 fish/km at site 4, and 7,392 fish/km at site 5 (Table 7).
General behavioral and feeding observations
Cape Fear shiners were generally found closer to the substrate than to the surface, and were observed using velocity breaks (i.e., areas of fast water adjacent to slow water).
Qualitatively from observations, it appears that this species feeds on macrophytes, periphyton, and detritus that blanket the cobble and boulders in swifter water. Snelson (1971), also observed this in the original species description. Cape Fear shiners also feed on what appeared to be detritus in and around the gravel substrate. Embeddedness was not directly measured. However, Cape Fear shiners were never observed feeding from gravel with a high degree of embeddedness or from boulders that were in heavily silted areas. Cape Fear shiners were only found in reaches with low silt deposition and relatively clean
substrates covered with periphyton and detritus.
There is a common assumption that Cape Fear shiners are closely associated with American water-willow. Because of this, most biologists attempting to collect them may do so using the presence of this vegetation as a guide. Cape Fear shiners are easily captured in and around American water-willow beds, but I also located them as far as 60 m from the nearest American water-willow bed while conducting the population density estimates in July 2002. At that specific location, which would be considered riffle habitat, water depth was 35 cm, over cobble and gravel substrates and mean column velocity was 0.11 m/s. American water-willow was not growing in this particular riffle, but Cape Fear shiners were present.
Discussion
Microhabitat use, availability, and suitability
microhabitats non-randomly. In general, univariate analyses of continuous variables (depth, mean velocity, and substrate) were significantly different for use and availability in both rivers and both seasons, with the exception of the Deep River during the post-spawning season. In this case, depth was the only significantly different continuous distribution (mean velocity and substrate distributions were not significantly different), and indicates that this species was selective for depth in the Deep River during post-spawning. Depth, velocity, and substrate composition are highly correlated variables in rivers, and therefore, it is not unusual that all three paired distributions for use and availability would be different in comparisons between use and availability when a species has a high degree of habitat specificity, as I found for this species. If this species is selecting microhabitats based on one particular variable, such as substrate, it is likely that the depth and mean velocity associated with the substrate will be similar for most observations. Other studies have shown strong interactions between depth, velocity, and substrate for riffle-run guilds of fishes, making it difficult to discern if the fishes are selective for a specific variable (Vadas and Orth 2001). Cape Fear shiners show obvious habitat specificity on a broad scale (i.e., lentic versus lotic habitats), and on a finer scale within the riffle-pool sequence by being selective for specific
combinations of depth, velocity, and substrate.
partially explained by including microhabitat measurements during the spawning season that were not directly related to spawning behaviors. Cape Fear shiners may use deeper water when not directly engaged in reproductive behavior. Distributions of available depths were not significantly different in comparisons between seasons for each river, indicating a real shift in Cape Fear shiner habitat suitability (shallower depths) during the spawning season. However, focal position above the substrate was very similar between rivers and seasons.
Cape Fear shiners were not observed directly in cover at a majority of the
microhabitat locations in either river or season; however, they were usually observed within 50 cm of cover (i.e., American water willow), and this may be owing to the similarity
between areas of habitat where American water-willow grows and the optimal habitat of this fish, rather than a direct dependence on the plant.
It has been suggested that American water-willow is essential spawning habitat for the Cape Fear shiner (NCWRC 1995). In captivity, Cape Fear shiners have spawned in tanks with artificial cover (cotton mops) and gravel substrate, and eggs have been collected from the gravel (personal communication, Patrick Rakes, Conservation Fisheries, Inc., Knoxville, Tennessee). In contrast, Cape Fear shiners in captivity at the North Carolina Zoological Park in Asheboro spawned in tanks with no cover items, with gravel as the substrate, and eggs were also collected from the gravel (John Groves, NC Zoological Park, Asheboro, NC, personal communication). These observations indicate that under laboratory conditions, Cape Fear shiners can spawn in the presence or absence of cover.
post-spawning season in the Rocky River, and the evidence for a closer association during spawning in the Deep River is weak. This implies that the presence of American water-willow (or other available cover) may not be a requirement for successful spawning, but it does not discount the beneficial function American water-willow may serve in the field. American water-willow may provide protection from predators and could also serve as velocity refugia when depositing eggs onto the substrate or for egg incubation. Catch per unit effort increases when seining for Cape Fear shiners near American water-willow beds during mid-May (NCWRC 1995), and this may indicate that they migrate to the plant beds during the spring. However, while conducting the population density estimates in July 2002, I observed Cape Fear shiners as far as 60 m from the nearest American water-willow bed. This was an observation after spawning activities had ceased, and therefore, Cape Fear shiners may disperse later in the summer in order to find optimal habitats after the spawning season.
Results of the habitat availability analysis among extant, rare, and extirpated Cape Fear shiner sites support a number of ecological conclusions. First, no one of these
microhabitat suitability criteria was abundant within river reaches, and the specific
extant and where it is rare or extirpated revealed that similar proportions of suitable depths are available in the reaches sampled, but shallower mean depths were found in reaches where the species is rare or extirpated (Tables 4 and 5). The reduced mean depths may be
ecologically relevant to this species, as depth has been considered the most important factor in stream fish habitat selection (Vadas and Orth 2001). Finally, my comparisons between rare and extant Cape Fear shiner habitats in the Deep River suggest that the scarcity of suitable substrate materials in the upper Deep River, which are important for feeding and spawning activities may have contributed to localized decimation of the species and may limit its ecological success where it is extant.
Cape Fear shiner population density
meaningful Cape Fear shiner population estimates of reasonable accuracy and precision could not be obtained by the removal method, using electrofishing, seining, or any other netting technique.
Underwater observation is becoming a popular and useful method of estimating the distribution and abundance of a variety of fish species, including salmonids and marine reef species. However, success with benthic species, such as darters (Percidae), has been limited (Ensign et al. 1995). Most cyprinids, like the Cape Fear shiner, are considered water-column species, and are good candidates for use of this method. Comparisons of underwater
observation and more traditional methods (i.e., depletion or mark-recapture) have shown that underwater observations estimate abundance as well or better than the traditional methods for some species (Hankin and Reeves 1988). I employed the strip transect method rather than distance sampling (Buckland et al. 2001), which can estimate the number of undetected individuals, because visibility was relatively low as compared to some pristine streams and thus, transects were narrow; therefore, it was likely that all Cape Fear shiners in a strip transect were detected.
Underwater observations require less time, expense, and effort than do the more traditional methods, and because of this, I was able to survey 10 strip transects at each site in a reasonable amount of time. Whereas, sampling 10 discrete areas at each site using
transects that are randomly selected, can yield estimates that are more representative of a larger area, rather than of the “representative reach”.
Results of the strip transect sampling suggest some conclusions about the distribution of Cape Fear shiners. (1) The upper Deep River was thoroughly surveyed at two sites
suggests that Cape Fear shiners may be locally abundant in remaining habitats, but are exceptionally rare with respect to the overall area occupied by the species.
Ecological and management implications
My findings related to habitat suitability and availability clearly relate to human uses and alterations of the upper Cape Fear River basin. Lower mean water depth at sites where the Cape Fear shiner is rare or extirpated and an extreme scarcity of suitable water velocity at all sites may be related to the presence and operation of dams, changes in hydrology, and the changes associated with riparian and watershed land use. The construction of small dams and impoundments on rivers and streams has been hypothesized as the reason for decline of other Notropis species, including the Topeka shiner, Notropis topeka. Schrank et al. (2001) found that the number of small impoundments within a watershed was an important factor in the extirpation of the Topeka shiner in much of its range. Other studies have found that damming has lead to the extirpation of obligate riverine cyprinids above dams (Winston et al. 1991) and reduced species richness and diversity below impoudments (Quinn and Kwak 2003). Dams alter the flow of rivers and fragment species home ranges, and impoundments can act as a source of predators, and both can prevent dispersal of individuals, causing local extirpations (Winston et al. 1991; Schrank et al. 2001). These aspects must be carefully considered to facilitate survival of the Cape Fear shiner and before further alteration of the river takes place or restoration or reintroduction is considered at extirpated locations.
shiners deposit their eggs in clean gravel, and may be affected by sediment directly (i.e., reduced egg or juvenile survival) or may be behaviorally impacted by the presence of excessive sedimentation. Both effects are sublethal to adults, but can have grave
consequences for overall population stability and longevity (Burkhead and Jelks 2001). Between the two potential Cape Fear shiner reintroduction sites studied, the
extirpated site on the Rocky River (site 3) contains the most suitable physical habitat. This conclusion is primarily based on substrate availability, as this river reach contains a relative abundance of gravel substrate similar to the two sites on that river where the fish is extant. However, suitable water depth at that site may be somewhat limited, and any reintroduction effort should include examining means to improve that condition.
The site on the Deep River where the species persists, but is rare (site 6) is a candidate reach for habitat restoration toward increasing mean water depth and substrate alteration to improve conditions for Cape Fear shiner population growth. Excessive
sedimentation is a common detriment to habitat quality and ecological function of many river systems (Waters 1995), and such is the case for the Cape Fear River system (NCDWQ 2000), but dams also act as sediment traps, and may deprive downstream reaches of transported sediment and organic matter (Gordon et al. 1992). Site 6 is located proximately downstream of Coleridge Dam, which may explain the lack of fine sediments (5% by area) and gravel (5%) at that site. The lack of gravel substrate, as well as the lack of suitable depths, are likely related to the presence and operation of the dam and may be addressed to improve habitat suitability for the Cape Fear shiner.
habitat and by fragmenting the fish population. Cape Fear shiners are not found in
impounded river reaches upstream of dams in the upper Cape Fear River system (personal observation). In addition to creating substantial reaches of river that are unusable by the Cape Fear shiner, dams block movement of individual fish between the fragmented subpopulations that exist today. Thus, if an acute or catastrophic event occurs, even if
localized, that results in Cape Fear shiner mortality, individuals from other reaches would not be available to recolonize the otherwise recovered suitable habitat. Thus, for example, even if adequate water quality was attained and if the reduced mean depth in the extirpated reach on the Rocky River (site 3) was not critical to Cape Fear shiner occurrence, the species could not recolonize the area on its own due to dams.
It is critical that both adequate water quality and suitable instream habitat be
indicating a water quality problem there (see Chapter 2). Thus, until water quality is improved, and perhaps some flow augmentation is attained, this site remains unsuitable for potential reintroduction of the Cape Fear shiner. Conversely, another possible reintroduction site in the Deep River [at Parks Crossroads (site DR1), see Chapter 2] had 100% fish survival and significant fish growth during in situ exposures, indicating suitable water quality, but a survey of physical habitat in that reach would be necessary to determine if suitable physical habitat exists there in combinations known to support Cape Fear shiners.
Biotic interactions should not be ignored in the restoration of Cape Fear shiner populations. Exotic and introduced species have been cited as a major factor in the decline of native fishes, and it has been listed it as the second most common factor, following habitat alteration and preceding pollution (Lassuy 1999). Although the presence of introduced species was not originally a factor in the federal endangered listing of the Cape Fear shiner in 1987, the flathead catfish, Pylodictis olivaris, an obligate carnivorous apex predator, has been introduced into the upper Cape Fear River and has been collected from the Deep River in reaches with extant Cape Fear shiner populations. The impacts of this exotic predator may be severe and management should consider further study to investigate any possible habitat overlap and direct interactions between the species.
References
Angermeier, P. L. 1995. Ecological attributes of extinction-prone species: loss of freshwater fishes of Virginia. Conservation Biology 9:143–158.
Bednarek, A. T. 2001. Undamming rivers: a review of the ecological impacts of dam removal. Environmental Management 27:803–814.
Bovee, K. D. 1986. Development and evaluation of habitat suitability criteria for use in the instream flow incremental methodology. Instream Flow Information Paper 21. U. S. Fish and Wildlife Service Biological Report 86(7).
Buckland, S. T., D. R. Anderson, K. P. Burnham, J. L. Laake, D. L. Borchers, and L. Thomas. 2001. Introduction to distance sampling: estimating abundance of biological populations. Oxford University Press, New York.
Burkhead, N. M., S. J. Walsh, B. J. Freeman, and J. D. Williams. 1997. Status and
restoration of the Etowah River, an imperiled southern Appalachian ecosystem. Pages 375–444 in G. W. Benz and D. E. Collins, eds. Aquatic fauna in peril: the southeastern perspective. Special Publ. 1, Southeast Aquatic Research Institute, Lenz Design and Communications, Decatur, Georgia.
Burkhead, N. M., and H. L. Jelks. 2001. Effects of suspended sediment on the reproductive success of the tricolor shiner, a crevice-spawning minnow. Transactions of the
American Fisheries Society 130:959–968.
Ensign W. E., P. L. Angermeier, and C. A. Dolloff. 1995. Use of line transect method to estimate abundance of benthic stream fishes. Canadian Journal of Fisheries and Aquatic Sciences 52:213–222.
Gordon, N. D., T. A. McMahon, and B. L. Finlayson. 1992. Stream hydrology: an introduction for ecologists. John Wiley and Sons, New York.
Hankin D. G., and G. H. Reeves. 1988. Estimating total fish abundance and habitat area in small streams based on visual estimation methods. Canadian Journal of Fisheries and Aquatic Sciences 45:834–844.
Hansen, L. J., and M. L. Johnson. 1999. Conservation and toxicology: integrating the disciplines. Conservation Biology 13:1225–1227.
Kwak, T. J. 1992. Modular microcomputer software to estimate fish population parameters, production rates and associated variance. Ecology of Freshwater Fish 1:73–75.
Lassuy, D. R. 1999. Introduced species as a factor in extinction and endangerment of native fish species. In Oregon Department of Fish and Wildlife and National Marine Fisheries Service. Management implications of co-occuring native and introduced fishes:
proceedings of the workshop. National Marine Fisheries Service, 525 S.E. Portland, Oregon.