HIGHLIGHTED ARTICLE
| INVESTIGATION
Discovering Single Nucleotide Polymorphisms
Regulating Human Gene Expression Using Allele
Speci
fi
c Expression from RNA-seq Data
Eun Yong Kang,*,1Lisa J. Martin,†,1Serghei Mangul,*,1Warin Isvilanonda,* Jennifer Zou,*
Eyal Ben-David,‡Buhm Han,§,** Aldons J. Lusis,†Sagiv Shifman,‡and Eleazar Eskin*,†,2
*Department of Computer Science and†Department of Human Genetics, University of California, Los Angeles, California 90095-1596,‡Department of Genetics, Silberman Institute of Life Sciences, The Hebrew University of Jerusalem, 91904, Israel,§Division of Genetics, Brigham and Women’s Hospital, Harvard Medical School, Boston, Massachusetts 02115, and **Program in Medical and Population Genetics, Broad Institute of Harvard and MIT, Cambridge, Massachusetts 02142
ABSTRACT The study of the genetics of gene expression is of considerable importance to understanding the nature of common, complex diseases. The most widely applied approach to identifying relationships between genetic variation and gene expression is the expression quantitative trait loci (eQTL) approach. Here, we increased the computational power of eQTL with an alternative and complementary approach based on analyzing allele specific expression (ASE). We designed a novel analytical method to identifycis -acting regulatory variants based on genome sequencing and measurements of ASE from RNA-sequencing (RNA-seq) data. We evaluated the power and resolution of our method using simulated data. We then applied the method to map regulatory variants affecting gene expression in lymphoblastoid cell lines (LCLs) from 77 unrelated northern and western European individuals (CEU), which were part of the HapMap project. A total of 2309 SNPs were identified as being associated with ASE patterns. The SNPs associated with ASE were enriched within promoter regions and were significantly more likely to signal strong evidence for a regulatory role. Finally, among the candidate regulatory SNPs, we identified 108 SNPs that were previously associated with human immune diseases. With further improvements in quantifying ASE from RNA-seq, the application of our method to other datasets is expected to accelerate our understanding of the biological basis of common diseases.
KEYWORDSAllele specific expression; expression quantitative trait loci; causal variants
S
tudying the genetics of gene expression has proved usefulin identifying the genes and genetic variants underlying common human diseases. The usual approach to studying the genetic factors of gene expression is to map eQTL. An eQTL study is based on treating expression as a quantitative trait and associating it with genetic variation. eQTL studies have been
tremendously successful, and have identified many loci
in-volved in gene regulation (Ghazalpouret al.2008; Veyrieras
et al.2008; Cooksonet al.2009; Farber et al.2009; Hayes
et al.2009; Jiménez-Gómezet al.2010; van Naset al.2010;
Steibel et al. 2011; Gaffney et al. 2012; Kabakchiev and
Silverberg 2013; Francesconi and Lehner 2014). However, the traditional eQTL approach has some fundamental limita-tions. First, due to the linkage disequilibrium (LD) or corre-lation structure of the genetic variation in the genome, it is
difficult to distinguish between the regulatory variant and
neighboring variants in LD. Second, like other quantitative
traits, the total expression of a gene is influenced by multiple
genetic and environmental factors. As a result, for any given variant the effect size is small, and the study requires a large sample size to identify the effect.
An alternative approach to identify genetic variants
associ-ated with variation in gene expression is based on allele specific
expression (ASE). The principle behind the ASE mapping
ap-proach is that if an individual’s phenotype is heterozygous for a
regulatory variant, then the two copies of the gene will show different level of expression (also known as allelic expression imbalance, AEI). It was previously shown that the pattern of
Copyright © 2016 by the Genetics Society of America doi: 10.1534/genetics.115.177246
Manuscript received April 11, 2015; accepted for publication September 7, 2016; published Early Online October 7, 2016.
Supplemental material is available online atwww.genetics.org/lookup/suppl/doi:10. 1534/genetics.115.177246/-/DC1.
1These authors contributed equally to this work.
ASE within families may follow Mendelian inheritance (Yan
et al.2002). Analysis of ASE is advantageous over analyzing total expression levels because the two alleles express in the same cellular environment, thus providing an internal
con-trol for each other. Consequently,trans-acting
environmen-tal and genetic factors that increase variation between samples are minimized to similar eQTL studies, since the
analysis of ASE is influenced by the local LD structure and
by the amount of allelic heterogeneity. However, the
rela-tionship between LD and variant identification has a
differ-entflavor when utilizing ASE compared with eQTL studies.
Thus, ASE provides a complementary approach to identify-ing variants affectidentify-ing expression compared with traditional eQTL studies.
ASE measured using microarrays and RNA-seq has been used for mapping variants associated with gene expression (Taoet al.2006; Bjornssonet al.2008; Serreet al.2008; Bell
and Beck 2009; Degneret al.2009; Geet al.2009; Palacios
et al.2009; Daelemanset al.2010; Gregget al.2010; Heap
et al. 2010; Pastinen 2010; Ritchie et al. 2010; Sun et al.
2010; Wagneret al.2010; Hillet al.2011; Sun 2011; Wolff
et al.2011; Castelet al.2015; van de Geijnet al.2015). In this study, we developed and used a novel analytical
approach for identifyingcis-acting regulatory variants based
on ASE. Our method is based on a nonparametric approach
that is robust and computationally very efficient. We
demon-strated the utility of our method by analyzing RNA-seq data from 77 unrelated northern and western European individ-uals (CEU). For the mapping of each gene, we employed ASE measurements across a set of sequenced individuals
simultaneously. We then identified genetic variants in
prox-imity to those genes that can explain the observed patterns of ASE.
Materials and Methods
Reads alignment and quality control
For measuring ASE, we used the RNA-seq data of 77 unrelated northern and western European individuals (CEU) whose phased SNP information is available through the 1000 Genomes Project (phase 1). For accurate ASE measurements, individual RNA-seq data were prepared, and only reads that mapped uniquely to the genome were used to calculate the allele counts. In order to be consistent with current analyses of these datasets, we used the alignments from a previous study (Lappalainen
et al. 2013). In this study, individual human transcriptomes were sequenced using a 75-bp paired-end protocol, and the mRNA reads were mapped to the human genome with the GEM mapper. Reads mapped to multiple locations in the
hu-man genome werefiltered out, together with reads having a
low mapping quality score. (We included reads having a
map-ping quality score.10) To ensure high accuracy of the counts
at each SNP position, mRNA reads were furtherfiltered based
on individual nucleotide quality scores (“phred quality scores”).
(We included positions with phred quality scores.10).
Correcting for allelic bias in RNA-seq
Biases in reading and mapping of different alleles may result in inaccurate ASE measurements. To exclude SNPs with biased
allele signals, we applied the method proposed in Degneret al.
(2009). We created a simulated dataset consisting of all pos-sible 75-bp reads (369 million reads in total) that overlap the 1000 Genomes Project exonic SNPs. For each SNP, 150 refer-ence allele reads (75 matching each strand) and 150 nonre-ference allele reads were generated for the 75-bp reads. We mapped the simulated reads back to the genome using the MAQ software. Any SNP successfully mapped to the genome, yet having an unequal number of reads from the two alleles,
was removed in order tofilter out the SNPs showing a
map-ping bias in favor of a specific allele. To determine whether or
not a read mapped successfully, we applied the same read mapping quality threshold that we used for RNA-seq map-ping [mapmap-ping quality score (MAPQ) = 10].
Filtering out low-quality SNPs
To minimize the effect of noise in the RNA-seq data, we used a
rigorous SNPfiltering scheme, which helped us to accurately
measure the amount of allelic expression by removing
low-quality SNPs. We identified low-quality SNPs by looking at
SNP quality information at the individual level and at the population level. After removing SNPs showing inherent allelic bias using the approach explained in the previous section, we had a set of SNPs for each individual and the reads mapped to them. This set and the corresponding reads represented the amount of allelic expression for the
tran-scripts containing SNPs. In thefirstfiltering process, we used
the individual-level SNP quality information. We removed all
SNPs for each individual whose coverage was,10. We chose
a threshold of 10 because the transcript harboring these SNPs was not expressed or the SNPs did not accurately measure allelic expression for various reasons, including read align-ment errors. Second, for each SNP we compared allele in-formation from the 1000 Genomes Project data with the actual alleles collected from the reads mapped to the SNP position. Due to noise and inaccuracy in the RNA-seq data, we observed many reads with alleles other than those reported in the 1000 Genomes Project SNP information. When we ob-served many reads containing other alleles, we excluded the SNP from our allelic expression measurement process according to the rules described below. If the SNP of an individual from the 1000 Genomes Project data was
heterozy-gous, wefiltered out the SNP when (1) the frequency of the
alternative allele was higher than two alleles recorded in the 1000 Genome Project data or (2) the total frequency of the third and fourth alleles combined was greater than 5%, where the third and fourth alleles are not recorded in the 1000 Genomes Project data. If the SNP of the individual from
the 1000 Genomes Project data was homozygous, wefiltered
fourth alleles was.5%, or (3) the total frequency of the
com-bined second, third, and fourth alleles was.5%. Afterfi
l-tering SNPs using individual-level SNP quality information,
we categorized the remaining SNPs as“good”SNPs. Next,
we used the SNP quality information from the population level to exclude SNPs that did not exhibit high quality across all individuals. To achieve this, we kept SNPs only if 80% of the individuals had at least a 10-read coverage for the SNP
and 80% of individuals had a“good”SNP at the same time.
Byfiltering SNPs with individual- and population-level SNP
quality information, we produced a set of high-quality“
in-formative SNPs”allowing us to measure the amount of
al-lelic expression accurately.
ASE calling
After removing low-quality SNPs using thefiltering scheme
described above, we applied a simple ASE calling for each heterozygous site. We developed the ASE calling based on the three options: (1) higher expression of the paternal chromo-some, (2) balanced expression, or (3) higher expression of the maternal chromosome. For each individual and transcribed SNP, we made ASE calls by computing the ratio between allelic counts from maternal and paternal chromosomes using the following equation:
Cp
CmþCp (1)
whereCm is the read count from the maternal chromosome
andCpis the read count from the paternal chromosome. The
ASE calls are computed based on the allelic ratio between the allelic counts from the maternal and paternal chromosomes. If the ratio is greater than 0.65, then the paternal chromo-some is more expressed. If the ratio is less than 0:35, then the maternal chromosome is more expressed. Otherwise, the ex-pression is balanced between the two chromosomes.
Mapping regulatory variants using ASE
Our ASE mapping method fundamentally assumes that the ASE is a discrete event. As explained above, we discretize the ASE status into three groups, which can be simply expressed
mathematically as21, 0, and 1. Since we are only looking at
SNPs in the proximal region of the transcript, SNPs located
within6250-kbflanking sequences of the start and end of the
transcript region were considered in our ASE mapping.
Ana-lyzing a large window around the gene helps to identifycis
-acting variants located far from the gene, such as enhancers. This approach also helps to test the distribution of ASE-associated SNPs relative to the transcription start site (TSS). In addition, a larger window size was used by others for ASE
mapping (Geet al.2009).
Data availability
The genomic sequencing data discussed in this paper are available as part of the 1000 Genomes Project. The ASE mapping software we developed is available for download athttp://genetics.cs.ucla.edu/ase.
Results
The principle of ASE mapping
We have proposed a method that uses ASE measurements to identify the most likely regulatory variants in a genome. We measure ASE for each gene in a set of individual samples for
which we know the entire sequence and have identified the
genetic variations on each chromosome. (Data with a high resolution of detail are becoming available more often as full genome sequencing becomes increasingly feasible and cost-effective.) Taking one gene at a time, we attempt to infer which variants in the gene region may be responsible for the observed pattern of ASE. For example, assume we have three individuals with SNPs in the proximal region for a particular gene of interest and relative expression of the two copies of the gene (Figure 1).
In our framework, ASE is adiscretephenomenon: individuals
1 and 3 have AEI for the gene while individual 2 does not. In this example, there is one regulatory SNP (the third SNP from the left), which is the variant that is responsible for the
ob-served ASE. The“A”allele at the regulatory SNP site causes
higher expression of the gene relative to the“T”allele.
Our goal is to identify the regulatory variant based on both the ASE measurements and the genotypes of all SNPs in the region. We assume that the regulatory variant is within this set of genotyped SNPs. However, only variants that are hetero-zygous with AEI are possible candidates. For example, even
though thefirst SNP has AEI, it could not be the regulatory
variant since thefirst individual is homozygous. If we apply
this principle to evaluate every SNP in the region, we identify the third and seventh SNPs as the only possible variants that may be responsible for the observed pattern of ASE.
This example assumes that our calls of ASE are error free and that there is only one regulatory variant. However, we can incorporate the possibility of errors or multiple regulatory
variants into our approach by allowing for afixed number of
errors when matching genotypes with the ASE pattern. If we allow for one error, assuming that one of the three individuals
is called incorrectly, thefirst, second, and ninth SNPs can now
explain the observed ASE. A mismatch between the observed ASE pattern and the genotypes for the regulatory variant can be explained by mechanisms other than measurement errors. For example, rare variants could generate or eliminate AEI
(Montgomery et al.2010, 2011). In our approach,
analyti-cally incorporating errors allows us to take into account biases produced by both measurement errors and other mis-matches in the model, assuming that they affect only a small number of individuals.
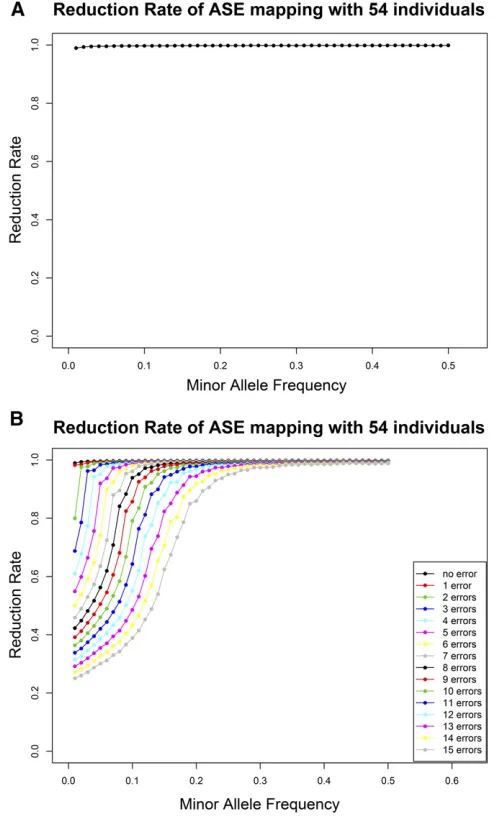
We characterize the efficacy of this method as the“
reduc-tion rate.”The reduction rate is defined as the ratio between
the number of candidate SNPs tofive, decreasing the
reduc-tion rate to 50%:We also observe that the relationship
be-tween LD and variant identification has a differentflavor in
ASE mapping when compared with eQTL studies. In our ap-proach, the genotypes of each single individual with ASE pro-vide information useful in determining which variants are potentially responsible for the observed ASE. On the other hand, in eQTL studies, each individual contributes only a limited amount to the association signal since the effect of a variant is small compared with the variance of the total expression.
Power and resolution of ASE mapping
We evaluated the analytical power and resolution of our method using data generated from the SNPs of 54 unrelated Nigerian HapMap individuals. In comparison with other modern populations, African populations have small regions of LD and higher genetic diversity. These factors allow the evaluation of our method to produce potentially higher-resolution results. Phased genotypes were obtained for the 54 unrelated Nigerian individuals from HapMap (HapMap phase 2). From this dataset, we evaluated 10.2 million polymorphic SNPs located in proximity to 18,849 human
Ensembl genes (seeMaterials and Methodsfor details). We
found 540 average SNPs per gene (Supplemental Material,
Figure S1).
The efficacy of ASE mapping or the reduction rate depends
on the number of individuals, the minor allele frequency
(MAF) of the SNPs, and the number of SNPs in a specific gene
region. We used simulations to measure the expected reduc-tion rate as a funcreduc-tion of the MAF. For each gene, we randomly selected an SNP to be the regulatory variant, and then gen-erated ASE calls for each individual. We used our methodol-ogy to identify the set of possible candidate SNPs, and computed the reduction rate. Figure 2A shows the average reduction rate as a function of the MAF for the 54 unrelated Nigerian individuals. Figure 2B shows the results for a vary-ing number of ASE measurement errors when matchvary-ing the SNP genotypes to a pattern of observed ASE.
The reduction in the number of candidate SNPs does not
necessarily mean that the association is “significant.” It is
possible that an SNP pattern in the gene randomly fits the
observed ASE pattern. To compute the significance levels of
SNP patterns in relation to ASE patterns, we permuted the ASE observations and applied our mapping method to the permuted data. We kept track of how many times an SNP
in the gene fitted the permuted ASE measurements. Since
our methodology was used for each gene, we applied a
ge-nome-wide threshold of 2:531026;which is the Bonferroni
correction for an overall significance level of 0.05, assuming
20,000 genes.
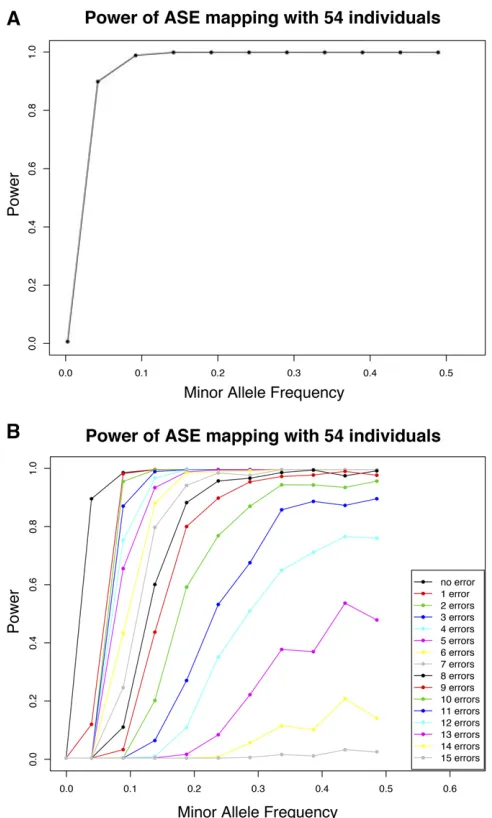
We can measure the power of our ASE mapping strategy by randomly selecting a variant to be responsible for the observed ASE and then setting the ASE status accordingly and randomly
Figure 2 The reduction rate of ASE mapping was measured as a function of the MAF in the simulation experiments using 54 unrelated Nigerian individuals (HapMap phase 2). (A) Reduction rate without ASE ment errors. (B) Reduction rate with a varying number of ASE measure-ment errors.
changing some of these statuses to simulate a specific number of errors. We can then use our ASE mapping approach to measure power. Figure 3A shows the power of our approach when applied to the 54 Nigerian individuals using the ge-nome-wide thresholds. The power computes the percentage
of simulated instances, which are more significant than the
genome-wide threshold. The power is calculated as a func-tion of different MAFs. Figure 3B shows how including ASE measurement errors affects the power. The results presented in Figure 2B and Figure 3A show that, with this sample size
and 10% errors, there is still sufficient power and reduction
rate to identify the potential regulatory variants affecting gene expression. As long as the sum of the error rate of the ASE measurements or the frequencies of the additional
reg-ulatory variants in the gene are,10%; the method still has
significant statistical power and reduction rate. Clearly, the
same error rate can be achieved with even larger ASE mea-surement error rates given larger sample sizes.
Our simulation also implies that, given a sample size of 54 individuals, the observed pattern of ASE is unlikely to randomly match the genotype distribution of a random var-iant. Thus, other deviations from the model, such as the presence of multiple variants affecting expression, will likely avoid producing either false positives or an observed ASE pattern matching any single SNP genotype pattern.
ASE mapping in 77 European samples
We applied our methodology to the RNA sequencing data of 77 lymphoblastoid cell lines (LCLs) derived from unrelated European individuals (CEU). Phased haplotypes were avail-able from the 1000 Genomes Project. The allelic count for each exonic SNP was calculated from a previously mapped RNA
sequencing of the LCLs (Lappalainenet al.2013). To maintain
the integrity of the ASE calls, we applied rigorous SNPfi
lter-ing schemes uslter-ing individual- and population-level SNP
qual-ity information. Further, we only considered “informative
SNPs,”which are SNPs with at least 10 reads from each allele
in an individual (seeMaterials and Methodsfor more details).
After conducting all quality control processes, we identified
281,653 informative SNPs (counting the same SNP found in different individuals multiple times) to accurately measure the allelic expression abundance. For each transcribed SNP, the ASE calling assigned each individual into one of three different categories: (1) higher expression of the maternal allele, (2) balanced expression, and (3) higher expression of the paternal allele. In our combinatorial model, each
cat-egory is denoted by21, 0, and 1, respectively. We used the
ASE calls in the mapping algorithm to identify candidate
regulatory SNPs, and we tested the significance of these
can-didates using a permutation test (explained inMaterials and
Methods).
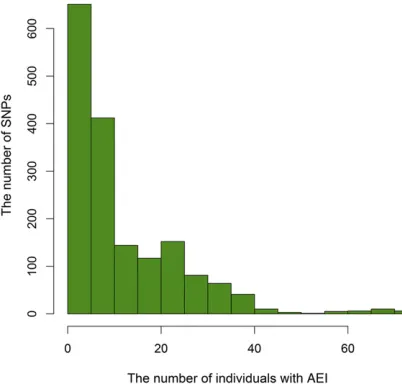
Among 18,849 Ensembl transcripts, we found 850 tran-scripts with at least one informative SNP that allowed us to measure ASE. Table 1 shows the number of informative SNPs observed per transcript. There were 1706 informative SNPs in at least one individual. Across the 1706 SNPs, the average number of individuals with AEI and balanced expression was 12 and 10, respectively (Figure 4).
We used our ASE mapping method for each transcript. We considered only SNPs that were proximal to or within the
transcript (250-kbflanking sequences of the start and end of
the transcript). To identify candidate regulatory variants, we examined in total 6,445,845 SNPs in the proximal region of
the 850 gene. We found at least one significant SNP
(P,2:531026) for 104 transcripts (the total number of
Figure 3 The power of ASE mapping is measured as a function of the MAF in the simulation experiments using 54 unrelated Nigerian individ-uals (HapMap phase 2). (A) Power of ASE mapping without ASE mea-surement errors. (B) Power of ASE mapping with a varying number of ASE measurement errors.
Table 1 The number of informative SNPs per transcript
No. of distinct informative SNPs 1 2 3 4 5 >6
No. of transcripts 527 163 69 27 21 41
SNPs associated with ASE was 2309). The average number of candidate SNPs after the ASE mapping was 22.2. For 85
tran-scripts (81:7%), we found that either one variant or multiple
variants in perfect LD could explain the ASE patterns. Of
these transcripts, 53:8% had ,10 candidate SNPs, and
21:1% had one or two candidate SNPs. The average
reduc-tion rate was 98:7%:File S1reports all the transcripts and
their significantly associated SNPs.
The mapped SNPs are enriched in promoter regions and known functional regulatory variants and are
associated with immune-related diseases
The SNPs mapped to the ASE are expected to be highly enriched for regulatory SNPs (some may be in LD with such variants). Therefore, we expect those candidate SNPs to be distributed nonrandomly relative to the distribution of known regulatory sequences. The major regulatory element of tran-scription is the region upstream of the trantran-scription start site (TSS), known to contain a core promoter sequence.
To see if the 2309 significantly associated SNPs identified by
the ASE mapping are within possible promoter regions, we computed the distance between the associated SNPs and TSSs. As shown in Figure 5, the mapped SNPs (denoted by a red line) were enriched near the TSS. Furthermore, the SNPs were more abundant downstream of the TSS in the gene bodies and less
abundant in the region upstream of the TSS (P,6:5310285).
To further test the significance of these observations, we
com-pared the density of SNPs associated with ASE to the density of SNPs not associated with ASE as a function of distance from the TSS (Figure 5). These comparisons showed a strik-ing difference in the distance from the TSS between the
two types of SNPs (P,5:83102195). This difference
indi-cates that the enrichment around the TSS cannot be attrib-uted to the initial distribution of distances between the candidate SNPs and the TSS.
To further test the functional evidence for the variants associated with ASE, we used the list of functionally annotated SNPs in the RegulomeDB database. RegulomeDB integrates a large collection of regulatory information collected from high-throughput experimental datasets from ENCODE and other sources. In addition, RegulomeDB uses computational pre-dictions and manual annotations to identify putative
regula-tory potential and functional variants (Boyleet al.2012). The
annotation information contained in RegulomeDB is particu-larly useful for genome-wide association studies (GWASs), because the database includes functional annotations of ge-nomic regions outside of genes as well as those in regions showing direct changes in protein-coding genes. To evaluate the functional evidence, we tested the enrichment of ASE-mapped SNPs among the annotated SNPs in RegulomeDB.
We used a Fisher’s exact test to assess the relationship
be-tween the ASE-mapped SNPs and the category 1 annotated SNPs in RegulomeDB. The RegulomeDB category 1 SNPs are most likely to be functional, as they are predicted to alter transcription factor binding and were previously found to be linked to gene expression. We found that the ASE-mapped
SNPs were significantly enriched for the functional
annota-tions category 1 (P¼4:6310217;odds ratio = 4.0). Out of
the 1809 uniquely ASE-mapped SNPs, 55 were in category 1 (File S2), although only 13 would be expected by chance.
We next investigated whether the SNPs identified in our
study were reported in GWASs. A large number of SNPs have
been identified as associated with different human traits and
diseases in GWASs; however, in most cases the molecular mechanism is unknown. To study the connection between GWASs and the ASE mapping results, we matched the list of
candidate regulatory SNPs to the list of significant SNPs
reported by GWASs (based on GWAS Central). We included
high-LD SNPs (r2.0:8) with the GWAS-reported SNPs, since
GWASs use SNP arrays that do not cover all SNPs in the
genome. We found six clusters of SNPs with high LD
(r2.0:7) that were reported in multiple GWASs to be
asso-ciated with ASE (File S1). The diseases were all immune
re-lated, and included inflammatory bowel disease, Crohn’s
disease, type 1 diabetes, and asthma.
Discussion
We have developed a novel method based on ASE for
iden-tifyingcis-regulatory variants. The fundamental assumption
of the proposed approach is that the AEI is a discrete event
[i.e., balanced (0), or imbalanced in two different directions
(21 or 1)]. The discretization may cause errors in the ASE
calling. However, as we show with our simulation experi-ments, a strong correlation between observed ASE calls and a random set of genotypes is uncommon, even for samples with only 54 individuals. Further, the proposed mapping ap-proach is resistant to ASE calling errors with increased sam-ple size. Our proposed approach is simsam-ple, powerful, and
capable offlexibly handling a wide range of sample sizes.
Our approach has several limitations. First, our method depends on accurate measurement of ASE from RNA-seq data. Obtaining accurate measurement of ASE has been shown to be challenging, as the reads from each allele are subject to various
biases including the alignment procedure (Degneret al.2009;
Stevenson et al.2013). In addition, a single clone can take
over in cell lines grown for many generations, increasing the chance of random monoallelic expression (Eckersley-Maslin and Spector 2014).
Second, like any other method based on ASE, we could
identify regulatory variants acting in cis, but we could not
identify regulatory variants acting in trans. Third, with the
current coverage of RNA-seq, we mainly rely on transcribed SNPs. Thus, not all genes have informative SNPs to measure ASE in each individual. Instead, to expand the number of
genes having sufficient informative SNPs to measure ASE,
we rely on both rare and common variants, and use intronic SNPs, larger sample sizes, and increased sequencing depths. Third, our approach assumes that one causal variant drives the observed ASE. However, it is likely that in each region there is more than one variant affecting expression. Thus, more than one variant can be responsible for the observed ASE. In this scenario, each secondary variant that affects ASE will appear as an error in our framework. If the number of individuals affected by these secondary variants is smaller than the error threshold, our framework for mapping will still correctly identify the variant primarily responsible for the observed ASE. In the future, we plan to extend our framework to incorporate the possibility of multiple variants affecting ASE.
Finally, our approach assumes that the haplotype phase is both known and accurately inferred. In practice, errors in haplotype inference may manifest as errors in our ASE map-ping approach. In the event that the haplotype phase is
un-available, we can use a modified version of our approach
where we consider variants as being either homozygous or heterozygous, and consider a match between an ASE obser-vation and a variant if the variant is heterozygous. In this scenario, the lack of phase will lead to a loss of power, but our framework will still control false positives.
Our method inherently assumes that the ASE calls are discrete. This has several advantages. First of all, in principle, it should be easier to make accurate discrete ASE calls when we are allowed to declare a call as ambiguous, rather than estimating the quantity of ASE. In addition, the discrete nature of our calls naturally predisposes the nonparametric mapping methodology we have presented. However, this approach has several disadvantages, including loss of in-formation regarding the effect size of the variants that are
causing ASE and loss of information about the confidence in
the ASE calls themselves.
Despite the above limitations, ASE studies are a powerful approach to identifying associations between genetic varia-tion and gene expression. When ASE is accurately measured, it
has a high power in identifyingcis-acting regulatory variants
associated with common diseases. Our developed method for ASE mapping is a step forward in establishing the functional risk alleles for these diseases and using this information to develop new hypotheses about their causes and treatment.
Acknowledgments
E.Y.K., S.M., and E.E. are supported by National Science Foundation grants 0513612, 0731455, 0729049, 0916676, 1065276, 1302448, 1320589, and 1331176 and National Institutes of Health (NIH) grants K25-HL080079, U01-DA024417, P01-HL30568, P01-HL28481, R01-GM083198,
R01-ES021801, R01-MH101782, and R01-ES022282. E.E. is supported in part by the NIH BD2K award U54EB020403. S.S. was supported by the Israel Science Foundation grant 940/13.
Literature Cited
Bell, C. G., and S. Beck, 2009 Advances in the identification and analysis of allele-specific expression. Genome Med. 1: 56. Bjornsson, H. T., T. J. Albert, C. M. Ladd-Acosta, R. D. Green, M. A.
Rongione et al., 2008 Snp-specific array-based allele-specific expression analysis. Genome Res. 18: 771–779.
Boyle, A. P., E. L. Hong, M. Hariharan, Y. Cheng, M. A. Schaub
et al., 2012 Annotation of functional variation in personal ge-nomes using RegulomeDB. Genome Res. 22: 1790–1797. Castel, S. E., A. Levy-Moonshine, P. Mohammadi, E. Banks, and T.
Lappalainen, 2015 Tools and best practices for data processing in allelic expression analysis. Genome Biol. 16: 1.
Cookson, W., L. Liang, G. Abecasis, M. Moffatt, and M. Lathrop, 2009 Mapping complex disease traits with global gene expres-sion. Nat. Rev. Genet. 10: 184–194.
Daelemans, C., M. E. Ritchie, G. Smits, S. Abu-Amero, I. M. Sudbery
et al., 2010 High-throughput analysis of candidate imprinted genes and allele-specific gene expression in the human term placenta. BMC Genet. 11: 25.
Degner, J. F., J. C. Marioni, A. A. Pai, J. K. Pickrell, E. Nkadoriet al., 2009 Effect of read-mapping biases on detecting allele-specific ex-pression from RNA-sequencing data. Bioinformatics 25: 3207–3212. Eckersley-Maslin, M. A., and D. L. Spector, 2014 Random mono-allelic expression: regulating gene expression one allele at a time. Trends Genet. 30: 237–244.
Farber, C. R., J. E. Aten, E. A. Farber, V. de Vera, R. Gularteet al., 2009 Genetic dissection of a major mouse obesity QTL (Carfhg2): integration of gene expression and causality modeling. Physiol. Genomics 37: 294–302.
Francesconi, M., and B. Lehner, 2014 The effects of genetic vari-ation on gene expression dynamics during development. Nature 505: 208–211.
Gaffney, D. J., J.-B. B. Veyrieras, J. F. Degner, R. Pique-Regi, A. A. Paiet al., 2012 Dissecting the regulatory architecture of gene expression QTLs. Genome Biol. 13: R7.
Ge, B., D. K. Pokholok, T. Kwan, E. Grundberg, L. Morcos et al., 2009 Global patterns ofcisvariation in human cells revealed by high-density allelic expression analysis. Nat. Genet. 41: 1216–1222. Ghazalpour, A., S. Doss, H. Kang, C. Farber, P.-Z. Z. Wen et al., 2008 High-resolution mapping of gene expression using asso-ciation in an outbred mouse stock. PLoS Genet. 4: e1000149. Gregg, C., J. Zhang, J. E. Butler, D. Haig, and C. Dulac, 2010
Sex-specific parent-of-origin allelic expression in the mouse brain. Science 329: 682–685.
Hayes, K. R., B. M. Young, and M. T. Pletcher, 2009 Expression quantitative trait loci mapping identifies new genetic models of glutathione S-transferase variation. Drug Metab. Dispos. 37: 1269–1276.
Heap, G. A., J. H. M. Yang, K. Downes, B. C. Healy, K. A. Huntet al., 2010 Genome-wide analysis of allelic expression imbalance in human primary cells by high-throughput transcriptome rese-quencing. Hum. Mol. Genet. 19: 122–134.
Hill, M. J., E. Kenny, S. Roche, D. W. Morris, A. Corvin et al., 2011 Allelic expression imbalance of the schizophrenia sus-ceptibility gene CHI311: evidence of cis-acting variation and tissue specific regulation. Psychiatr. Genet. 21: 281–286.
Jiménez-Gómez, J. M., A. D. Wallace, and J. N. Maloof, 2010 Network analysis identifies ELF3 as a QTL for the shade avoidance response in arabidopsis. PLoS Genet. 6: e1001100. Kabakchiev, B., and M. S. Silverberg, 2013 Expression
quantita-tive trait loci analysis identifies associations between genotype and gene expression in human intestine. Gastroenterology 144: 1488–1496, 1496.e1–3.
Lappalainen, T., M. Sammeth, M. R. Friedländer, P. A. C.’t Hoen, J. Monlonget al., 2013 Transcriptome and genome sequencing uncovers functional variation in humans. Nature 501: 506–511. Montgomery, S. B., M. Sammeth, M. Gutierrez-Arcelus, R. P. Lach, C. Ingleet al., 2010 Transcriptome genetics using second genera-tion sequencing in a Caucasian populagenera-tion. Nature 464: 773–777. Montgomery, S. B., T. Lappalainen, M. Gutierrez-Arcelus, and E. T. Dermitzakis, 2011 Rare and common regulatory variation in pop-ulation-scale sequenced human genomes. PLoS Genet. 7: e1002144. Palacios, R., E. Gazave, J. Goñi, G. Piedrafita, O. Fernandoet al., 2009 Allele-specific gene expression is widespread across the genome and biological processes. PLoS One 4: e4150. Pastinen, T., 2010 Genome-wide allele-specific analysis: insights
into regulatory variation. Nat. Rev. Genet. 11: 533–538. Ritchie, M. E., M. S. Forrest, A. S. Dimas, C. Daelemans, E. T. Dermitzakis
et al., 2010 Data analysis issues for allele-specific expression using Illumina’s GoldenGate assay. BMC Bioinformatics 11: 280.
Serre, D., S. Gurd, B. Ge, R. Sladek, D. Sinnett et al.,
2008 Differential allelic expression in the human genome: a ro-bust approach to identify genetic and epigeneticcis-acting mecha-nisms regulating gene expression. PLoS Genet. 4: e1000006. Steibel, J. P., R. O. Bates, G. J. Rosa, R. J. Tempelman, V. D.
Rilingtonet al., 2011 Genome-wide linkage analysis of global gene expression in loin muscle tissue identifies candidate genes in pigs. PLoS One 6: e16766.
Stevenson, K. R., J. D. Coolon, and P. J. Wittkopp, 2013 Sources of bias in measures of allele-specific expression derived from RNA-sequence data aligned to a single reference genome. BMC Genomics 14: 536.
Sun, C., C. Southard, D. B. Witonsky, O. I. Olopade, and A. Di Rienzo, 2010 Allelic imbalance (AI) identifies novel tissue-specificcis -regulatory variation for human UGT2B15. Hum. Mutat. 31: 99–107. Sun, W., 2011 A statistical framework for eQTL mapping using
RNA-seq data. Biometrics 68: 1–11.
Tao, H., D. R. Cox, and K. A. Frazer, 2006 Allele-specific KRT1 expression is a complex trait. PLoS Genet. 2(6): e93.
van de Geijn, B., G. McVicker, Y. Gilad, and J. K. Pritchard, 2015 Wasp: allele-specific software for robust molecular quan-titative trait locus discovery. Nat. Methods 12: 1061–1063. van Nas, A., L. Ingram-Drake, J. S. Sinsheimer, S. S. Wang, E. E.
Schadtet al., 2010 Expression quantitative trait loci: replication, tissue- and sex-specificity in mice. Genetics 185: 1059–1068. Veyrieras, J.-B., S. Kudaravalli, S. Y. Kim, E. T. Dermitzakis, Y. Gilad
et al., 2008 High-resolution mapping of expression-QTLs yields insight into human gene regulation. PLoS Genet. 4: e1000214. Wagner, J. R., B. Ge, D. Pokholok, K. L. Gunderson, T. Pastinenet al.,
2010 Computational analysis of whole-genome differential allelic expression data in human. PLOS Comput. Biol. 6: e1000849. Wolff, P., I. Weinhofer, J. Seguin, P. Roszak, C. Beisel et al.,
2011 High-resolution analysis of parent-of-origin allelic expres-sion in the arabidopsis endosperm. PLoS Genet. 7: e1002126. Yan, H., W. Yuan, V. E. Velculescu, B. Vogelstein, and K. W. Kinzler,
2002 Allelic variation in human gene expression. Science 297: 1143.