SYSTEMS OF MATING. 111. ASSORTATIVE MATING BASED ON SOMATIC RESEMBLANCE
SEWALL WRIGHT
Bureau of Animal Industry, United States Department of Agriculture, Washington, D. C. Received October 29, 1920
TABLE O F CONTENTS
Variation due to one unit factor.. ... 144
Variation due to two factors.. ... 145
General formulae.. ...
...
146Summary of formulae.. ... ... 151
Checks on theory.. ... 152
One factor.. ... ... 152
... 152
Other results.. ... ... 152
Equilibrium.. ... 153
... 153
Composition of the population. ... 155
Dominance.. ... 157
Assortative mating with inbreeding. ... 157
Percentage of heterozygosis. ... 158
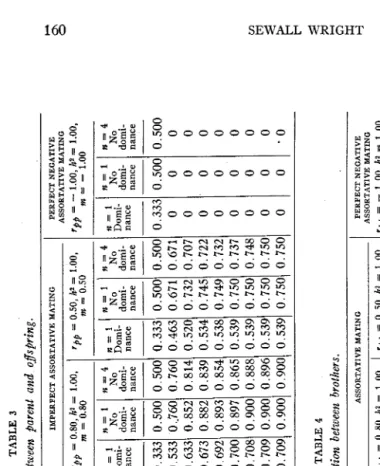
Correlation between parent and offspring ... 160
Correlation between brothers.. ... 160
LITERATURE CITED ... 161
The variability of a population. ...
VARIATION DUE TO O N E UNIT FACTOR
The effect of assortative mating on a population in which there is a single unit-factor difference. sex-linked or otherwise, has been discussed by
JENNINGS (1916) for the case of dominance. The effects of assortative
mating with regard to one factor on the distribution of a linked factor are discussed in a later paper by the same author (JENNINGS 1917). WENT- WORTH and REMICK (1916) give a more general formula for the case of one factor with dominance, and also a formula for the case of no dominance. If there are an equal number of the dominant and recessive allelomorphs in the population, the series of percentages of heterozygosis for successive generations runs
+,
t, t,
h,
etc., in the absence of dominance, and $, +,+,
i,
A, etc., in the presence of dominance.ASSORTATIVE MATING BASED ON SOMATIC RESEMBLANCE 145
A A 1
VARIATION DUE TO TWO FACTORS
2 1
A n 2 4 2
a a 1 2 1
Where a correlation between mates is based on relationship, the aver- age percentage of heterozygosis is not affected by the number of factors involved. The case is otherwise with assortative mating based on external resemblance. I n dealing with characters dependent on two or more fac- tors the fact that the same appearance may be due to wholly different genetic constitutions, complicates the matter.
A B
Ab
aB
ab
13 5 5 1 24
5 7 7 5 2 4
5 7 7 5 2 4
1 5 5 13 24
A B A b aB ab
(4) 1
(3) 2 1 1
(2) 1 2 2 1
(1) 1 1 2
A A
Aa
aa
1
13 10 7 130
10 16 10 36
7 10 13 30
4 4 4 4
FIGURE 2
A B Ab aB ab
24 24 24 24 196
FIGURE 3
A B Bb bb
30 36 30 196
FIGURE 4
FIGURE 1.-Genotypes in original population.
FIGUFS 2.-Gametes produced by five phenotypes.
FIGURE 3.-Correlation between uniting gametes.
FIGURE 4.-Genotypes after one generation of assortative mating.
Let us consider the case of assortative mating with respect to a char- acter which depends on two equivalent factors, A and B , neither of which is dominant over its allelomorph a or b. We will further assume that A
146 SEWALL WRIGHT
borne in mind that I$ of the matings are within phenotype 4, i$ within
phenotype 3, i$ within phenotype 2, etc The frequencies are given in
figure 3 , and the composition of the resulting population in figure 4.
By repeating this process, the composition of any number of generations can be found. The writer has carried the work to the fourth generation. The percentages of heterozygosis for a given pair of allelomorphs in suc- cessive generations form the series ($), $,
++,
Qt,
i?&. The correlationsbetween gametes resulting *from gametogenesis form the series 0,
Q,
$,#,
and the correlations between uniting gametes form the series $,
3,
2,
gf.
One would hardly care to deal with more than two factors or with imperfect assorta- tive mating by this method. Fortunately i t is not difficult to obtain a general formula by methods similar to those used in the case of inbreeding.The work is rather‘ tedious even in this very simple case.
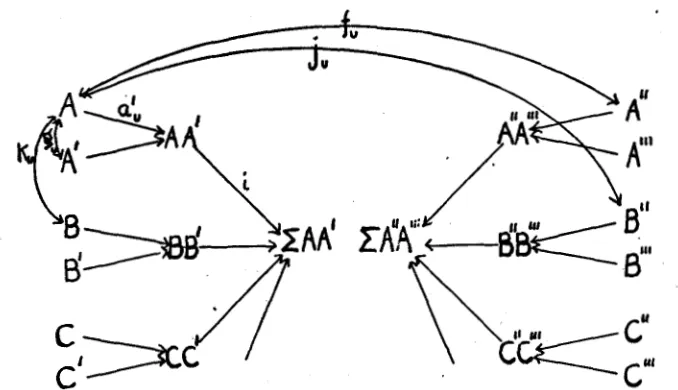
GENERAL FORMULAE
I n figure 5 , ZAA’ and 2A”A”’ are meant to represent the genetic con- stitutions of two mated individuals. We will assume for the present that there is no dominance and that the influences of the various pairs of fac- tors AA’, BB‘, CC‘, etc., are combined additively. The path coefficient measuring the influence of any one of these pairs on the sum is represented by i. Each pair of allelomorphs such as AA’ is determined by the two factors of that set, A and A’, which united a t fertilization. The path coefficient A to AA’ is a:, using the same symbol as in the preceding papers except that a subscript U is employed to indicate that we are deal-
ing with a single unit factor. This coefficient U: is not, of course, equal to the reverse path coefficient AA’ to A , representing the relation between zygote and gamete in gametogenesis, which would be represented by b,.
We are assuming that there is a certain correlation between mated indi- viduals based on their somatic resemblance. We will call this correlation rpp. The existence of this somatic correlation means in general that there is some correlation between the zygotic constitutions. This we will represent by m. The existence of the correlation m implies a certain correlation between factors of the same set of allelomorphs, such as A
and A”, in the mated individuals. It also, however, implies a correlation between factors of different sets of allelomorphs which act on the same character, such as A and B”. The former correlation will be represented by f, the latter by j,. For the sake of simplicity, we will assume that the factors A , B, C, etc., are equal in effect and that the relative frequency of
ASSORTATIVE MATING BASED ON SOMATIC RESEMBLANCE 147
with assortative mating based wholly on external characters, there is no reason why an individual of formula AAbb should have a greater tend- ency to mate with his like than with aaBB.
Thus, j , =
f,
Where there is no assortative mating based on external characters, as in the cases of inbreeding which have been discussed,j, = 0. We will take
up later the combination of inbreeding with assortative mating, in which
f,
is larger thanj,. A case in which A and a are about equally numerous, while b is much less frequent than B , will of course be intermediate between the case which we are considering with n factors and the case with n-1factors.
FIGURE 5.-Genetic constitutions of two individuals represented as determined by the indi- vidual factors and as correlated through correlations among the latter.
The correlation between two factors of the same set of allelomorphs, which separate a t gametogenesis (such as A and A ’ ) is represented by g,. As these factors united a t fertilization, in the preceding generation, we have, using primes for the preceding generation, g, = f:.
The correlation between factors of different sets of allelomorphs (such as A and B ) is represented by k,. There is an evln chance that these two factors, came to the individual from the same parent. I n this case, the correlation is naturally the same as in the preceding generation, k:. It is also an even chance that the factors came from opposite parents in which case their correlation must be j : ( =
f:).
148 SEWALL WRIGHT
On the average
‘4, = $
(f:
+
‘4:)Since AA’ is completely determined by A and A’ 2 Q(1
+
g,) = 11
- -
1
a 2
=2 (1
+
$54) 2 (1+f:>
Any two pairs of factors such as AA’ and BB’ are connected by four paths. Their correlation is thus 4a2kU
The total genetic constitution 2AA’ is completely determined by the various pairs of factors of which we will assume that n are involved.
ni2
+
4 n (n-
I) i2a:2kU = 1j 2 = 1
+fi:
n (1
+fi:
+
2 (n - 1) h,)The correlation between two mated individuals (in so far as it is genetic) must equal the sum of the correlations between the various unit-factors in their constitutions. Adding up all connecting paths between ZAA’ and
2A”A”’ we get:
m = 4 ni2 a?f,
+
4 n (n - 1) i2a:2jU = 4 n2i2a>fu-
1) h,- 2 nfu
1
+fi
+
2-
m 2n
j , = - [I
+fi:
+
2 (e - 1) ‘4,IFor the percentage of heterozygosis with respect to a single pair of fac- tors among the progeny of the mating between ZAA’ and 2A”A”’ we have as usual:
P
=*
(1 - f u >The constitution of the gametes can be thought of as completely deter- The path mined in a mathematical sense by the component factors.
coefficients A to ABC, etc., in figure 6 are represented by 1. n Z 2
+
n (n - 1) 12ku = 1ASSORTATIVE MATTNG RASED ON SOMATIC RESEMBLANCE 149
The correlation be found.
The correlation also easily found.
between two sister gametes ABC and A'B'C' can now
g = nZ2gu
+
U (n - 1) Z2k,between uniting gametes such as ABC and Ar'B"C'' is
f
= nZ2fu+
n (n-
1)Pj,
= n212fu
A''
6'
E
r
C"
Cl
FIGURE 6.-Genetic constitutions of sister gametes (produced from one germ mother cell) of
mated individuals represented as determined by the individual factors and as correlated through
the latter.
The values of b and a (figure 7) are the same as with inbreeding.
The existence of a correlation, rPp, between mated individuals, based on their somatic resemblance, means not only that there is a tendency to mate individuals of like genetic composition, but also individuals affected similarly by external conditions, ,or resembling each other because genetic
FIGURE
7.-The
relations
between
mated
individuals
and
two
offspring,
under
assortative
mating.
E
represents
external
conditions
affect-
ing
development;
ZAA',
etc.,
represents
the
genetic
constitutions;
ABC,
etc.,
are
the
germ-cells.
On
comparing
with
figure
6,
note
that
ABC
and
A'B'C
are
any
gametes
produced
by
the
sire
(and
similarly
for
the
dam)
and
thus
are
not,
in
general,
sister
gametes,
as
were
ABC
and
A'B'C'
in
figure
6.
The
correlation
between
the
sire
and
dam
(r##)
is
broken
into
four
possible
connecting
ASSORTATIVE MATING BASED ON SOMATIC RESEMBLANCE 151
peculiarities of one have had the same effect as the external conditions which influenced the development of the other. If h2 and e2 are the rela- tive degrees of determination by heredity and environment, respectively, it may easily be shown that rpph2 is the correlation between the genetic compositions of the two individuals, rppe2 that between the external con- ditions which affected them, and r,,eh that between the genetic composi- tion of one and the external conditions for the other. The total correla- tion between the individuals (figure 7) is thus
r,, (h4
+
2 h2e2+
8) = r,, (e2+
h2)2 = r,,A consideration of the relations between parent and offspring and between two offspring, as represented in figure 7, but using
V 2
for the degree of determination of a parent by heredity, gives the following formulae:r,, = abhh’ (1
+
r,,)r,, = 2 a2b2h2 (1
+
r#)SUMMARY OF FORMULAE
I t will be convenient to summarize the more important formulae at this point:
m = hf2r,,
gu =
f;
Ku =
3
v:
+
K:)
I
6 2 =
3
(1+
g) r,, = abhh’ (1+
r,,) r,, = 2 a262h2 (1+
r,,h’2)P
=3
(1 - f u )152 SEWALL WRIGHT
f,, k,
and h2 can be calculated for any number of generations for a given number of factors (n), a given coefficient of assortative mating (rpp) and a given initial degree of determination by heredity (h:). The other path co- efficients, the correlations and the percentage of heterozygosis can then be found for any generation.CHECKS ON THEORY
A check on these results can be obtained by comparing with the results obtained by direct calculation in the case of perfect assortative mating with one or two factors.
One factor
f,
=3
(1+fJ
p
=3
(1-
f,)
=3
p‘
Thus the percentage of heterozygosis halves with every generation as found by direct analysis.
Two factors
k, =
3
(f:,
+
k:) fu =a
(1+fA
+
2 k,)Starting with
f,
= K , = 0, we obtain the following series:1 J. 2 3 2 9 1 3 3 0 3 5 1-57
K,
= 0, 0, B, 4 , 7;T, F Y. .
.
1f,
= 0, 4 , 8 ) 6T7 6 Y l T3g.
1From these figures, the values of g,
f
andp
can be calculated:5 1 6 4
g = 0, 0,
6,
a,
si, 85. .
.
1f
=+,
8,
+,
2,
#, +%
.
.
.
1p
=3,
8,
A,
E,
&%,
5”rT. . .
0These figures agree with those obtained for the correlation between sister gametes, between uniting gametes, and for the percentage of hete- rozygosis, as far as these were obtained by direct calculation (see page 146).
OTHER RESULTS
ASSORTATIVE MATING BASED ON SOMATIC RESEMBLANCE 153 EQUILIBRIUM
When equilibrium is reached,
f,,
=ji
= g,, = K,, etc.,f
= g, ab =3.
m2 n - m (2 n
-
1)f,
=n (1 - m)
2 n ( 1 - m ) + m
P =
With perfect assortative mating, no dominance and no variation which is not genetic (m = l), there is no equilibrium until heterozygosis is entirely eliminated. Such conditions, however, would almost never be found in practice. Thus in general, assortative mating leads to a condition of equilibrium in the population without ever fixing types. I n fact, the degree of fixation of types is in general rather small. A correlation of 0.80 between zygotic formulae would be very high in practice. If m =
n
0.80,
p
= ~ With two factors involved, heterozygosis is reduced2n
+
4’only from 0.50 to 0.25 by an indefinite number of generations of assorta- tive mating. With four factors,
p
is reduced only to 0.333, and with eight factors, only to 0.40.h2
The correlation between parent and offspring becomes - (1
+
rPp) and 2between brothers - (1
+
rpph2) when equilibrium is reached. It is evident that these correlations may be very high under conditions under which there is very little increase in homozygosis.h2 2
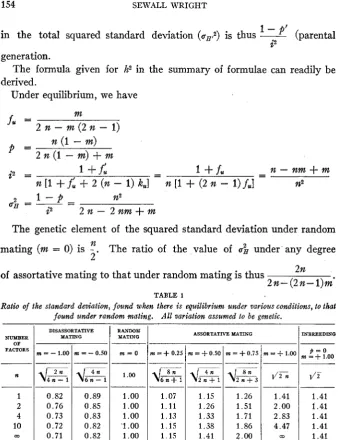
THE VARIABILITY O F A POPULATION
One of the most important features of the composition of the population resulting from a given system of mating is its variability compared with that of the original random-bred stock. Turning to figure 5 , we see that the degree to which the total genetic constitution (ZAA’) is determined by variation in a particular pair of allelomorphs (AA’) is measured by i2.
This measures the portion of the genetic element in the squared standard deviation of the population, which is due to one pair of allelomorphs. The squared standard deviation for such a pair of allelomorphs depends on the average percentage of heterozygosis. With the distribution
3
(1 - 9’)A A
+
p A a+
4
(1 - 9 ) aa the squared standard deviation is 1 -p’
inthe scale in which unity is the effect of one factor. The genetic element
154 SEWALL WRIGHT
~
+L 2 n + l
1.15 1.26 1.33 1.38 1.41
1 -
p'
in the total squared standard deviation (aH?) is thus generation.derived.
(parental
22
The formula given for h2 in the summary of formulae can readily be Under equilibrium, we have
m
2 9 2 - m ( 2 n - 1)
n (1
-
m) 2 n (1 - m)+
mf u =
P =
- n - n m + m
p = 1
+.f:
- - 1 + f u -[I
+.L
+
2 (n - 1)U
n[I
+
(2 n-
l)juI 7822 1 - P = n2
The genetic element of the squared standard deviation under random n
mating (m = 0) is
-.
The ratio of the value of&
under any degree2
UH =
7
2 n - 2nm-l-m
___
p ? L 2 n + 3
l/zn
~~~
1.26 1.41
1.51 2.00
1.71 2.83
1.86 4.47
2.00 m
212
2 n- (2 n- 1)m'
of assortative mating to that under random mating is thus
0.82 0.76 0.73 0.72 0.71
TABLE 1
Ratio of the standard deviation, found when there is equilibrium under various conditions, to that found under random mating. All variation assumed to be genetic.
0.89 0.85 0.83 0.82 0.82 "ER
OF FACTORS
n
1 2 4 10 m
DISASSORTATIVE RANDOM MATING
m = - =r:l -0.50
1
m = 01 .oo 1 .oo 1.00 '1 .oo 1 .oo
ASSORTATIVE MATING
m =
+
0.25 m =+
0.50 m =+
0.75 m =+
1.00MBREEDINQ
p = 0
m =
+
1.00~
6 n + 1
1.07
1.11
1.13
1.15
1.15
1.41 1.41 1.41 1.41 1.41
It is interesting to compare this variation found 'after following a system of assortative mating until equilibrium is reached with that found in a case in which complete homozygosis has been reached by inbreeding. I n the latter case, the various pairs of allelomorphs are fixed independently
1
of each other. Thus i2 =
-.
If all heterozygosis has been eliminated,ASSORTATIVE MATING BASED ON SOMATIC RESEMBLANCE 155
A B
A b
=
'
3
= n. This is just twice the value of uB2 in the original ran-i 2
dom-bred population, regardless of the number of factors.
The preceding table gives the ratio of the genetic element in the stan- dard deviation under various conditions to that found under random mating.
COMPOSITION O F THE POPULATION
Assortative mating based on resemblance leads to a composition of the population very different from that reached by inbreeding. With perfect assortative mating of the former kind, a two-factor population is con- verted ultimately into only two extreme types, A A B B and aabb. With inbreeding, all homozygous types (AABB, AAbb, aaBB and aabb) tend equally toward fixation.
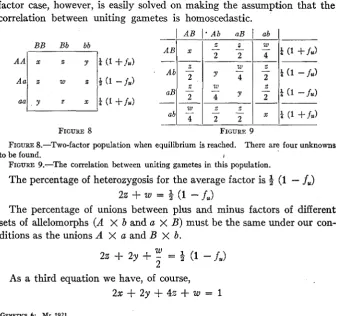
The composition of the population when equilibrium is reached under assortative mating which is not perfect, is a question of some interest. No general solution can be given, since there are different ways of mating which give the same correlation between mates. The symmetrical two- factor case, however, is easily solved on making the assumption that the correlation between uniting gametes is homoscedastic.
I A B I * A b aB 1 ab I
x t (1 +fu)
--
8 W
t
(1 - fio Y - Z-j- B B Bb bb
FIGURE 8
FIGURE 8.-Two-factor population when equilibrium is reached.
FIGURE 9.-The correlation between uniting gametes in this population.
There are four unknowns
to be found. I
The percentage of heterozygosis for the average factor is
4
(1-
f,)
The percentage of unions between plus and minus factors of different sets of allelomorphs ( A X b and a X B ) must be the same under our con- ditions as the unions A X a and B X b.
22
+
w =4
(1 -f,)22
+
2y+
?.!
=4
(1-
f u ) 2As a third equation we have, of course, 2 ~ + 2 y + 4 2 + w = 1
156 SEWALL WRIGHT
1 A A
0 An
1 aa
The expression for the correlation between uniting gametes is consistent with the three preceding equations, but does not add the required inde- pendent equation. If, however, we assume as suggested above that the arrays of A B , Ab, aB and ab are equally variable, we get:
5 32 26 63
32 104 32 168
26 32 5 63
uT is the standard deviation of all gametes and f is, as before, the correlation between uniting gametes. The left-hand member is the
m
squared standard deviation of the array of Ab's. Since fu = ___
4 - 3 m
a n d f = - 2*u under equilibrium, we obtain:
1 + f u
4 (1 - m)2 (2 - m) (4
-
3 m)2w=2[-- 1 - m - 2 y = -
4 z =
1
4 - 3 m
W
x = 3 - 3 y - - 2 . 2
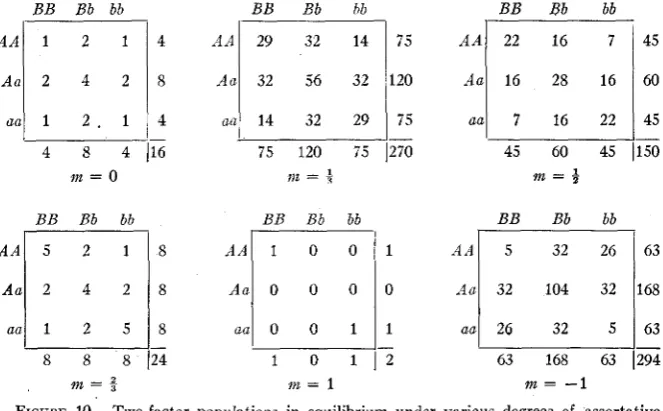
From these equations, we can find the composition of our ideal two- factor population when equilibrium is reached under assortative mating of any required degree. A number of examples are given below.
BB Bb bb BB Bb hb BB Bb bb
A a 2
aa 2 . aa
4 8 4 1 1 6 75 120 75
1%
45 60 45+n = 0 BB Bb bb
:E
aa8 8 8
m = $
nt = 4
BB Bb bb
8 8
8
:E
aa-
4 1 0 1
m = l
BB Bb bb
I I
-
2 ' 63 168 63
1%
m = -1
FIGURE 10.-Two-factor populations in equilibrium under various degrees of assortative
ASSORTATIVE MATING BASED ON SOMATIC RESEMBLANCE 157
DOMINANCE
I n the cases with which we have dealt so far, we have assumed a con- stant degree of assortative mating. This is not a necessary limitation. The coefficient can be changed each generation if desired.
If dominance is present, we have a case in which a constant correlation as regards external characters brings about a changing correlation with respect to zygotic constitution. It has been shown in the first paper of this series that if A and a are equally numerous, and A is completely dominant, the correlation between zygotic constitution and somatic char- acter with respect to one factor is
.
,
4
1 Unfortunately this simple formula applies to multiple factors only when these are combined a t ran- dom, which is not true after a generation of assortative mating. We willnot attempt here to go into the complexities of the general problem of assortative mating where there is dominance. The one-factor case, how- ever, is of considerable interest. I t would be met where there is only ofie dominant Mendeliap difference of importance, but overlapping of class ranges from non-genetic causes.
If there is complete determination by heredity and perfect assortative mating, h‘2rPP = 1, and
p
= -e’’
The resulting series of values for the1
+
P’
percentages of heterozygosis, (%),
+,
a,
2,
Q
. . .
0, agrees with that given by JENNINGS (1916) for this case. The values in certain cases in which there is not perfect assortative mating are given in table 2.ASSORTATIVE MATING WITH INBREEDING
I n practical live-stock breeding, assortative mating is likely to be accom- It is thus important to panied by a certain amount of close-breeding.
find the effects of the combination of these two systems of mating.
TABLE 2 Percentage of heterozygosis. n=l n=l Domi- No domi nance nance --__ 0.500 0.500 0.333 0.250 0.250 0.125 0.200 0.063 0.167 0.031 0.143 0.016 0.083 0.001 0.059 0.000 0 0 GENERA'MON
n=l Domi- nance 0.500 0.367 0.315 0.291 0.281 0.275 0.270 0.270 0.270
0 1 2 3 4 5 10 15 m
n=l n=4 No domi- No dom nance nance ~-~ 0.500 0.500 0.300 0.450 0.220 0.430 0.188 0.414 0.175 0.402 0.170 0.391 0.167 0.357 0.167 0.343 0.167 0.333
i
PERFECT ASSORTATIVE MATING m = 1.00 n=4 Vo domi-nance 0.500 0.438 0.406 0.379 0.354 0.330 0.233 0.165 0 n=10 No
domi
nance
--
0.500 0.4'15 0.462 0.451 0.439 0.428 0.3'16 0.330 0
- n=2 To
domi
nance
n=1
No
domi-
nance 0.500 0.750 0.625 0.687 0.656 0.672 0.667 0.667 0.667
0.500 0.375 0.312 0.266 0.227 0.193 0.088 0.040 0
n=4 No domi- nance
--
0.500P
8
0.531
E
0.563 0.535 0.533 0.533 0.533 0.533 0.533
IMF'ERPECT
ASSORTATIVE
YATING
__ n=l Domi- nance 0.500 0.417 0.397 0,392 0.391 0.391 0.390 0.390 0.390
m
=
0.50
- n=l
Jo
dom
nance 0.500 0.375 0.344 0.336 0.334 0.333 0.333 0.333 0.333
- n=4
Vo
dom.
nance 0,500 0.469 0.461 0.456 0.453 0.450 0.445 0.444 0.444
__ PERFECT NEGATIVE ASSORTATIVE UATING m = - 1.00
ASSORTATIVE MATING BASED ON SOMATIC RESEMBLANCE 159
With most systems of inbreeding, we have found it possible to express the correlation between uniting gametes in terms of this correlation in previous generations
.
B ro ther-sister Double first cousins Quadruple second cousins
One male, many half-sisters j = $ (6j’
+
j”+
1)Half-first cousins Second cousins
f
=4
( 2 j f+f”
+
1)f =
+
(4f’+
2f” + j f ”+
1)j =
272
(4f”+
jf”+
1)j = i&(8jff
+
2 y+
f f f f f+
1) j =9%
(Sj’+
4 j f f ’ + 2jff’ + j f ” ’+
1)I n general let f=(a(fl)
With assortative mating, there will be a correlation between uniting gametes, as regards one set of allelomorphs, equal to that between uniting factors of different sets in addition to the correlation due to inbreeding (figure 5 ) .
Thus, As before,
f u = f u
+
(a (jt3gu =
fi
K u =
$:(z
+
Ki)
j , = - [ 1 + f i + 2 ( n - m l ) K u ] - - (a
(fi)
2n n
2 nj,
+
2 cp(L)
hl4‘**
= hf2 [l+
ji
+
2 (n-
1) K,]When equilibrium is reached
TABLE 3 Correlation between parent and offsfling. PERFECT ASSORTATIVE MATING rpp 1.00, h2 = 1.00, = 1.00 GENERATION IXPERFECT ASSORTATIVE MATING rpp = 0.80, h2 = 1.00, m = 0.80 pp - 0.50, hz = 1.00,
I
'
- m = 0.500 1 2 3 4 5 10 15 03
0.333 0.577 0.707 0.774 0.817 0.845 0.913 0.939 1.000
GENERA TI ON -~~-__-~__-____ 0.500 0.500 0.500 0.500 0.333 0.500 0.500 0.333 0.500 0.50( 0.816 0.816 0.816 0.816 0.533 0..760 0.760 0.463 0.671 0.671 0.926 0.894 0.880 0.872 0.633 0.852 0.814 0.520 0.732 0.70: 0.966 0.926 0.909 0.900 0.673 0.882 0.839 0.534 0.745 0.72: 0.984 0.945 0.928 0.919 0.692 0.893 0.854 0.538 0.749 0.73: 0.992 0.957 0.941 0.932 0.700 0.897 0.865 0.539 0.750 0.73' 1.000 0.985 0.972 0.963 0.708 0.900 0.888 0.539 0.750 0.741 1.000 0.995 0.984 0.976 0.709 0.900 0.896 0.539 0.750 0.75 1.000 1.000 1.000 1.000 0.709 0.900 0.900 0.539 0.750 0.751
0 1 2 3 4 5 10 15 m
0.333
0
0.500
0.500
000 000 000 000 000 000 000
0 '0 ASSORTATIVE MATING PERFECT ASSORTATIVE MATING rpa = 1.00, h2 = 1.00, ,,$ = 1.00 rpp = 0.80, ha = 1.00, rpp = 0.50, h* = 1.00, m = 0.80
I
m = 0.50c. o\
ASSORTATIVE MATING 0 PERFECT NEGATIVE rpp = - 1.00, ha = 1.00, m = - 1.00 PERFECT NEGATIVE ASSORTATIVE MATING rpp = - 1.00, hz = 1.00, ?n = - 1.00 n=l n=l n-4 Domi-
1
d:Gi-1
domi- No. nance nance nance0.333 0.417 0.583 0.675 0.733 0.774 0.872 0.910
i
1.000ASSORTATIVE MATING BASED ON SOMATIC RESEMBLANCE 161
As an illustration, take the case of assortative mating of
4,
in part accounted for by the mating of second cousins, and assume that four factors are involved, we getfu = = 0.1373
p
= $ (1 -fu) =%f
= 0.4314At the equilibrium point for second-cousin matings :
j = 5% 0.0189
p
= %$ = 0.4906At the equilibrium point for assortative mating of
4
with four factors:j =
9
= 0.1111p
= $ = 0.4444I t will be seen that the divergences due to the combination of inbreed- ing and assortative mating is somewhat less than the sum of those which would result from these systems of mating alone when the latter are both small.
A system of inbreeding in which complete homozygosis is approached, would permit in practice a continuously increasing degree of assortative mating. The rate at which lcharacters can be fixed is thus much increased by combining t h e two systems of mating,
LITERATURE CITED
JENNINGS, H. S., 1916 The numerical results of diverse systems of breeding. Genetics 1: 53-89.
1917 The numerical results of diverse systems of breeding with respect to two pairs of
Genet- WENTWORTH, E. N., AND REMICK, B. L., 1916 Some breeding properties of the generalized WRIGHT, S., 1921 a Systems of mating. I. The biometric relations between parent and off-
1921 b Systems of mating. 11. The effects of inbreeding on the genetic composition of
characters, linked or independent, withspecial relation to the effects of linkage.
ics 2: 97-154.
Mendelian population.
spring. Genetics 6: 111-123.
a population. Genetics 6: 124-143.
Genetics 1 : 608-616.