INVESTIGATION
Genotype Imputation Reference Panel Selection
Using Maximal Phylogenetic Diversity
Peng Zhang,*,1Xiaowei Zhan,†Noah A. Rosenberg,‡and Sebastian Zöllner†,§,1 *Department of Computational Medicine and Bioinformatics,†Department of Biostatistics, and§Department of Psychiatry, University of Michigan, Ann Arbor, Michigan 48109, and‡Department of Biology, Stanford University, Stanford, California 94305
ABSTRACTThe recent dramatic cost reduction of next-generation sequencing technology enables investigators to assess most variants in the human genome to identify risk variants for complex diseases. However, sequencing large samples remains very expensive. For a study sample with existing genotype data, such as array data from genome-wide association studies, a cost-effective approach is to sequence a subset of the study sample and then to impute the rest of the study sample, using the sequenced subset as a reference panel. The use of such aninternal reference panel identifies population-specific variants and avoids the problem of a substantial mismatch in ancestry background between the study population and the reference population. To efficiently select an internal panel, we introduce an idea of phylogenetic diversity from mathematical phylogenetics and comparative genomics. We propose the“most diverse reference panel”, defined as the subset with the maximal“phylogenetic diversity”, thereby incorporating individuals that span a diverse range of genotypes within the sample. Using data both from simulations and from the 1000 Genomes Project, we show that the most diverse reference panel can substantially improve the imputation accuracy compared to randomly selected reference panels, especially for the imputation of rare variants. The improvement in imputation accuracy holds across different marker densities, reference panel sizes, and lengths for the imputed segments. We thus propose a novel strategy for planning sequencing studies on samples with existing genotype data.
G
ENOTYPE imputation is an essential component of modern genetic association studies. This technique en-ables direct testing of untyped markers for associations with phenotypes of interest, thereby increasing the power to iden-tify causal variants in association studies (Li et al. 2009). Imputation is especially useful in meta-analyses that com-bine data from genome-wide association studies (GWAS) conducted using different genotyping platforms (Zeggini et al. 2008; Scottet al.2009). Moreover, genotype imputa-tion performed using study-specific sequenced samples en-ables analysis of rare variants in large GWAS-genotyped data sets (Zawistowskiet al.2010).Imputation methods typically use a reference panel of densely genotyped haplotypes to predict the missing geno-types in a less densely genotyped study sample. The choice of the reference panel then influences the imputation
accuracy obtained in the study sample. It has been observed that in general, imputation accuracy is higher when the reference panel and the study sample derive from the same or similar populations than when they are from substantially different groups (Huanget al.2009, 2011). However, high-diversity reference panels also contribute to increased impu-tation accuracy. Huang et al. (2009) found that increasing reference panel diversity by incorporating a mixture of dif-ferent HapMap populations could improve imputation accu-racy in comparison with the use of only a single HapMap population. Similarly, in imputing a study sample from a Brit-ish birth cohort, Jostins et al.(2011) found that adding to the reference panel a proportion of HapMap samples from other populations (e.g., taking 17% of the reference panel from Toscani or 22% from Chinese and Japanese) yielded a higher imputation accuracy than using Northern European samples alone.
Most studies performed to date have selected refer-ence panels from external databases such as the Interna-tional HapMap Consortium (InternaInterna-tional Haplotype Map Consortium 2005; Frazer et al. 2007) and 1000 Genomes Project (1000 Genomes Project Consortium 2010). Dramatic reductions in sequencing cost now enable an alternative
Copyright © 2013 by the Genetics Society of America doi: 10.1534/genetics.113.154591
Manuscript received June 21, 2013; accepted for publication July 18, 2013 Available freely online through the author-supported open access option.
1Corresponding authors: Biostatistics Department, University of Michigan, 1415
strategy: to select aninternalreference panel for genotype imputation, that is, to sequence a subset of the study sample itself and then to use the sequenced subset as a reference panel for imputing the rest of the study sample. Using ref-erence sequences derived from the study sample can prevent a mismatch in ancestral background between the study pop-ulation and the reference poppop-ulation. It also enables novel variants distinctive to the study sample to be imputed. Employing sequences from a candidate gene and the 1000 Genomes Project, Fridley et al. (2010) demonstrated the feasibility of imputing genetic variants based on a sequenced proportion of a study sample, and they suggested sequenc-ing “the largest and most diverse”subset. In a theoretical study, Jewett et al.(2012) found that including sequenced haplotypes from the study population in the reference panel improved imputation accuracy, even if the external panel was taken from a closely related population. Here, we de-velop criteria for the selection of an internal reference panel for genotype imputation. Our goal is tofind a sensible ap-proach for choosing an internal reference panel from the study sample, with the aim of (1) maximizing the number of polymorphic sites identified in the study sample and (2) achieving the maximal imputation accuracy.
The identification of maximally diverse subsets of a larger set of individuals has been a goal in other areas of genetics, such as in choosing diverse sets of plant accessions for inclusion in core collections targeted for agronomic de-velopment or experimental use (Brown 1989; McKhann et al. 2004; Reeves et al. 2012) and in choosing diverse species sets for biodiversity conservation (Faith 1992; Steel 2005) and genome sequencing (Pardi and Goldman 2005). In selecting a set of imputation templates, we borrow the concept of“phylogenetic diversity”, which, for a given subset of a larger set of taxa, measures the fraction of the total branch length of an evolutionary tree of the larger set that is included in the restriction of the tree to the taxon subset (Faith 1992; Nee and May 1997; Steel 2005). Conditional on a tree of n taxa, Pardi and Goldman (2005) and Steel (2005) proved that among all possible subsets of sizem#n taxa from the larger set, the globally maximal phylogenetic diversity can be obtained by a greedy algorithm. This greedy algorithm provides a computationally efficient solution to a form of combinatorial optimization problem that can usu-ally be solved only via exhaustive analysis of all possible subsets. Further, if it becomes possible for investigators to increase the number of sequenced samples, for example, by an increase in budget, then the greedy algorithm guarantees that all of the previously selected individuals will be in-cluded in the larger optimal subset (Pardi and Goldman 2005).
We propose the use of the most diverse reference panel for genotype imputation, adapting the greedy algorithm for maximizing phylogenetic diversity in our selection of an internal reference panel. We assume phased diploid individ-ual genotypes are available, as phasing is not our focus. We approximate the ancestral relationships of haplotypes by
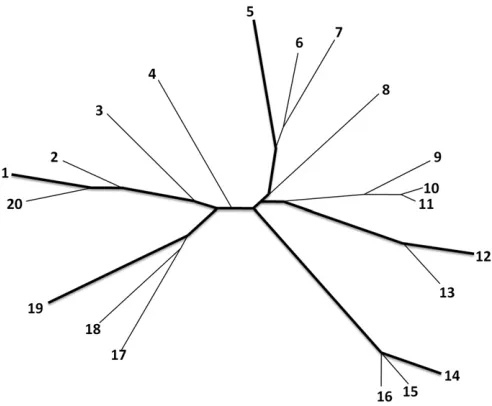
constructing a neighbor-joining phylogenetic tree (Saitou and Nei 1987), using the pairwise Hamming distance matrix between the haplotypes in a study sample (Figure 1). We next apply the greedy algorithm of Pardi and Goldman (2005) and Steel (2005) to identify the subset at a given size with the maximal phylogenetic diversity conditional on the tree. The haplotypes chosen by our method are spread across the tree and tend to have long external branch lengths (Figure 1, thick lines), as our method prioritizes in-dividual sequences that are more differentiated. We expect that in comparison with a random subset, the subset that is most phylogenetically diverse at the genotyped markers also carries a larger number of polymorphic sites that can be identified by sequencing and that are then available for im-putation into the remaining sample when this subset is used as a reference panel. Thus, it can be predicted that this strategy enables more variants to be imputed in the study sample than does the use of a randomly selected reference panel.
To evaluate the performance of our “most diverse refer-ence”panel in genotype imputation, we simulate sequences and create study samples similar to those observed in GWAS by masking the genotypes for a number of single-nucleotide polymorphisms (SNPs). We then impute the masked geno-types in the study sample by using either the most diverse reference panel or randomly selected reference panels. We also apply the“most diverse”method to sequences of Euro-pean ancestry from the 1000 Genomes Project. The results from both the simulated sequences and the 1000 Genomes Figure 1 Illustration of the selection of the most phylogenetically diverse reference panel. Shown is the phylogenetic tree constructed from 20 simulated haplotypes as well as the most diverse subset offive taxa (thick lines). The selection algorithmfirst selects the most distant pair of taxa and then identifies haplotypes that are most distant conditional on the haplotypes already selected. To choose thefive taxa, the greedy algorithm
sequences show that the most diverse reference panel con-sistently provides higher imputation accuracy, independent of imputation lengths, reference panel sizes, and marker den-sities in the study sample. We thus provide a cost-effective strategy for designing sequencing studies for samples with existing genome-wide genotype data. As of 2013, thousands of GWAS have been performed, with.1 million genotyped individuals (http://www.genome.gov/gwastudies/). Effective use of these genotype data will make it possible to carry out large-scale sequencing studies on these individuals in silicowith a limited budget.
Materials and Methods
Phylogenetic diversity
We use notation similar to that of Steel (2005). Assume a study sampleT ofnhaploid individuals, each containing q polymorphic sites that are genotyped for k ,q variable sites (referred to as markers) in a region of interest. We consider haploid data (phased diploid individuals for humans), as we do not focus on phasing. Based on the gen-otypes at those k markers, we aim to identify a subset S ⊂ Tof sizem#nto be sequenced. Sequencing reveals r#q2kadditional variable sites in themindividuals.Sis then used as a reference panel to impute the genotypes of thesersites in the remainingn2mindividuals in the study sampleT.
To identify the optimal selection of S, let XT be an
unrooted tree constructed using all haplotypes inT on the basis of the k markers. Let lT be the sum of the branch
lengths for all edges of XT. We denote by XSthe induced
tree obtained by restricting XTto only the haplotypes in S
and bylSthe sum of the branch lengths ofXS. Form$2, we
define the size-m subset of T with maximal phylogenetic diversity aspdm:
pdm¼arg maxflS:S4T and jSj ¼mg:
Identifying the subset with maximal diversity
To find pdm, we first generate an unrooted tree from the
study sample T. Based on the genotypes of thek markers, we compute the Hamming distances between individual haplotypes and construct a pairwise distance matrix for T. Using this distance matrix, we construct a tree using the neighbor-joining (NJ) method, which recursively agglomer-ates pairs of nodes until all nodes have been incorporated into the tree (Saitou and Nei 1987). On this tree, we apply a greedy algorithm to identify the subsetSwith sizemthat has the maximal phylogenetic diversity. Briefly, wefirst se-lect the pair of haplotypes with the greatest distance on the tree and add the pair toS. We then sequentially incorporate as the next haplotype inSthe haplotype that adds the max-imal length to the chosen tree at that step, repeating the process untilSreaches size m. Pardi and Goldman (2005) and Steel (2005) proved that conditional on the tree, the
subset chosen according to this greedy algorithm has the maximal phylogenetic diversity.
Simulations
We analyze simulated data sets to evaluate the performance of the “most diverse reference panel”in genotype imputa-tion. We independently generate 50 data sets of 2000 hap-lotypes each with the program ms, a coalescent-based sequence sampling program, under the neutral Wright– Fisher model (Hudson 2002). We assume a basic popula-tion-genetic model with constant effective population size Ne = 10,000, a mutation ratem = 1.028per site per gen-eration, and a recombination rate r = 1.028 per site per generation. We remove singletons from the simulated sequences to create the “true” imputable sequence data. All simulated sites are assumed to have at most two alleles. Emulating the density of current genotype arrays, we select the marker panel of the study sample (the“genotype data”) by randomly choosing 300 markers per megabase that have minor allele frequency (MAF) . 0.1 in the sequence data. We mask the genotypes for the remaining sites, which become the set of sites that will be imputed. We simulate haplotypes of length 1 Mb, imputing the middle 100 kb while keeping the genotypes for the marker panel in both 450-kbflanking regions to improve imputation accuracy and to avoid edge effects (Liet al. 2010). Based on these simu-lated marker genotype data sets, we apply our algorithm on the marker panel to obtain the most diverse reference panels of 200 haplotypes. To evaluate the performance of the most diverse reference panel, for each of the 50 simulated data sets, we generate 1000 random reference panels, by sam-pling without replacement 200 haplotypes each from the sequence data for comparison. Additionally, to model dip-loid samples, we assume that if one of the two chromosomes in a diploid individual is in the panel of most diverse hap-lotypes, both chromosomes are sequenced. We form the“ di-verse diploid panel”by ranking haplotypes with the greedy algorithm and incorporating diploid individuals into the panel who carry at least one of the top ranked haplotypes until we reach the number of diploid individuals we plan to sequence (100 in experiments that compare to the 200 most diverse haplotypes). In each selected reference panel, we unmask all imputable sites and use the resulting sequences as references for genotype imputations. For each data set, we perform one imputation with the most diverse reference panel, one imputation with the diverse diploid reference panel, and one imputation with each of the 1000 randomly selected reference panels.
haplotypes among a total of 2000 haplotypes. We also vary the number of genotyped markers from 300 to 1000 in a 1-Mb region in a study sample. For each scenario, we simulate 50 data sets of 2000 haplotypes each. For each data set, we perform one imputation with the most diverse reference panel and 50 imputations with randomly selected reference panels.
Based on previous comparisons among imputation meth-ods (Haoet al.2009; Nothnagelet al.2009; Peiet al.2010), we employminimac(Howieet al.2012) as one of the best-performing methods. This method is an extension of MaCH (Liet al.2010) for phased diploid data. To assess imputation accuracy on heterozygous genotypes, we then create n/2 diploid individuals by randomly combining pairs of haplo-types from the entire study sample. After imputation, we evaluate the predicted imputation accuracy by examining for each selected reference panel the mean of the estimated correlation coefficient^r2across all markers. To evaluate the imputation accuracy of therimputed sites for the n/2 dip-loid individuals in the imputed data sets, we compute two measures for the discordance rate between the imputed gen-otypes^gijand the simulated genotypesgij at variant sitejin
target individuali. We allow^gijandgij to equal 0, 1, and 2,
based on their numbers of copies of one specific allele. First we calculate the discordance rate Dacross all sites:
D¼ Pn=2
i¼1 Pr
j¼1gij2^gij
nr :
As this error function is strongly affected by the minor allele frequencies of the variant sites examined (Huang et al. 2009), we also calculate imputation errors across all hetero-zygous genotypes (gij¼1):
H¼ Pn=2
i¼1 Pr
j¼11gij¼1gij2^gij
2Pni¼=21Prj¼11gij¼1
:
Note that the evaluations use alln/2 simulated diploid indi-viduals, both those with one or two haplotypes in the refer-ence panel and those with two haplotypes that are imputed.
The 1000 Genomes Project data
We apply our method to sequence data from the 1000 Genomes Project. We consider the phased data of 381 diploid individuals (762 haplotypes) with European (EUR) ancestry, including 87 Utah residents with Northern and Western European ancestry (CEU), 93 Finnish from Finland (FIN), 89 British from England and Scotland (GBR), 14 Iberian populations in Spain (IBS), and 98 Toscani in Italy (TSI) (http://www.sph.umich.edu/csg/abecasis/MACH/
download/1000G-PhaseI-Interim.html, the 1000G
In-terim Phase I Haplotypes 11/23/2010 release). We remove singletons from the sample, selecting eight 100-kb regions that are approximately evenly distributed across chromo-some 20. We create study samples, using a similar procedure
to that for the simulation above: for each region, we add a 450-kbflanking region on each side, randomly choose300 genotyped SNPs per megabase among markers with MAF$ 0.1, and mask the genotypes of all other sites. In each re-gion, we select the most diverse 160 haplotypes from the set of 762 total haplotypes as the diverse reference panel. For comparison, we sample without replacement 1000 random reference panels of 160 haplotypes each.
We next consider the entire chromosome 20 and create a study sample, using the same procedures as in the 100-kb regions. We select the most diverse reference panel using our method and 50 reference panels randomly without replacement. Using the selected reference panels, we impute all the masked genotypes and compute the discordance rate for each imputation.
Results
Number of imputed sites
Polymorphic sites in reference panels: Only sites that are polymorphic in the reference panel can be imputed into the remaining study sample. Hence, wefirst evaluate the number of polymorphic sites in the reference panels selected. For each of the 50 simulated data sets, we choose one random reference panel and compare it to the most diverse reference panel. Wefind that for a total of 12,957 masked sites that are polymorphic in the study samples across the 50 data sets, 9642 sites (74.41%) are polymorphic in both types of reference panels. Among the remaining sites, 1492 sites (11.52%) are polymorphic only in the most diverse reference panels, whereas 760 sites (5.87%) are polymorphic only in the randomly selected reference panels. Thus, on average, 5.65% more sites are polymorphic in the most diverse reference panels than in the randomly selected reference panels.
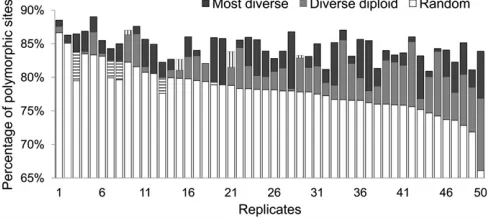
Polymorphic sites in imputed data sets:To ensure that the higher number of polymorphic sites in the most diverse reference panels also leads to a higher number of imputed polymorphic variants, we count the number of imputed sites that are polymorphic in data sets imputed with reference panels generated under three different selection strategies: (1) sampled at random, (2) selecting the 200 most diverse haplotypes, and (3) selecting the diploid individuals carry-ing the most diverse haplotypes (diverse diploid reference panel). As it is not currently practical to sequence only one chromosome in a diploid individual, strategy 3 represents a scenario in which the individuals that carry the most diverse haplotypes are identified and both of their chromo-somes are sequenced.
panels (78.34%). Figure 2 shows percentages of polymor-phic sites in data sets imputed with the three reference types across the 50 data sets. In each of the 50 data sets, imputa-tion with the most diverse reference panel captures more polymorphic sites than imputation with the random refer-ence panel. The improvement by using the most diverse panel is greater when the randomly selected panel captures only a low percentage of polymorphic sites (e.g., replicates 46–50). Imputations with the diverse diploid panels result in higher percentages of polymorphic sites than with the ran-dom panels in 42 of the 50 data sets (84%) and in a higher percentage of polymorphic sites than with the most diverse panel in 4 of the 50 data sets (8%). Only in 4 data sets does the random reference panel perform substantially better than the diverse diploid reference panel (replicates 1, 2, 3, and 6) and in all these cases, the random panel captures a high (.83%) percentage of polymorphic sites.
Imputation accuracy
As a measurement of imputation accuracy, we evaluate the discordance rate between the simulated genotypes and the imputed genotypes for the 50 simulated data sets. For each data set, we compare the accuracy of the imputation using the most diverse reference panel to the empirical distribution of imputation accuracies from 1000 random reference panels.
Estimated imputation quality:A predictor for the accuracy of an imputed site generated by minimac is the^r2, a quantity calculated by comparing the variance of observed genotype scores with the variance of expected genotype scores to es-timate the squared correlation at a marker between the true allele counts and the estimated allele counts (Liet al.2010). To compare this predicted imputation accuracy between the different choices of reference panels, we compute the av-erage^r2across the 12,957 total imputed sites across the 50
data sets. For imputations with the most diverse reference panels and the diverse diploid reference panels, we gener-ate one value of ^r2 for each site; to evaluate imputations with the 1000 randomly selected reference panels for each data set, we compute the mean^r2for each site across 1000 imputations, and we then calculate the average across all imputed sites. Sites imputed with the most diverse refer-ence panels have the highest mean^r2(0.784), followed by sites imputed with the diverse diploid reference panels (0.758). Sites imputed with randomly selected reference panels have the lowest mean^r2 (0.723). As removing var-iant sites with ^r2,0:3 filters most poorly imputed sites (Li et al.2009), we also compare the number of sites that pass this imputation quality threshold. Across the 50 data sets, we observe that a higher percentage of sites imputed with the most diverse reference panels pass the threshold (83.17%) compared to sites imputed with the diverse dip-loid reference panels (80.53%) and sites imputed with the randomly selected panels (77.48%). For a higher^r2 thresh-old of 0.8 applied by typical association studies, 76.63% of sites pass the threshold for imputations with the most diverse reference panels, 74.76% for the diverse diploid ref-erence panels, and 59.65% for the randomly selected refer-ence panels.
Discordance rates: For each simulated data set, we sepa-rately calculate discordance rates for all sites imputed with the most diverse reference panel, sites imputed with the diverse diploid reference panel, and the mean values for sites imputed with random reference panels, where the mean is taken across all 1000 random panels. Using the most diverse reference panel results in the lowest mean discordance rate across the 50 replicates (0.0019), followed by imputation with the diverse diploid reference panel (0.0022). Both quantities are lower than the mean discor-dance rates of imputation with the random reference panels (0.0031) (Figure 3). Ranking the discordance rate of se-lected reference panels together with the discordance rates of 1000 random panels from the lowest to the highest value, the most diverse reference panel is a clear outlier for 24 of the 50 data sets (48%), having a lower discordance rate than imputations with all 1000 randomly selected reference panels (rank 1). Across all 50 data sets, the mean rank of the most diverse reference panel is 13.5, ranging from 1 to 135 among 1001 panels. Across the same 50 data sets, the mean rank of the diverse diploid reference panel is 111.9, ranging from 1 to 906 among 1001 panels.
To generate a more meaningful discordance measure for low-frequency variants, we compare the imputed genotypes and the simulated true genotypes across sites for which the true genotypes are heterozygotes. While the heterozygote discordance rate is higher than the overall discordance rate, the mean heterozygote discordance across the 50 replicates is again the lowest for sites imputed with the most diverse reference panels (0.0097), followed by the diverse diploid reference panels (0.0121) and the random reference panels Figure 2 Percentages of polymorphic sites in data sets imputed with
(0.0165). Comparing across frequency bins, we observe that for all reference selection strategies, the heterozygote discor-dance rate decreases with increasing allele frequency. The mean heterozygote discordance rate across the 50 replicates for low-frequency variant sites (0,MAF,0.1) is consider-ably higher than the overall mean discordance rate for all heterozygote sites across the 50 replicates (0.0258 for the most diverse reference panels, 0.0329 for the diverse diploid reference panels, and 0.0415 for the random reference pan-els). In all frequency bins, considering heterozygote discor-dance rates, imputations with the most diverse reference panels generate the lowest discordance rates and imputations with the randomly selected reference panels generate the highest discordance rates, while imputations with the diverse diploid reference panels generate intermediate discordance rates (Figure 3). Combining the heterozygote discordance rate of the most diverse reference panel with the heterozy-gote discordance rates of 1000 random panels for each of the 50 simulated data sets and ranking from the lowest to the highest heterozygote discordance rate, the mean rank of the most diverse panel across all 50 data sets is 17.5 when comparing all heterozygote sites, 27.3 for sites with 0 , MAF , 0.1, 115.7 for sites with 0.1 # MAF , 0.2, and 68.5 for sites with 0.2 # MAF # 0.5 among 1001 panels ranked. When comparing the diverse diploid reference panel to random panels, the mean rank across all 50 data sets is 147.9 for all heterozygote sites, 188.0 for sites with 0 , MAF , 0.1, 163.9 for sites with 0.1 # MAF , 0.2, and 145.9 for sites with 0.2#MAF#0.5.
Imputation accuracy under different simulation settings
To assess the robustness of our results, we evaluate the performance of the most diverse reference panel under
different simulation settings, considering different tar-get sequence lengths, different reference panel sizes, and different marker densities in the study sample. We first investigate whether the lengths of the target regions affect the performance of the most diverse reference panels in imputations. We impute regions with lengths of 100 kb, 500 kb, 1 Mb, and 2 Mb, using both the most diverse reference panel and 50 random reference panels, each of which is compared to the true underlying genotypes; the mean of the 50 discordance rates is then compared with the discordance rate for the most diverse reference panel. As shown in Figure 4A, across the four different lengths, we observe little effect of the imputation length on the discordance rate. The mean discordance rate across the 50 replicates for each group ranges from 0.0028 (2 Mb) to 0.0037 (500 kb) for the most diverse reference panel and from 0.0052 (2 Mb) to 0.0058 (100 kb) for the random reference panels. For all sequence lengths considered, the most diverse reference panels pro-vide lower discordance rates than the randomly selected reference panels.
Second, we evaluate how the reference panel sizes affect the performance of the most diverse reference panel by comparing the genotype discordance rates for reference panels of size 100, 200, 300, 400, and 500 haplotypes. For both reference panels, the mean discordance rate across the 50 replicates decreases with larger reference panel sizes, from 0.008 to 0.0006 for the most diverse panel and from 0.009 to 0.0015 for the random reference panels. Especially for a reference panel of size 100 individuals, the discordance rate is considerably higher than for larger panel sizes. Across all reference panel sizes, imputations with the most diverse reference panels consistently provide lower discordance rates than do imputations with the randomly selected reference panels (Figure 4B).
Third, we examine how the number of markers geno-typed initially in the study sample affects the performance of the most diverse reference panel by varying the density of markers in the study sample, considering 200, 300, 400, 500, 600, and 1000 markers per 1-Mb region. For both types of reference panels, the mean discordance rate across the 50 replicates decreases with a higher density of markers in the study samples, from 0.0055 to 0.0015 for the most diverse panel and from 0.0072 to 0.0023 for the random reference panels. Across all marker densities in the study sample, the most diverse reference panels consistently provide lower discordance rates than the randomly selected reference panels (Figure 4C). We also observe that the improvement in discordance rates for the most diverse reference panel over the randomly selected panels slightly decreases with more markers genotyped in the study sample.
Allele frequency bias and genotyping error
As the most diverse panel incorporates more variable sites than a randomly selected panel, it is plausible that the allele frequencies in the data sets imputed using the most diverse panel might systematically differ from allele frequencies in Figure 3 Box plots of discordance rates between imputed genotypes and
the simulated data sets or from those in data sets imputed using the randomly selected panels. To confirm that there is no such allele frequency bias, we compute allele frequency estimates in data sets imputed by the most diverse panels and data sets imputed by the random panels and compare them to the true allele frequencies in the simulated data sets.
Wefirst estimate the bias for each type of reference panel by calculating the difference between the estimated and the true allele frequency for each locus and then averaging this difference across all loci in a MAF bin. As shown in Table 1, both imputation with a random panel and imputation with the diverse panel generate a subtle underestimate of allele frequency. The mean biases across loci from data sets im-puted using the most diverse panel are smaller than the mean biases from data sets imputed with random panels for every MAF bin except the bin with 0.1 , MAF# 0.5. Second, we calculate the mean squared error (MSE) of the estimated MAF for each locus and each reference panel and then calculate the average MSE in each MAF bin. The MSEs in data sets imputed with the most diverse panels are smaller than the MSEs in data sets imputed with the ran-domly selected panels across all loci and in every MAF bin except for the bin with 0.05,MAF#0.1. Based on these results, we show that the most diverse panel provides less bias and more confident estimates of allele frequencies than a randomly selected panel, especially for less common variants.
To evaluate the robustness of the most diverse reference algorithm to the presence of genotyping errors, we intro-duce genotype error uniformly at random to each of the 50 simulated genotype data sets and generate the most diverse subset based on the modified genotypes. We evaluate the selected subset by comparing a measure of its true diversity to that of the corresponding diversity of the subset gener-ated without genotyping error.
For each of the 50 simulated data sets, we introduce genotyping error uniformly at random, using rates of 0.1%, 0.5%, and 1% for each site in the study samples, and we generate one new data set at each of the error rates. We then select a new most diverse subset of size 200 haplotypes for each of the data sets with genotyping error. After that, we compute the subtree length of the new diverse subset on the tree constructed with imperfect genotyping (imperfect sub-tree) and compare it to the subtree length of the original diverse set generated without genotyping error (optimal subtree). Our results show that with a genotyping error rate of 0.10%, the length of the imperfect subtree is nearly identical to the length of the optimal subtree (ranging between 99.65% and 100% of the optimal subtree length, with a mean of 99.99%). For a genotyping error rate of 0.50%, the length of the imperfect subtree ranges between 92.14% and 99.3% of the optimal subtree length, with a mean of 96.65%. For a genotyping error rate of 1%, the length of the imperfect subtree ranges from 90.11% to 98.29% of the optimal subtree length, with a mean of Figure 4 Box plots of discordance rates between imputed genotypes and
94.67%. The reduction of subtree length caused by genotyp-ing error is small when compargenotyp-ing to the subtree length reduction from a diverse subset to that from a random subset; for 50 simulated data sets, the length of a random subtree ranges from 56.80% to 75.37% of the optimal sub-tree, with a mean of 67.02%. Considering that study samples from genotyping arrays usually have a very low genotyping error (e.g.,,0.1%) (Illumina 2010), our simulation results show that while the selection of the most diverse subset is affected by genotyping error, even with substantial genotyp-ing error, the selected panel is still substantially more diverse than a random reference panel. This result is remi-niscent of the result of Atteson (1999), who proved that the consistency of neighbor joining is robust to a certain degree of noise in the distance matrix, in that the method can still construct a correct tree when distances obtained on the basis of that tree are slightly perturbed.
Imputation accuracy on data from the 1000 Genomes Project
We apply our method to real sequence data of 381 phased individuals with EUR ancestry from the 1000 Genomes Project. Considering eight 100-kb regions across chromo-some 20, we impute 3215 sites after removing singletons. Sites imputed with the most diverse reference panels have a mean^r2of 0.749 across sites. Sites imputed with the 1000 randomly selected reference panels have a mean^r2of 0.741. Slightly more sites pass the imputation quality threshold of
^
r2 $ 0.3 for the most diverse reference panels (85.75%) than for the randomly selected reference panels (84.23%). When applying a higher imputation threshold of^r2 $0.8, a similar percentage of sites pass the threshold for the most diverse reference panels (62.74%) and the randomly se-lected reference panels (62.89%).
Considering all imputed sites for the eight 100-kb regions, the most diverse reference panels result in a lower mean discordance rate across the eight regions (0.0067) than that of the randomly selected reference panels (0.0077). When comparing imputed sites that are hetero-zygotes in real sequenced data sets, sites imputed with the most diverse reference panels have a lower mean discor-dance rate across the eight regions (0.0228) than sites imputed with the randomly selected reference panels
(0.0262). The lower discordance rates from the most diverse reference panels are observed across all frequency bins for heterozygote sites. For sites with 0,MAF,0.1, the mean discordance rate across the eight regions is 0.074 using the most diverse reference panelsvs.0.0895 using random ref-erence panels; for sites with 0.1 # MAF, 0.2, the mean discordance rate across the eight regions is 0.0177 vs. 0.0193, and for sites with 0.2 # MAF # 0.5, the mean discordance rate across the eight regions is 0.0080 vs. 0.0099 (Figure 5). However, we also note that the perfor-mance of the most diverse reference panel varies widely across the eight regions. When ranking the discordance rate of the imputation by the most diverse reference panel with the discordance rates of the 1000 imputations by randomly selected reference panels from the lowest to the highest value for each of the eight regions, the most diverse refer-ence panel has a mean rank of 116.1 across the eight regions, ranging from 3 to 496 of 1001 panels ranked. For heterozygote sites, the most diverse reference panel has a mean rank of 156.7, ranging from 1 to 508; for hetero-zygotes in different MAF bins, the most diverse reference panel has an average rank of 242.7 for sites with 0 , MAF ,0.1, an average rank of 311.0 for sites with 0.1# MAF , 0.2, and an average rank of 129.4 for sites with 0.2#MAF#0.5 among 1001 panels ranked.
For the whole-chromosome 20 data, the sequence data set contains 259,618 sites after removing singletons. We select 18,000 sites with MAF$0.1 as“genotyped”markers and mask the genotypes for the remaining 241,618 sites to create a study sample. Based on the genotyped markers, we select the most diverse reference panel to impute the geno-types of the masked sites. For comparison, we sample 50 reference panels at random. We first compare the number of masked sites that are polymorphic in the selected refer-ence panels. In the most diverse referrefer-ence panel, 211,480 masked sites are polymorphic (87.53%), compared to an average of 210,137 across the 50 random reference panels (86.97%). After imputation, we observe that the imputation with the most diverse reference panel has 201,831 sites with
^
r2 $0.3 (83.53%), whereas 200,609 sites have mean^r2 $ 0.3 with a randomly selected reference panel (83.03%). For the higher imputation quality threshold of^r2$0.8, 142,996 sites pass the threshold for the imputation with the most Table 1 Mean bias and mean squared errors (MSEs) of the imputed genotypes for a totaln= 12,957 markers from the 50 data sets
Variant groups
Reference types MAF (0, 0.01] MAF (0.01, 0.05] MAF (0.05, 0.1] MAF (0.1,0.5] Overall
n 3,946 3,251 1,625 4,135 12,957
Most diverse
Mean bias 6.6431024 8.8531024 1.0431024 3.6231024 5.5331024
MSE 3.3331025 5.3131025 3.3631025 3.7931025 3.9831025
Random
Mean bias 1.4131023 1.2231023 9.4231024 8.1531025 8.8131024
MSE 3.5631025 9.5031025 1.1231025 9.8431025 8.0231025
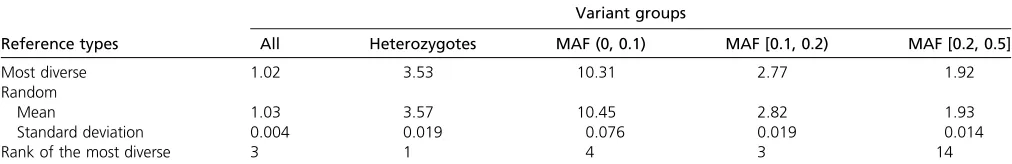
diverse reference panel (59.18%), whereas averaging 142,281 sites across imputations with the 50 randomly se-lected reference panels passes the threshold (58.89%). Moreover, sites are imputed with slightly higher accuracy with the most diverse reference panel than with random reference panels (Table 2). The discordance rate of the most diverse panel is lower than that of all except 2 of the 50 random panels (rank 3). To evaluate the imputation accu-racy in different frequency bins, we again consider discor-dance rates of heterozygote genotypes. When ranking the discordance rate of the imputation by the most diverse ref-erence panel with the discordance rates of the 50 imputa-tions by randomly selected reference panels from the lowest to the highest value, we observe that the most diverse ref-erence panel has a lower discordance rate than all 50 ran-dom panels (rank 1). Examining separate frequency bins, the most diverse reference panel has rank 4 for sites with 0,MAF,0.1, rank 3 for sites with 0.1#MAF,0.2, and rank 14 for sites with 0.2 #MAF#0.5. Averaging across sites, the numerical improvement in imputation accuracy by using the most diverse panel is modest, reducing imputation errors by 1% across all sites and by 2.3% at less common variants with 0,MAF,0.1.
Discussion
The cost reduction in modern sequencing technology enables investigators to generate a reference panel for genotype imputation by sequencing a subset of the study sample. We have proposed a selection strategy for such an internal reference panel by adapting an algorithm based on phyloge-netic diversity. In simulated sequence data, our method consistently outperforms randomly selected reference panels,
in that it provides higher imputation accuracy and recovers more polymorphic sites from the study sample. This im-proved performance holds across different imputation lengths, different reference panel sizes, and different marker densities in the study sample. Upon analyzing real sequence data with European ancestry from the 1000 Genomes Project, the most diverse reference panel provides higher imputation accuracy than do randomly selected reference panels. We observe this improved performance when imputing eight 100-kb regions on chromosome 20 and when imputing the entire chromosome 20, indicating that our method can be used to select reference individuals for imputing smaller target regions as well as for imputing the entire genomes. Our method may be particularly advanta-geous for imputing less common variants, as we found in our simulations that the most diverse reference panels incorpo-rate more polymorphic sites than do randomly selected reference panels. Moreover, the accuracy gain from using the most diverse reference panel instead of randomly selected reference panels is greater for less common variants (e.g., 0,MAF,0.2) than for more common variants (e.g., MAF$0.2) (Table 2).
Comparable methods have been suggested by Pasaniuc et al.(2010) and Kang and Marjoram (2012). Pasaniucet al. (2010) select an imputation template from an external data set based on similarity between haplotypes in the external data set and each individual haplotype in the study sample. Our method differs from that of Pasaniuc et al. (2010) in two major aspects. First, we select template individuals based on maximal differences among the template individ-uals, whereas Pasaniucet al.(2010) select template individ-uals based on similarity to the imputation target. Second, as the method of Pasaniucet al.(2010) is designed to be ap-plied to haplotypes that have already been sequenced, it does not assume that the same reference panel is used for the study sample across the entire genome. Instead Pasaniuc et al. (2010) identify a different reference panel for each short window (e.g., 15 kb) of the target region for each study individual. Kang and Marjoram (2012) recently pro-posed a similar tree-based sample-selection strategy for next-generation sequencing motivated from the standpoint of coalescent theory instead of phylogenetic diversity. Simi-larly to our study, they aim to identify the subset with the maximal branch length. Although they use a different tree-building algorithm, they examined a similar greedy method, motivated by coalescent theory. In simulations that exam-ined different marker densities, target imputation region lengths, and reference panel sizes, they found that their algorithm performed well, and we similarly find that our related method performs well under these scenarios. In ad-dition, the work of Pardi and Goldman (2005) and Steel (2005) provides further theoretical justification for the phy-logenetic-based method. Taken together, our study and that of Kang and Marjoram (2012) demonstrate the value of sensible use of genealogical relationships among samples to improve experimental design for sequencing studies. Figure 5 Box plots of discordance rates between imputed genotypes and
We expect that the most diverse reference panel algo-rithm can work effectively either on a limited region of the genome or on whole chromosomes, provided the phyloge-netic tree based on existing data reasonably captures the ancestral relatedness of the haplotypes in the study sample. This is possible only if the ancestral relatedness can be described well as a tree, a condition that depends on the population-genetic history of the sample and the size of the region of interest. When focusing on a single genomic region, relevant parts of its ancestral process can be approximated as a tree due to limited recombination events. This single tree can be estimated by a subset of genotyped markers, and thus our method can provide useful informa-tion for reference panel selecinforma-tion. On the other hand, many uncorrelated trees can be formed to represent the ancestral processes of a large region such as the entire genome. Hence, an approximation with a single tree might not capture many features of the data. In such a scenario, it is less likely that our method will produce a better reference panel than a random sample.
In a structured population, the underlying population structure generates a correlation of ancestries across the entire genome. The resulting clades can be approximated by the tree-building algorithm, and this tree can help in selecting a more diverse reference panel. It is encouraging that in a sample of five European subpopulations, the population structure was sufficient for the most diverse reference panel selected based on the entire chromosome 20 to outperform the randomly selected reference panels. Hence, relatively subtle population structure, such as that found in samples from geographically proximate European countries, is sufficient to create similarities in the underlying ancestral processes that can be captured by the tree-building algorithm and can result in improved reference panel selection. If subpopulations contribute different sample sizes, we expect that our algorithm will usually ensure that at least one haplotype from every subpopulation is included in the reference panel. As the algorithm collects the more diverse haplotypes, it may oversample subpopulations with a small contribution to the overall sample. This will ensure that for each subpopulation, enough haplotypes are in the template for reasonably precise imputation.
Our method is based on a locally estimated phylogenetic tree. The topology of the true underlying genealogy changes across the genome as a consequence of recombination events, and therefore, over long regions, the estimated tree obscures this underlying variability. Because the perfor-mance of our method is based on how well the local phylogenetic tree approximates the ancestral relatedness of the study individuals, we expect the gain in imputation accuracy using our method will eventually decrease with increasing length of the imputed region. As expected, the average improvement in imputation accuracy when imput-ing 100-kb regions is considerably higher than the average improvement across the entire chromosome, reflecting that the ancestry of a 100-kb region is more tree-like than the ancestry of an entire chromosome.
The method of reference panel selection described here can be adapted to address specific study design goals. Our method can be applied to incorporate other criteria in reference panel selection. For example, we have not specif-ically incorporated phenotype information when selecting reference haplotypes, so the selected reference panel is not guaranteed to include the individuals with traits of interest. To sequence certain individuals because of their phenotypes or other criteria unrelated to their phylogenetic placement, we can apply the selection algorithm conditional on including these individuals in the reference panel. The greedy algorithm still guarantees that the subsequent extension has optimal phylogenetic diversity, as proved by Pardi and Goldman (2005). Similarly, our method can be easily extended to form a reference panel by incorporating sequences partly from the study sample and partly from an external database such as the HapMap Project or the 1000 Genomes Project. For exam-ple, we can treat sequences from the HapMap Project as an initial set and apply the greedy algorithm to the study sample as an extension in a similar manner as in analyses treating other inclusion criteria.
We note that our method can be applied to select reference panels in species other than humans. There are many other species for which genomic mapping tools are under development (e.g., Atwell et al.2010; Hickey et al. 2012; Badke et al. 2013), and indeed, the idea of locally estimating phylogenetic trees has been considered by Wang Table 2 Discordance rates for genotype imputations with different reference panels, using chromosome 20 data with European ancestry in the 1000 Genomes Project
Variant groups
Reference types All Heterozygotes MAF (0, 0.1) MAF [0.1, 0.2) MAF [0.2, 0.5]
Most diverse 1.02 3.53 10.31 2.77 1.92
Random
Mean 1.03 3.57 10.45 2.82 1.93
Standard deviation 0.004 0.019 0.076 0.019 0.014
Rank of the most diverse 3 1 4 3 14
et al.(2012), who proposed to use a local phylogenetic tree to assess the confidence of imputed genotypes in inbred mice. The confidence in imputation quality is high when a study strain shares one or more genome intervals with the reference sequences, whereas the confidence in imputa-tion accuracy is low when the strain does not share genome intervals with the reference sequences. Wanget al.(2012) suggested that strains with low confidence in imputation accuracy are the ones to sequence to achieve the maximal improvement in imputation accuracy if investigators plan to sequence a subset of the study sample. Our approach can supplement the strategy used by Wanget al.(2012) if only a subset of the low-confidence strains can be sequenced. In that scenario, our algorithm can condition on the strains that are already sequenced or strains imputed with high imputation accuracy, allowing researchers to identify the subset of low-confidence strains that can best be used to impute the full data set.
In summary, we have demonstrated that an innovative method of choosing an internal reference panel—the most diverse reference panel—can be a cost-effective approach for planning sequencing studies with existing genotype ar-ray data. The method can readily incorporate a variety of selection criteria, while still guaranteeing the maximal phy-logenetic diversity for subsequent selections.
A program to select the most diverse reference panel using the greedy algorithm is available in C++ upon request.
Acknowledgments
We thank Bingshan Li, Ziqian Geng, and Matt Zawistowski for useful suggestions in designing simulations. We thank Mike Steel for useful discussions on the greedy algorithm. This work was supported by National Institutes of Health grant R01 HG005855.
Literature Cited
Atwell, S., Y. S. Huang, B. J. Vilhjalmsson, G. Willems, M. Horton
et al., 2010 Genome-wide association study of 107 phenotypes in Arabidopsis thaliana inbred lines. Nature 465: 627–631. Atteson, K., 1999 The performance of neighbor-joining methods
of phylogenetic reconstruction. Algorithmica 25: 251–278. Badke, Y.M., R. O. Bates, C. W. Ernst, C. Schwab, J. Fix et al.,
2013 Methods of tagSNP selection and other variables affect-ing imputation accuracy in swine. BMC Genet. 14: 1–14. Brown, A. H. D., 1989 Core collections: a practical approach to
genetic resources management. Genome 31: 818–824. Faith, D. P., 1992 Conservation evaluation and phylogenetic
di-versity. Biol. Conserv. 61: 1–10.
Frazer, K. A., D. G. Ballinger, D. R. Cox, D. A. Hinds, L. L. Stuve
et al., 2007 A second generation human haplotype map of over 3.1 million SNPs. Nature 449: 851–861.
Fridley, B. L., G. Jenkins, M. E. Deyo-Svendsen, S. Hebbring, and R. Freimuth, 2010 Utilizing genotype imputation for the aug-mentation of sequence data. PLoS ONE 5: e11018.
Hao, K., E. Chudin, J. McElwee, and E. E. Schadt, 2009 Accuracy of genome-wide imputation of untyped markers and impacts on statistical power for association studies. BMC Genet. 10: 27.
Hickey, J.M., J. Crossa, R. Babu, and G. de los Campos, 2012 Factors affecting the accuracy of genotype imputation in populations from several maize breeding programs. Crop Sci. 52: 654–663. Howie, B., C. Fuchsberger, M. Stephens, J. Marchini, and G. R.
Abecasis, 2012 Fast and accurate genotype imputation in ge-nome-wide association studies through pre-phasing. Nat. Genet. 44: 955–959.
Huang, L., Y. Li, A. B. Singleton, J. A. Hardy, G. Abecasis et al., 2009 Genotype-imputation accuracy across worldwide human populations. Am. J. Hum. Genet. 84: 235–250.
Huang, L., M. Jakobsson, T. J. Pemberton, M. Ibrahim, T. Nyambo
et al., 2011 Haplotype variation and genotype imputation in African populations. Genet. Epidemiol. 35: 766–780.
Hudson, R. R., 2002 Generating samples under a Wright-Fisher neutral model of genetic variation. Bioinformatics 18: 337– 338.
Illumina, Inc. 2010 Genotyping rare variants. Technical Note: DNA Analysis, Pub.No.370-2010-2008, San Diego, CA. International HapMap Consortium, 2005 A haplotype map of the
human genome. Nature 437: 1299–1320.
Jewett, E. M., M. Zawistowski, N. A. Rosenberg, and S. Zöllner, 2012 A coalescent model for genotype imputation. Genetics 194: 1239–1255.
Jostins, L., K. I. Morley, and J. C. Barrett, 2011 Imputation of low-frequency variants using the HapMap3 benefits from large, di-verse reference sets. Eur. J. Hum. Genet. 19: 662–666. Kang, C. J., and P. Marjoram, 2012 A sample selection strategy for
next-generation sequencing. Genet. Epidemiol. 36: 696–709. Li, Y., C. Willer, S. Sanna, and G. Abecasis, 2009 Genotype
impu-tation. Annu. Rev. Genomics Hum. Genet. 10: 387–406. Li, Y., C. J. Willer, J. Ding, P. Scheet, and G. R. Abecasis,
2010 MaCH: using sequence and genotype data to estimate haplotypes and unobserved genotypes. Genet. Epidemiol. 34: 816–834.
McKhann, H. I., C. Camilleri, A. Berard, T. Bataillon, J. L. David
et al., 2004 Nested core collections maximizing genetic diver-sity inArabidopsis thaliana. Plant J. 38: 193–202.
Nee, S., and R. M. May, 1997 Extinction and the loss of evolu-tionary history. Science 278: 692–694.
Nothnagel, M., D. Ellinghaus, S. Schreiber, M. Krawczak, and A. Franke, 2009 A comprehensive evaluation of SNP geno-type imputation. Hum. Genet. 125: 163–171.
Pardi, F., and N. Goldman, 2005 Species choice for comparative genomics: being greedy works. PLoS Genet. 1: e71.
Pasaniuc, B., R. Avinery, T. Gur, C. F. Skibola, P. M. Bracciet al., 2010 A generic coalescent-based framework for the selection of a reference panel for imputation. Genet. Epidemiol. 34: 773– 782.
Pei, Y. F., L. Zhang, J. Li, and H. W. Deng, 2010 Analyses and comparison of imputation-based association methods. PLoS ONE 5: e10827.
Reeves, P. A., L. W. Panella, and C. M. Richards, 2012 Retention of agronomically important variation in germplasm core collec-tions: implications for allele mining. Theor. Appl. Genet. 124: 1155–1171.
Saitou, N., and M. Nei, 1987 The neighbor-joining method: a new method for reconstructing phylogenetic trees. Mol. Biol. Evol. 4: 406–425.
Scott, L. J., P. Muglia, X. Q. Kong, W. Guan, M. Flickinger et al., 2009 Genome-wide association and meta-analysis of bipolar disorder in individuals of European ancestry. Proc. Natl. Acad. Sci. USA 106: 7501–7506.
Steel, M., 2005 Phylogenetic diversity and the greedy algorithm. Syst. Biol. 54: 527–529.
Wang, J. R., F. P. de Villena, H. A. Lawson, J. M. Cheverud, G. A. Churchill et al., 2012 Imputation of single-nucleotide polymor-phisms in inbred mice using local phylogeny. Genetics 190: 449–458. Zawistowski, M., S. Gopalakrishnan, J. Ding, Y. Li, S. Grimm et al., 2010 Extending rare-variant testing strategies: analysis of noncoding sequence and imputed genotypes. Am. J. Hum. Genet. 87: 604–617.
Zeggini, E., L. J. Scott, R. Saxena, B. F. Voight, J. L. Marchiniet al., 2008 Meta-analysis of genome-wide association data and large-scale replication identifies additional susceptibility loci for type 2 diabetes. Nat. Genet. 40: 638–645.