Correlation Analysis of Variation Orders
With Schedule of Works on Low Rise Building
in Indonesia
Felix1, Mark Setiadi 2, Iwan B. Santoso 3
Master Student of Civil Engineering, Tarumanagara University, Jakarta, Indonesia 1
Lecturer, Civil Engineering Master Program, Tarumanagara University, Jakarta, Indonesia 2,3
ABSTRACT:Variation order, mostly found in construction projects. The existence of variation orders on a project is often associated with additional costs and time of work. Variation orders do have a direct impact on the costs of the project, but have an indirect impact on the time of work. As an important part of a project, correlation analysis between variation order with additional time of work needs to be done. Based on the type of works performed, construction work can be divided into 4 types, structural works, architectural works, MEP (Mechanical, electrical, and plumbing) works, and infrastructure works. The analyzed data are obtained from developer A. The analysis is done by looking for a correlation between the value of variation order of each type of work with the additional of work time for each type of work. The results of the analysis indicate a correlation between variation order of structural works and additional time of structural work, then correlation between variation order of architectural work and the additional time of architectural and MEP works, then correlation between variation order of MEP work and the additional time of architectural and MEP works, last but not least correlation between variation order infrastructure work with the additional time of infrastructure works.
KEYWORDS:Variation Order, Additional work.
I. INTRODUCTION
In construction projects, there are a lot of stakeholders who will affect in the success of the project. However, with the presence of many developers, contractors and consultants, the nature of a project cannot be predicted, because the characteristics of stakeholders in one project are not the same as the characteristics of stakeholders in other projects. With many stakeholders involved, there will be a lot of differences of opinions and mistakes that will occur. These errors and differences cause changes from the initial plan, called variation order.
This research is conducted to determine the effect of variations order on the projects delays in each type of works. Correlation analysis carried out in this research are the value of variation order from each type of works and delayed time from each type of works. The project analysed are located in Indonesia.
There are several objectives to be achieved in this study. The main aim is to learn how much influence the variation order has on each type of work on the schedule of the type of work. The second aim is to study what types of work often cause variation orders. And the third aim is to learn how much the percentage variation order is to the total value of the initial contract.
II. LITERTUREREVIEW
Types of Construction Works
Types of works in construction projectscan be divided into several points of view, as follows:
Structural Works
According to Winoto [12], this type of works includes the physical construction work of the building itself, including the construction of ports, airports, railways, coastal security, irrigation canals / canals, tunnels, highways and bridges.
Architectural Works
This type of works includes processing the shape and mass of buildings based on the functions and requirements needed.
Mechanical – electrical Works
According to Wilopo [11], this type of works includes installation of factory installations, installation of piping water, oil, gas, and to complete the building installations.
Infrastructure Works
This type of works includes management work and structuring of the final form of the building / construction results and the surrounding environment (landscape).
Variation Order
According to Azany [2], variation orders are orders from service users (owners) or their representatives and usually come from negotiations with contractors, who can change the terms and conditions of the contract, both in terms of adding jobs, canceling / reducing jobs,changing work standards and so on.
According to Hardjomuljadi et al [6], there are several causes of variation order, as follows:
Errors in design
Changes in specifications
Changes in designs
Added or reduced scoop of works
Errors in design
Effect of Variation Orders on Time and Costs
According to Prabowo [7], there are four types of relationships that may occur between each activities of work in construction project, such as:
Dependent Activities
In this type of activity, an activity / job requires information from the first activity / work before the second activity can begin.
Semi-independent activity
In this type of activity, an activity / job that requires partial information from the first activity / work before the second activity can begin.
Independent Activities
In this type of activity, an activity / job does not require information from previous activities / work
Interdependent Activities
In the four types of activities relationships above, only independent activities can be overlapped without risking additional time / delay. Whereas for the other three types of relationships there is a risk of additional time / delay, so this proves, if there is variation order (in this case the work is added) then there is a high likelihood that a construction delay will occur.
According to Asiyanto [1],when there is a change in construction work, it should be noted that costs will directly impact this change. The costs that affect themselves are divided into two groups, as follows:
Direct Cost
Direct costs are costs that are directly related to the physical form of the project
Indirect Cost
Indirect costs are all types of costs that relate indirectly to the physical form of the project, but are still charged to the project.
III. RESEARCHMETHODOLOGY
In this study, two types of data will be used, as follows:
Primary Data
According to Sarwono [9], primary data in this study is in the form of quantitative data concerning contract values and work schedules on construction projects found in developer company A.
Secondary Data
According to Priyanto [8], secondary data used in this study are learning from previous research, journals, books, and other media related to the discussion in this study. Secondary data is used as a theoretical basis and reference analysis.
Correlation analysis method that will be used in this analysis is Pearson Correlation. According to Everitt [3], pearson correlation analysis is one correlation method used to measure the strength and direction of linear relationships of two or more variables. Variables are said to correlate if changes in one variable are accompanied by changes in other variables, both in the same direction or the opposite direction.
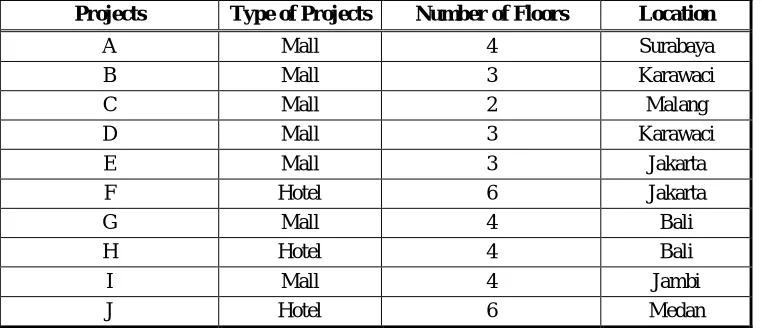
The projects under this study are projects from developer A, located in Indonesia. Mainly, the projects are the construction of shopping malls and hotels located all across Indonesia. The type of project and project location analyzedwas shown in Figure 1.
Projects Type of Projects Number of Floors Location
A Mall 4 Surabaya
B Mall 3 Karawaci
C Mall 2 Malang
D Mall 3 Karawaci
E Mall 3 Jakarta
F Hotel 6 Jakarta
G Mall 4 Bali
H Hotel 4 Bali
I Mall 4 Jambi
J Hotel 6 Medan
Figure 1. Project’s Types and Locations
mall projects and 3 hotel projects. Each projects has 2 to 6 number of floors, which makes the analyzed projects will have quite a same character one another.The analyzed variable are as shown in Figure 2:
No Variable Data
1 Y1 Difference in completion time on structure work
2 Y2 Difference in completion time on architecture work
3 Y3 Difference in completion time on mechanical electrical work
4 Y4 Difference in completion time on infrastructure work
5 Y5 Difference in completion time on total project
6 X1 Value of variation order structure work
7 X2 Value of variation order architecture work
8 X3 Value of variation order mechanical electrical work
9 X4 Value of variation order infrastructure work
Figure 2. Independent and Dependent Variable
As shown in Figure 2, there are 5 independent variables for this study, which are the difference in the addition of time from each type of works and 4 dependent variables, which are the amount of variation order in each type of works. All dependent variables are obtained by reducing the amount of the initial contract value to the actual value that occurs in the construction project in each type of work, while the independent variable is obtained from the difference in the length of time the completion of each job with the actual duration of completion.
IV. ANALYSISANDRESULTS
In this study, correlation analysis was carried out for 10 projects. Each project should have S-Curve to calculate the value of variation order and how long is the added time from each type of works. To find the dependent variable is to divide the time difference from the planning work time and to find the independent variable in this study, is to divide the variation order value with the initial planning value of each type of works, example shown in Figure 3.
Type of
Works Initial Planning Variation Order Actual
VO (In Percentage) Structure 34,946,291,990 3,727,000,000 38,673,291,990 10.66%
Architecture 12,005,982,419 0 12,005,982,419 0.00%
MEP 31,423,335,756 135,000,000 31,558,335,756 0.43%
Infrastructure 5,933,468,859 160,000,000 6,093,468,859 2.70%
TOTAL 84,309,079,024 4,022,000,000 88,331,079,024 4.77%
Figure 3. Independent Variable in Project A
independent variables from each project (variation order value structure, architecture, MEP, and infrastructure). Details as shown in Figure 4.
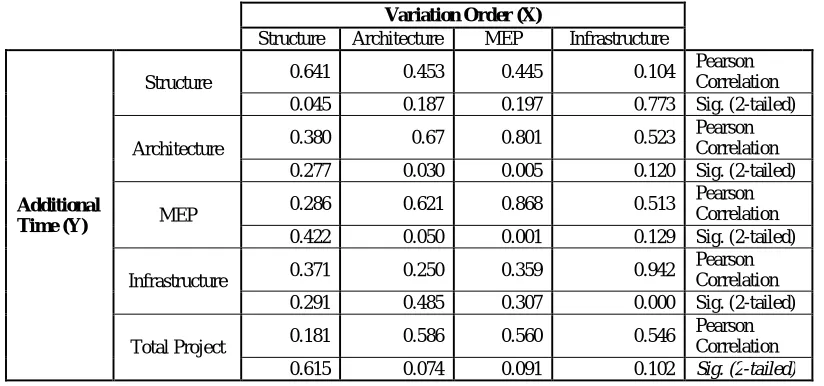
As shown in Figure 4, there are 5 dependent variables and 5 independent variables, correlation analysis carried out for each dependent variable with independent variables (for example VO structure carried out correlation analysis with additional time of structure, architecture, MEP, infrastructure, and total additional time per project). From the calculation of independent and dependent variables for 10 projects, then the correlation analysis was carried out. Correlation analysis is carried out for each project. Analysis between X and Y was carried out for all types of work, the result shown in Figure 5.
Variation Order (X)
Structure Architecture MEP Infrastructure
Additional Time (Y)
Structure 0.641 0.453 0.445 0.104
Pearson Correlation 0.045 0.187 0.197 0.773 Sig. (2-tailed)
Architecture 0.380 0.67 0.801 0.523
Pearson Correlation 0.277 0.030 0.005 0.120 Sig. (2-tailed)
MEP 0.286 0.621 0.868 0.513
Pearson Correlation 0.422 0.050 0.001 0.129 Sig. (2-tailed)
Infrastructure 0.371 0.250 0.359 0.942
Pearson Correlation 0.291 0.485 0.307 0.000 Sig. (2-tailed)
Total Project 0.181 0.586 0.560 0.546
Pearson Correlation 0.615 0.074 0.091 0.102 Sig. (2-tailed)
Figure 5. Correlation Analysis Result Projects
A B C D E
VO Time VO Time VO Time VO Time VO Time
Str 10.66% 16.67% 9.31% 14.29% 0.00% 0.00% 2.43% 10.00% 7.02% 12.50%
Arc 0.00% 33.33% 31.29% 75.00% 0.00% 9.09% 5.93% 50.00% 46.59% 41.67%
MEP 0.43% 25.00% 11.61% 86.67% 0.59% 18.18% 2.05% 50.00% 2.48% 33.33%
Infra 2.70% 25.00% 17.44% 40.00% 0.00% 0.00% 21.52% 50.00% 16.11% 30.00%
Total 4.77% 17.39% 15.08% 30.77% 0.22% 10.00% 5.43% 40.00% 15.98% 31.58%
Projects F G H I J
VO Time VO Time VO Time VO Time VO Time
Str 4.54% 13.64% 8.35% 7.14% 5.41% 20.00% 0.00% 0.00% 4.76% 18.18%
Arc 2.87% 11.76% 3.13% 5.88% 11.04% 54.55% 0.00% 6.25% 41.08% 63.64%
MEP 0.00% 0.00% 0.91% 5.56% 6.33% 54.55% 0.43% 6.25% 3.37% 63.64%
Infra 0.00% 0.00% 3.39% 8.70% 1.04% 0.00% 0.00% 0.00% 0.00% 0.00%
Total 3.52% 18.18% 3.39% 8.70% 8.00% 39.13% 0.12% 6.67% 9.16% 35.00%
The result from correlation analysis (Figure 5) is as follows:
Variation Order of structure works have a significant effect on the addition of structure work time, with strong relationships.
Variation Order of architecture works have a significant effect on the addition of architecture and MEP work time, with strong relationships.
Variation Order of MEP works have a significant effect on the addition of architecture and MEP work time, with very strong relationships.
Variation Order of infrastructure works have a significant effect on the addition of infrastructure work time, with very strong relationships.
Variation Order of total project works have a significant effect on the addition of project work time, with strong relationships.
From the correlation analysis can be concluded that variation order has a significant effect to additional work time. In order to prevent additional time caused by variation orders, it was necessary to find the cause of variation orders. From the collected data, the variation order causes are divided into three, shown in Figure 6.
No
Causes of Variation
Order Variation Order Value Percentage
1
Changes in design by design consultant
4,727,497,960 10,48%
2 Statutory Requirements
1,396,016,567 3,09%
3
Changes in clients requirements
38,979,152,379 86,42%
- Projects Departments
25,336,449,047
- Marketing Departments
13,642,703,333
Figure 6. Causes of Variation Order
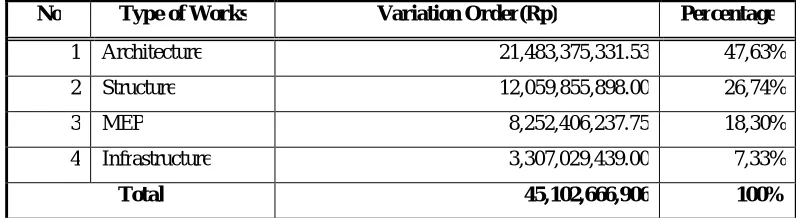
Based on the causes, it can be concluded that the changes in clients has the largest variation order value with a value of Rp. 38,979,152,379 or 86,42% of the total variation order analyzed, followed by changes in design by design consultant with a value of Rp. 4,727,497,960 or 10,48% of the total variation order analyzed, come last isstatutory requirements with a value ofRp. 1,396,016,567 or 3,09%. From the causes of variation order, it is also important to know type of works with the most variation order from each projects, shown in figure 7.
No Type of Works Variation Order(Rp) Percentage
1 Architecture 21,483,375,331.53 47,63%
2 Structure 12,059,855,898.00 26,74%
3 MEP 8,252,406,237.75 18,30%
4 Infrastructure 3,307,029,439.00 7,33%
Total 45,102,666,906 100%
Based on the types of work, it can be concluded that the type of architectural work has the largest variation order value with a value of Rp. 21,483,375,331.53 or 47.63% of the total variation order analyzed, followed by structural work with a value of Rp. 12,059,855,898.00 or 26.74% of the total variation order analyzed, then MEP work with a value of Rp. 8,252,406,237.75 or 18.30% of the total variation order analyzed, and infrastructure work with a value of Rp. 3,307,029,439.00, worth 7.33%. The total variation order analyzed was Rp. 45,102,666,906.
V. CONCLUSION
From the analysis that has been carried out from projects in developerA in Indonesia, some conclusions can be drawn as follows:
1. Variation orders on structural work only correlate with structural work time, with strong relationships (with a value of 0.641), so that the more amount of variation order structure causes the time of structural work to increase. 2. Variation orders on architectural work are correlated with architectural work time and MEP, with strong
relationships (with values of 0.679 for architectural work and 0.620 for MEP jobs), so that more architectural variation order causes architectural and MEP work times to increase.
3. Variation orders on MEP jobs correlate with architectural and MEP work time, the relationship is very strong (with a value of 0.801 for architectural work and 0.868 for MEP work), so that more MEP variation orders cause architectural work time and MEP to increase.
4. Variation orders in infrastructure jobs only correlate with the time of infrastructure work, the relationship is very strong (with a value of 0.942), so the more amount of infrastructure variation order causes the time of infrastructure work to increase.
5. Variation orders on architectural work are most correlated with the addition of total project time, followed by MEP work, infrastructure, and structure.
6. Architectural work has the greatest value in this study with a value of 47.63% of the total variation order value analysed, followed by structural work with a value of 26.74%, MEP work with a value of 18.30%, and infrastructure work with a value of 7.33%.
7. Demand from service users mostly causes variation orders, with 86.42% of the total amount of variation orders analysed, followed by changes due to design consultants as much as 10.48% and changes due to 3.09% adjustments to government regulations.
REFERENCES
1. Asiyanto, “Dasar-DasarAkuntansiKonstruksi”,Study Material for Cost Estimates in Tarumanagara University Civil Engineering Master Program, 2015.
2. Azany, J., “PengaruhPekerjaan Change Orders terhadapPresentaseKeuntunganKontraktorPadaGedungBertingkat”. University of Indonesia’s Library, 2016.
3. Everitt, B. and Landau, S., “A Handbook of Statistical Analysis using SPSS”. London: Chapman & Hall/CRC, 2004. 4. Fisk, E, R., and Reynolds W, D., “Construction Project Administration, Eighth Edition”. New Jersey: Prentice Hall, 2006.
5. Gilberth, R, D.,“Managing Construction Contract Operational Control for Commercial Risk, Second Edition”. John Wiley &Sons.Inc., 1992. 6. Hardjomuljadi, S., Abdulkadir, A., and Takei, M., “StrategiKlaimKonstruksiBerdasarkan FIDIC Conditions of Contract”,Jakarta: Polagrade,
2006.
7. Prabowo, R. S, “AnalisisPengaruhPenerapanMetode Fast-Track TerhadapBiayaProyek”,Tarumanagara University Library, 2014. 8. Priyanto, D., “AnalisisKorelasi, Regresi, Dan Multivariate Dengan SPSS”. Yogyakarta: Gava Media, 2013.
9. Sarwono, Jonathan, “MetodeRisetSkripsiPendekatanKuantitatifMenggunakanProsedur SPSS”, Jakarta: PT. Gramedia, 2012.
10. Schaufelberger, J, E., and Holm, L., “Management of Construction Project Constructor’s Perspective”. New Jersey: Prentice Hall, 2002. 11. Wilopo, D., “MetodeKonstruksidanAlatBerat”. Study Material for Cost Estimates in Tarumanagara University Civil Engineering Master
Program, 2014.