A Study on Physico-Chemical Characteristics
of Selected Ground Water Samples of Chennai
City, Tamil Nadu
R.Josephine Sharmila
1, R. Rajeswari
2Assistant Professor, Department of Chemistry, Quiad-E-Millath Government College for Women,
Chennai, India1 &2
ABSTRACT: Ground water quality is one of the most important criterion to ascertain its suitability for human beings and irrigation. As water is the most important commodity, rigorous urban ground water monitoring is needed for tracking the water table depletion and deterioration in water quality on regular basis. A study on various physico-chemical characteristics of water in natural habitat (selected location of Chennai city) was carried out during the present study. The ground water samples were collected from ten different locations and analysed for physico chemical characteristics such as pH, Electrical Conductivity (EC), Total dissolved solids (TDS). Total hardness (TH), Total alkalinity (TA), Dissolved Oxygen (DO), Calcium (Ca2+), Iron (Fe), Chloride (Cl-), Fluoride (F-), Phosphate (PO43-),
Chemical Oxygen Demand (COD) and Biochemical Oxygen Demand (BOD). Slight deviation was observed in Ramapuram with Iron content and BOD, COD values are also within the limit which indicates that less contaminants of wastes in the ground water. From overall analysis, it was observed that in these residential areas the water quality is maintained and within the permissible limits of governing bodies.
KEY WORDS: Ground water, Physio-chemical parameter, TDS, COD, BOD.
I. INTRODUCTION
Ground water is the principal source of drinking water in both rural and urban parts of India. The safety of drinking water is assured and taken for granted by consumers in most developed countries. The quality of ground water vary with geology of the particular area, depth of water table, seasonal changes, composition of dissolved salts depending upon sources of salt and surface environment. It is observed that ground water get polluted due to increased human population, agricultural runoff, domestic sewage, industrial effluents, and addition of various kinds of pollutants by human activities. Due to use of contaminated drinking water number of water borne diseases is on the rise.2-4. The problems of groundwater quality are more acute in areas that are densely populated and thickly industrialized and have shallow dug wells.
Water quality data is essential for the implementation of responsible water quality regulations for characterizing and remediating contamination and for the protection of the health of human and the ecosystem. Hence a better understanding of the chemistry of groundwater is very essential to evaluate groundwater quality for domestic and irrigation purposes. Groundwater studies are gaining more importance in the present day as it is used for almost all purposes such as domestic and agriculture activities in most parts of the world.
metals into groundwater. This can be aggravated by over-pumping wells, particularly for agriculture. Industrial pollution of groundwater can come from dumping of wastewater or waste, from industrial activities and from leakage or spillage from other industrial processes. Chemical manufacture and storage similarly present a threat through leakage. Pollution caused by fertilizers and pesticides used in Agriculture often dispersed over large areas, is a great threat to fresh groundwater ecosystems.
Health effects from contaminated groundwater depend on the specific pollutants in the water. Pollution from groundwater often causes diarrhoea and stomach irritation, which can lead to more severe health effects. Accumulation of heavy metals and some organic pollutants can lead to cancer, reproductive abnormalities and other more severe health effects. The functioning of an aquatic system depends to a great extent on the physicochemical characteristics of its water.
Thus in the present study an attempt has been made to assess the physicochemical characteristics of ground water of selected locations of Chennai city.
II. MATERIALS AND METHODS
2.1 Study area
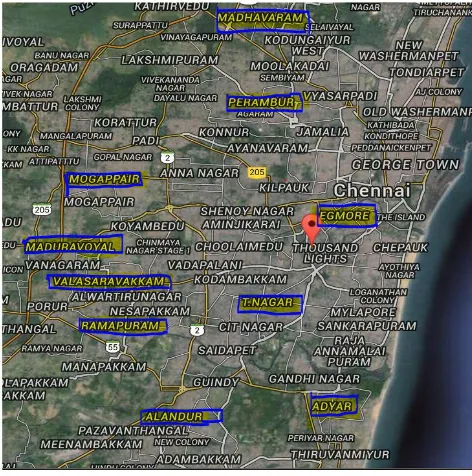
The study area covers ten major residential areas located in Chennai, the capital of Tamil Nadu as shown in Figure 1. The water samples were collected from the bore well dug in these areas and physico-chemical parameters were investigated to arrive at the water quality.
2.2 Sample Collection
The samples were collected in plastic cans of five litre capacity without any air bubbles as per standard procedure. The water from bore wells was pumped out for few minutes before sample collection. Water samples were collected from ten different locations during monsoon period from October 2014 to December 2014. The sampling locations are given in Table 1.
Sample No. Sampling Location Source
S1 Madhavaram Bore well
S2 Perambur Bore well
S3 Mogappair Bore well
S4 Egmore Bore well
S5 Madhuravoyal Bore well
S6 Valasaravakkam Bore well
S7 T. Nagar Bore well
S8 Ramapuram Bore well
S9 Adyar Bore well
S10 Alandur Bore well
Figure 1. Study Area
2.3 Method
Water samples have been collected during the monsoon season at different locations of Chennai. The pH was measured in the field at the time of sample collection by using pocket digital pH meter while other parameters such as electrical conductivity, total dissolved solids, dissolved oxygen, total hardness, total alkalinity, calcium, chloride ions, fluoride ions, phosphate ions and iron were estimated in the laboratory using standard procedures by APHA3.
III. RESULTS AND DISCUSSION
The various physico-chemical characteristics were analysed for ground water from ten different sampling locations. The details of the average results were summarized in Table 2.
Sample No.
pH EC TDS TH TA DO Ca2+ Fe Cl- F- PO43- COD BOD
S1 6.5 1.92 1250 780 270 7.4 160 1.4 240 0.1 0.05 55 8.4
S2 7.2 0.75 980 650 230 7.3 140 0.2 130 0 0 30 4.6
S3 7.0 1.56 300 100 80 6.4 80 0.1 100 0 0 20 3.4
S4 7.0 2.54 540 340 180 7.2 120 0.1 120 0 0 35 3.6
S5 7.1 0.62 60 210 120 7.2 100 0 80 0.1 0 30 4.8
S6 6.6 1.64 480 180 100 7.0 90 0 60 0 0 28 4.5
S7 6.5 1.85 600 160 90 6.4 80 0.1 100 0 0 32 3.8
S8 7.1 1.4 1080 820 250 7.3 150 1.2 220 0.1 0.05 50 8.2
S9 7.0 2.34 310 120 85 6.5 80 0 60 0 0 20 3.2
S10 6.8 1.45 450 160 95 6.4 80 0.1 120 0 0 20 3.0
pH: The pH value of water source is a measure of the hydrogen ion concentration in water and indicates whether the water is acidic or alkaline4. Most of the biological and chemical reactions are influenced by the pH of water system. In the present study all the ground water samples have pH value between 6.5-7.2. The standard values of pH for drinking water prescribed by WHO is 7.0-8.5. All the sampling locations were found to have water pH within this permissible limits of WHO.
Electrical conductivity (EC): Electrical conductivity is the measure of the ability of water to conduct electrical current. This capacity depends on the concentration of ions, ionic mobility, and temperature. Based on electrical conductivity values the water quality can be classified as poor, medium or good5. EC values are in the range of 0.62-2.72 indicating the presence of high amount of dissolved inorganic substances in ionized form.
Total dissolved solids (TDS): The total dissolved solids in water are due to presence of all inorganic and organic substances. The solids can be iron, manganese, magnesium, potassium, sodium, calcium, carbonates, bicarbonates, chlorides, phosphates and other minerals. The observed high values of TDS in some areas causes gastrointestinal irritation to the human and prolonged use of such water may result in the formation of kidney stones and also cause heart attack. The high percentage of TDS also imparts alkalinity nature to water. TDS indicate the salinity behaviour of groundwater. Water containing more than 500 mg/L of TDS is not considered desirable for drinking water supplies. In the present analysis, the TDS values were observed from 260 to 1460 mg/L. The most desirable limit of TDS is 500 mg/L and maximum allowable limit is 1500 mg/L. The TDS value for all the ground water samples are well within the permissible limit of 1500 mg/L.
Total hardness (TH): Hardness of water is an aesthetic quality of water and is caused by carbonates, bicarbonates, sulphates and chlorides of calcium and magnesium. It prevents the lather formation with soap and increases the boiling point of water. The maximum permissible limit of total hardness for drinking purpose is 300 mg/L. Hardness more than 300 mg/L may cause heart and kidney problems6. The total hardness in ground water samples collected from the study area ranged from 100-850 mg/L. sample S1 and S8 were found to have high hardness and hence require suitable treatment before use.
Total alkalinity (TA): Alkalinity of water is the measure of the ability to neutralize a strong acid. The bases like carbonates, bicarbonates, hydroxides, phosphates, nitrates, silicates, borates etc are responsible for alkalinity of water7. It gives an idea of natural salts in water. The alkalinity values were recorded within the range of 120 to 280 mg/L. Alkalinity around 120mg/L is desirable for productive water bodies.
Dissolved oxygen (DO): Dissolved oxygen is one of the main parameter which influences the water quality and is important to all aquatic organisms. It reflects the physical and biological process taking place in the water body. In water, the oxygen is generally reduced due to respiration of biota, rise in temperature, oxygen demanding waste, and decomposition of inorganic and organic matter8. As per WHO standard DO value of 5 mg/L is ideal and in the present sampling locations it was found to be between 6.4 -9.3 mg/L.
Calcium (Ca2+): It is directly related to hardness. It is common in natural waters and essential for all organisms. Calcium plays an important role for proper bone growth. The rock, lime stone and industrial waste are the rich sources of calcium from where it is leached in the ground water. The permissible limit of calcium is 100 mg/L according to WHO. The concentration of calcium varied from 80-160 mg/L. In the present study, the high concentration of calcium in the ground water of S1 and S8 stations are due to rapid industrialization and urbanization.
Iron (Fe): Even though the concentration of iron in natural water is low, it is found in certain places beyond the prescribed levels which may be due to the industrial waste. It is present in ground water as ferrous bicarbonate Fe (HCO3)2, Ferric hydroxide Fe (OH) 3 or as rust. The high concentration of Fe results in bitter taste and brownish colour
According to WHO, Fe concentration upto 1.0 mg/L does not harm human and in the present case all the sampling stations except S1 and S8 were well within the limit. These two areas had comparative larger Fe content (0.6-0.8mg/L) due to the increased small scale industrial development.
Chloride (Cl-): Chloride in ground water can be caused by industrial or domestic waste. Its concentration serves as an indicator of pollution by sewage. High chloride content in water bodies, affects agricultural crops, metallic pipes and are injurious to people suffering from to heart and kidney diseases. Its concentration is generally high is ground waters, where the temperature is high and rainfall is less10. In the present analysis, the chloride content varies from 60-260 mg/L. Most of the ground water samples show chloride concentration within the permissible limit (250 mg/L) of WHO, which indicates less contamination of chloride.
Fluoride (F-): Ground water contamination due to fluoride may be due to geological factors such as weathering of minerals, and decomposition of certain minerals in earth. High fluoride content in ground water causes serious damage to the teeth and bones of human system leads to dental fluorosis and skeletal fluorosis11&12. Hence excess fluoride should be removed from water and this process is called defluoridation. In the present case, the value of fluoride concentration in ground water samples lie between 0.0-0.3 mg/L. All the ground water samples have fluoride concentration within permissible limit (1.0 mg/L) of WHO.
Phosphate (PO43-): Domestic sewage, industrial effluents and agricultural run-off with fertilizers result in phosphate
ions in ground water. Due to ability of soils to retain phosphate and low solubility of native phosphate minerals, the ground water contains very minimum phosphate level ranging from 0 to 0.05 mg/L13 and are within the permissible limit of WHO (0.1mg/L)
Chemical Oxygen Demand (COD)
High level of COD indicates the presence of all forms of organic matter, both bio degradable and non biodegradable and hence the degree of pollution in water. It is the measure of oxygen consumed during the oxidation of organic matter. COD values observed in present locations were well within the prescribed limits and indicates that the water samples are not polluted beyond permissible limit. All the sampling locations were found to have from 20-55 mg/L of COD.
Biochemical Oxygen Demand (BOD)
Biological oxygen demand increases as the bio degradable organic content increases in water. BOD values above 10 mg/L in water body are considered to be polluted and in the present case the BOD values were from 3.8 mg/ to 8 mg/L. The values indicated that the organic load in the sampling location does not exceed the limits of WHO.
IV. CONCLUSION
Conclusively, the present study reveals that water quality parameters are well within the permissible limit. Slight deviation was observed in Madhavaram (S1) and Ramapuram (S8) with iron content might be due to industrial activity. BOD and COD values are also within the limit which indicates that less contaminants of wastes from its catchment area. From the observed results it is suggested to monitor the ground water quality periodically to prevent further contamination.
REFERENCES
1. Rao V.S, Prasanthi S., Shanmukha K.J.V. and Prasad K.R.S. Physicochemical analysis of water samples of Nujendla area in Guntur District, Andra Pradesh, India Int. J. Chem.Tech Res. 4(2), 2012, 691-699.
2. Maheswari J and Sankar K, Groundwater Quality ASSessment in Vaippar Reiver Basin Tamil Nadu, Indiam Int. J. of Current Research, 2011, 3(12), 149-152.
4. Mohamed Hanipha M. and Zahir Hussain A., Study of ground water quality at Dindigul town, Tamilnadu, India, Int. Res. J. Environment Sci., 2013, 2(1), 68-73.
5. Pradeep J. K., Hydrology and quality of ground water Hirapur district, Sagar (M.P.), Pollution Research, 1998, 17(1), 91-94.
6. Bhattacharya T., Chakraborty S. and Tuck Neha, Physicochemical characterization of ground water of Anand district, Gujrat, India, Int. Res. J. Environment Sci., 2012, 1(1), 28-33.
7. WHO, International standards for drinking water, World Health Organization, Geneva, 2004, 55-79.
8. Singh A., Khan A.H., Zaidi J., Singh S.K. and Verma H.S. WQI status of ground water based specific physicochemical characteristics around Jhansi fort, Bundelkhand, India, IJAET, 2013, 4(2), 17-19.
9. Hemalata Mahobe, Study of physico chemical characteristics of water ponds of Rajanandgaon town, Chattisgarh, International Journal of Scientific and Engineering Research, 2013, 4(8), 737-748.
10. Chapolikar A.D., Bharad J.V., Madje B.R., Chavan F.R and Ubale M.B. Int.J. chem.sci., 2009,7(1),475-480.
11. Ramanaiah S.V., Venkata M.S., Rajkumar B and Sharma P.N., Monitoring of Fluoride Concentration in ground water of Prakasham District in India: Correlation with physicochemical parameters, Journal of Environmental Science and Engg., 2006,48(2),129-134.
12. Dinesh C., Fluoride and Health Care for Cancers, Indian J. of Environ. Prot., 1998, 19(2), 87-89.