Comparative Study on Wind Load Analysis
Using Different Standards -A Review
Md Ahesan Md Hameed1, Amit Yennawar2
Student, Department of Civil Engineering, Sanmati Engineering College, SGB Amravati University, Amravati,
Maharashtra, India 1
Department of Civil Engineering, SGGSIE&T, Nanded, Maharashtra, India 2
ABSTRACT: Gusts at ground occurs because of turbulence due to friction, wind shear or by solar heating of the ground. These three factors can force the wind to rapidly change speed and direction. The main aim of this paper is to understand provisions of international standards and compare them with Indian standard.In this paper a comparative study of wind load analysisof RC buildings using three different codes is done as perIS 875 (Part-3):1987, IS 875 (Part-3):2015,ASCE 7-05 and AS/NZS 1170(Part 2)-2011
.
Wind loads are determined based on gust factor method and critical gust loads for design are calculated.KEYWORDS: IS 875 (Part-3):1987/2015, ASCE 7-05, AS/NZS 1170(Part 2)-2011, Gust, Wind load.
I.INTRODUCTION
In professional practice throughout the world, design wind loads for a vast majority of structures are evaluated on the basis of wind load provisions specified in standards and codes. For design of high rise structures wind load is a critical parameter especially for taller structures constructed in non-seismic area. For the analysis of wind load most of the countries as developed its own standards and related specification for effective analysis and design of structures.
Wind is the term used for air in motion and is usually applied to the natural horizontal motion of the atmosphere. Motion in a vertical or nearly vertical direction is called a current. Movement of air near the surface of the earth is three-dimensional, with horizontal motion much greater than the vertical motion. Vertical air motion is of importance in meteorology but is of less importance near the ground surface. On the other hand, the horizontal motion of air, particularly the gradual retardation of wind speed and the high turbulence that occurs near the ground surface, are of importance in building engineering.
The height of the tallest building changes year by year because skyscrapers are constructed constantly worldwide. With this development that buildings are rising, there will be a larger awareness of occupants comfort due to wind induced acceleration in the top floors of a high rise structure. So when the height of structure increases then the consideration of lateral load and other factors are very much important. For that the lateral load resisting system becomes more important than the structural system that only resists the gravitational loads. Wind effects on structures can be classified as “static” and “dynamic”. Static wind effect primarily causes elastic bending and twisting of structure. For tall, long span and slender structures dynamic analysis of the structure is essential, Wind gusts cause fluctuating forces on the structure which induce large dynamic motions, including oscillations.
Terminologies Used In Wind Load Analysis
Effective Frontal Area:The projected area of the structure normal to the direction of the wind
Element of Surface Area: The area of surface over which the pressure coefficient is taken to be constant
Force Coefficient:A non-dimensional coefficient such that the total wind force on a body is the product of the force coefficient, the dynamic pressure of the incident design wind speed and the reference area over which the force is required.
Ground Roughness:The nature of the earth‟s surface as influenced by small scale obstructions such as trees and
buildings (as distinct from topography) is called ground roughness.
Gust:Positive or negative departures of wind speed from its mean value, lasting for not more than, say, 2 minutes over a specified interval of time.
Peak Gust:Peak gust or peak gust speed is the wind speed associated with the maximum amplitude.
Gradient Height:Gradient height is the height above the mean ground level at which the gradient wind blows as a result of balance among pressure gradient force, carioles force and centrifugal force. For the purpose of this code, the gradient height is taken as the height above the mean ground level, above which the variation of wind speed with height need not be considered.
Mean Ground Level:The mean ground level is the average horizontal plane of the area enclosed by the boundaries of the structure.
Pressure Coefficient:Pressure coefficient is the ratio of the difference between the pressure acting at a point on a surface and the static pressure of the incident wind to the design wind pressure, where the static and design wind pressures are determined at the height of the point considered after taking into account the geographical location, terrain conditions and shielding effect. The pressure coefficient is also equal to [1 - (Vp/Vz) 2], where Vpis the actual
wind speed at any point on the structure at a height corresponding to that of Vz.
Terrain Category:Terrain category means the characteristics of the surface irregularities of an area which arise from natural or constructed features. The categories are numbered in increasing order of roughness.
Topography:The nature of the earth‟s surface as influenced the hill and valley configurations
Building Enclosed:A building that does not comply with the requirements for open or partially enclosed buildings
Building Envelope:Cladding, roofing, exterior walls, glazing, door assemblies, window assemblies, skylight assemblies, and other components enclosing the building[9].
Variation of Wind Velocity with Height
The viscosity of air reduces its velocity adjacent to earth‟s surface to almost zero, as shown in fig.1.A retarding effect
occurs in the wind layers near the ground and these innerlayers in turn successively slow the outer layers.The slowing down is reduced at each layer as the height increases, and eventually becomes negligibly small. The height at which velocity ceases to increase is called the gradient height, and the corresponding velocity, the gradient velocity. This characteristic of variation of wind velocity with height is a well-understood phenomenon, as evidenced by higher design pressures specified at higher elevations in most building codes.
The variation of wind speed with height is also dependent upon the ground roughness and is thus different for each terrain category, as can be visualized from Fig. 1. Wind blows at a given height, with lesser speed in rougher terrains and with higher speeds in smoother terrains. Further, in any terrain, wind speed increases along the height up to the gradient height and the values of the gradient heights are higher for rougher terrains. By definition, wind speeds beyond gradient heights in all terrains are equal. At any height in a given terrain, the magnitude of wind speed depends on the averaging time. Shorter the averaging time, the higher is the mean wind speed. Also it takes quite a distance, called fetch length, for wind to travel over a typical terrain to fully develop a stable velocity profile idealized for that terrain category.
a. Category 1 b. Category 2 a. Category 1 b. Category 2
c. Category 3 d
.
Category 4Figure 2 – Different Terrain Categories [15]
II.REVIEW OF LITERATURE
Following literatures are studied to compare wind load provisions specified in the major national standards i.e. IS 875 (Part-3):1987, ASCE 7-05 and AS/NZS 1170(Part 2)-2011.
and standards under similar flow conditions. This paper presents a comprehensive assessment of the source of this scatter through a comparison of the along-wind loads and their effects on tall buildings recommended by major international code sand standards. ASCE 7-98-United States, AS1170.2-89-Australia, NBC-1995 -Canada, RLB- AIJ-1993 -Japan, and Eurocode-1993-Europe are examined in this study.
Khaled M. Heiza and Magdy A. Tayel(2012),it is very important to consider the effects of wind and earthquakes load in the design of reinforced concrete structures, especially for tall buildings. The Egyptian Code of Practice for calculating loads and forces in Structural and Building Works, 1993 and 2003 proposed methods for determining such loads. The codes are reviewed for wind and earthquake analysis and discussed to show all factors affecting the design. A computer program is developed to analyse the structural buildings behaviour under wind pressure defined as well as equivalent static loads for earthquakes considering all factors in the codes.
Dr. B. Dean Kumar and Dr. B.L.P Swami(2012),In this paper, the proposed draft is studied and compared with the existing code i.e.IS: 875(Part1)-1987. Both the static and dynamic methods studied in the code are used for analysing the multi-story frames of 20 to 100 stories. The study includes the wind effects on structures located on the costal belt of the country and in the interior part of the country. Depending on the study, important conclusions and short comings in the existing code and proposed draft are pointed out. Also the importance of dynamic method is studied and pointed out after a comparison with the static method.
M.R Suresh, Pradeep K.M(2012),Aimof the present paper to study the effect and performance of outrigger system in 30 story building. The outrigger system is provided at different levels along the height of the building by varying the relative stiffness. Loads are considered as per Indian Standards IS: 875(Part1)-1987 and IS: 1893(Part-1) - 2002. The analysis is done with Equivalent static method for different seismic zones. The modelling and analysis were performed using finite element software ETABS 9.7.4.It is infer that, with the increase in relative stiffness of the outrigger system, there is a decrease in lateral displacement and inter-story drift. Further there is increase in base shear of the structure with higher relative stiffness in all seismic zones.
Kiran Kamath, N. Divya, Asha U Rao(2012), In the paper an investigation has been performed to determine the behaviour of various alternative 3D models using ETABS software for reinforced concrete structure with central core wall with outrigger and without outrigger by varying the relative flexural rigidity from 0.25 to 2.0 with step of 0.25. Also the position of outrigger has been varied along the height of the building by considering a parameter relative height of outrigger from 0.975 to 0.4. The parameters discussed in this paper include variation of bending moments, shear force, lateral deflection, peak acceleration of the core; inter-storey drifts for static and dynamic analysis for a 3-dimensional model for various values of relative rigidity and relative height. From the analysis of the results obtained it has been found that performance of the outrigger is most efficient for relative height of the outrigger equal to 0.5.
Muhammad AzharSaleem(2012),Their research work was focused on simplifying the wind load calculations for regular shaped tall buildings. A sixty storied reinforced concrete building was analysed for wind loads recommended by ASCE 7-05 and NBC 2005. Based on the analysis results, a simplified equation was developed for various exposure conditions. This simplified equation, along with exposure adjustment factor, is in reasonable agreement with the results provided by ASCE 7-05 and NBC 2005. In fact, the proposed equation provides conservative results in comparison with ASCE recommended method while a little liberal as compared to NBC 2005. It is therefore recommended that the wind loads calculated from the proposed equation be increased by 12% when results close to NBC 2005 are required, especially for buildings of height 100 ft. (30 m) and higher.
P.M.B. Raj Kiran Nanduri, B.Suresh, MD. IhteshamHussain(2013),The objective of this paper is to study the behaviour of outrigger and, outrigger location optimization and the efficiency of each outrigger when three outriggers are used in the structure. In Nine 30−storey three dimensional models of outrigger and belt truss system
are subjected to wind and earthquake load, analysed and compared to find the lateral displacement reduction related to the outrigger and belt truss system location. For 30−storey model, 23% maximum displacement reduction can be
achieved by providing first outrigger at the top and second outrigger in the structure height.
India- 2005 is most conservative while BNBC 1993 is most conservative in unobstructed open terrain type areas in terms of wind load among the comparing codes.
Dr. K. R. C. Reddy and Sandip A. Tupat(2014),In this paper present a comparative study of lateral load i.e.wind and earthquake loads to decide the design loads of a multistorey building. The importance of this work is to calculate the design loads of a structure which is subjected to wind and earthquake loads in a particular region. The wind loads so obtained on the building have been compared with that of earthquake loads. Finally it is found the wind loads are more critical than the earthquake loads in most of the cases. Based on the results obtained the following conclusions are made. The wind and earthquake loads increases with height of structure. Wind loads are more critical for tall structures than the earthquake loads. Structures should be designed for loads obtained in both directions independently for critical forces of wind or earthquake.
M. R. Wakchaure, SayaliGawali(2015), In this study, analytical investigation of different shapes of buildings are taken as an example and various analytical approaches are performed on the building. These plans are modelled and wind loads are found out according to I.S 875(part 3)-1987 by taking gust factor and without taking gust factor. These models are compared in different aspects such as storey drift, storey displacement, storey shear, etc. for different shapes of buildings by using finite element software package ETAB‟s 13.1.1v. Among these results, which shape of
building provide sound wind loading to the structure as well as the structural efficiency would be selected. Muftha A. Abdusemed and Ashok K. Ahuja(2015),Present paper describes the experimental study carried out on the models of high rise buildings with varying cross-sectional shapes under both stand-alone condition and interference condition. The models are tested in an open circuit boundary layer wind tunnel. Twisting moment developed due to wind is measured in addition to base shear and base moment in along-wind direction as well as across-wind direction. Effect of wind incidence angle on wind loads is studied in case of isolated condition. In case of interference condition, effect of distance between object building and interfering building on wind loads is studied.
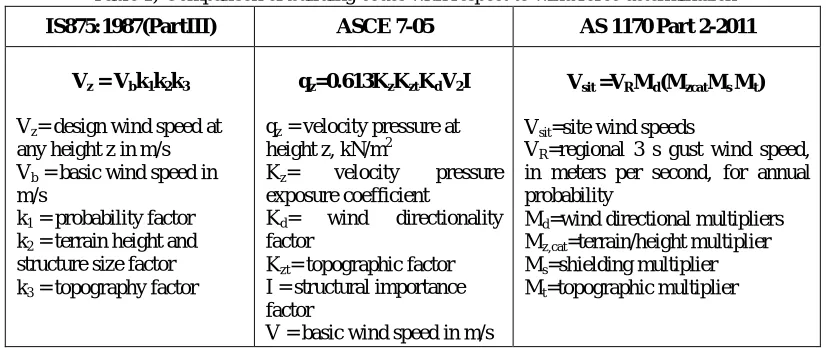
Comparison of Important Parameters
Comparison of important parameters from international standards with Indian standard is given in table a The table shows the variation of parameters such as design wind speed, design wind pressures, pressure coefficients and gust loading factor.
Table 1) Comparison of building codes with respect to wind force determination
IS875:1987(PartIII) ASCE 7-05 AS 1170 Part 2-2011
Vz = Vbk1k2k3
Vz= design wind speed at
any height z in m/s Vb = basic wind speed in
m/s
k1 = probability factor
k2 = terrain height and
structure size factor k3 = topography factor
qz=0.613KzKztKdV2I
qz = velocity pressure at
height z, kN/m2
Kz= velocity pressure
exposure coefficient
Kd= wind directionality
factor
Kzt= topographic factor
I = structural importance factor
V = basic wind speed in m/s
Vsit =VRMd(MzcatMs Mt)
Vsit=site wind speeds
VR=regional 3 s gust wind speed,
in meters per second, for annual probability
Md=wind directional multipliers
Mz,cat=terrain/height multiplier
Ms=shielding multiplier
Pz = 0.6 Vz²
Pz= design wind pressure in N/m2 at height z
V = design wind speed at any height z in m/s
P=qGCp–qi (GCpi)
p = design wind pressure q = qzfor windward walls
evaluated at height z above the ground
G = gust effect factor Cp= external pressure coefficient
GCpi=internal pressure coefficient
P=(0.5pair)(Vdes,o)2Cfig dyn C
P=Design wind pressure Pair = density of air=1.2 kg/m3 Vdcs,o= building orthogonal design
wind speeds
Cfig =aerodynamic shape factor
Cdyn =dynamic factor
III.CONCLUSION
1) The gust factor decreases with the height because as the height of the frame increases the fundamental frequency decreases.
2) Indian and Australian standards having same terrain categories.
3) Indian and Australian standards gives variation in forces as the terrain category are changed, whereas in American standard does not give any variation in forces.
4) Australian code gives higher forces in zone 1 because use of importance factor (Mi) and use of higher terrain multiplier for cyclonic areas.
5) Indian code has prescribed class of structure, based on largest dimension; other codes have not defined class of structures.
6) Australian standard gives lower value of bending moment along Y-direction and displacement along X&Y direction whereas American standards give higher values as per Indian load combination and loading combinations prescribed in various codes.
7) The American and Australian standard gives lower value of axial, shears forces, torsional moment and bending moment along Z-direction as per Indian load combination and loading combinations prescribed in various codes.
REFERENCES
[1] A. J. Bowen, “Engineering aspects of the wind” Department of Mechanical Engineering, University of Canterbury, Christchurch.
[2] Dr. B.Dean Kumar, “Critical Gust Pressures on Tall Building Frames-Review of Codal Provisions” Dept. of Civil Engineering JNTUH College of Engineering Hyderabad, INDIA international Journal of Advanced Technology in Civil Engineering, ISSN: 2231 –5721, Volume-1, Issue-2, 2012.
[3] Dr. K. R. C. Reddy and Sandip A. Tupat, “ The effect of zone factors on wind and earthquake loads of high-rise structures” Department of Civil Engineering, Kavikul guru Institute of Technology and Science. Ramtek-441106, Dist. Nagpur, India IOSR Journal of Mechanical and Civil Engineering (IOSR-JMCE) e-ISSN: 2278-1684, p-ISSN: 2320-334X PP 53-58.
[4] Jean-Paul Pinelli and Emil Simiu “Hurricane Damage Prediction Model for Residential Structures” Journal of Structural Engineering © Asce / November 2004 / 1691.
[5] Kiran Kamath, N. Divya, Asha U Rao, “A Study on Static and Dynamic Behavior of Outrigger Structural System for Tall Buildings” Bonfring International Journal of Industrial Engineering and Management Science, Vol. 2, No. 4, December 2012.
[6] K. Suresh Kumar, “Commentary on the Indian Standard for Wind Loads” RWDI India, T5 Thejaswini, Technopark, Trivandrum, Kerala, India 13th International Conference on Wind Engineering, Amsterdam, The Netherlands,July 10-15, 2011.
[7] Khaled M. Heiza and Magdy A. Tayel ,”comparative study of the effects of windand earthquake loads on high-rise buildings” Civil Engineering Department, Faculty of Engineering, Menoufiya University, EGYPT.
[8] Muhammad AzharSaleem, “wind load calculations: is simplification possible” Department of Civil Engineering, University of Engineering and Technology Lahore, Pakistan Pak. J. Statist.2012 Vol. 28(4), 485-493.
[9] M.R Suresh,PradeepK.M,“Influence of Outrigger System in RC Structures for Different Seismic Zones”International Journal for Scientific Research & Development Vol. 3, Issue 05, 2015 ISSN (online): 2321-0613.
[11] R. M. FAYSAL,” Comparison of Wind Load among BNBC and other Codes in different type of areas.” Faculty of Civil Engineering, Bangladesh University of Engineering and Technology, Bangladesh, International Journal of Advanced Structures and Geotechnical Engineering ISSN 2319-5347, Vol. 03, No. 03, July 2014.
[12] Yin Zhou, Tracy Kijewski, and Ahsan Kareem,” along-wind load effects on tall buildings: comparative study of major international codes and standards” M.ASCE3Journal Of Structural Engineering / June 2002 / 789.
[13] American Standard ASCE 05-7, “Minimum Design Loads for Buildings and Other Structures”.
[14] Australian/New Zealand Standard AS/NZS 1170.2:2011, “Structural Design Actions Part 2 - Wind actions”.
[15] A Commentary on Indian Standard Code of practice for design loads (other than earthquake) For buildings and structures Part 3 Wind Loads (Second Revision)by Dr.PremKrishna,Dr. Krishan Kumar,Dr. N.M.BhandariDepartment of Civil EngineeringIndian Institute of Technology Roorkee.
[16] An Explanatory handbook on “Indian Standard Code Practice for Design Loads” (other than earthquake) for buildings and structures part 3 wind loads [IS 875 (Part 3): 1987]” , Bureau of Indian standards, New Delhi.
[17] An Explanatory handbook on “Proposed IS 875 (Part 3) wind loads on buildings and structures” by Dr. N. M. Bhandari, Dr. Prem Krishna, Dr.Krishen Kumar, Department of Civil engineering, Indian Institute of Technology, Roorkee and Dr.Abhay Gupta, Department of Civil engineering, Shri. G. S. Institute of Technology and Science, Indore.
[18] Indian Standard IS 875 (Part-3):1987, Code of practice for design loads (Other than earthquake) for buildings and structures”
![Figure 1 – Boundary Layer Profile for Different Approach Terrains[19]](https://thumb-us.123doks.com/thumbv2/123dok_us/1501941.1183850/2.595.197.418.608.757/figure-boundary-layer-profile-different-approach-terrains.webp)
![Figure 2 – Different Terrain Categories [15]](https://thumb-us.123doks.com/thumbv2/123dok_us/1501941.1183850/3.595.137.469.303.671/figure-different-terrain-categories.webp)