RIESER, TORREY ELIZABETH. The Language of Performance: the Link between Language, Personality and Performance. (Under the direction of Samuel Pond.)
The purpose of this research has been to assess the relationships between language use, personality and performance ratings. More specifically, this research attempted to assess whether writing style could predict student
PERSONAL BIOGRAPHY
Torrey E. Rieser is a graduate of the University of North Carolina at Chapel Hill where she received Bachelor of Arts degrees in Psychology and Romance Languages – Spanish
TABLE OF CONTENTS
PAGE
LIST OF TABLES ……….……….. iv
LIST OF FIGURES ……….……… v
1. INTRODUCTION ………..……….……… 1
2. LITERATURE REVIEW …….……… 2
2.1 Language ……….……….……... 3
2.2 Personality ………. 7
2.3 Performance ………..……….……….. 17
3. METHOD ……….………...……… 31
3.1 Participants ……….………..………... 31
3.2 Materials ………..……….………. 34
3.3 Procedure ………..……….………. 38
4. RESULTS ………...………...………. 40
5. DISCUSSION …………..………...………… 58
6. REFERENCES ………..………. 66
7. APPENDICES ……… 74
7.1 LIWC Dimensions ……… 74
LIST OF TABLES
PAGE
Table 1. Applicant Demographic Information ………. 32
Table 2. Eigenvalues for Language Factors ……….………… 41
Table 3. Rotated Factor Pattern of Language Factors ………..………. 41
Table 4. Language Subcategory Correlation Matrix ………. 42
Table 5. Language Analysis of Variance ………... 44
Table 6. Means and Standard Deviations for Language Factors ……….. 45
Table 7. Personality and Language Factor Correlations ……….….. 47
Table 8. Eigenvalues for Performance Factors …….………. 49
Table 9. Rotated Factor Pattern of Two-Factor Performance Model ………. 50
Table 10. Rotated Factor Pattern of Four-Factor Performance Model ……… 50
Table 11. Confirmatory Factor Analysis: Fit Indices ………. 51
Table 12. Language and Performance Factor Correlations ……..………. 52
Table 13. Language Factors in the Prediction of Performance Factors ………. 53
Table 14. Personality and Performance Factor Correlations ………. 54
Table 15. Personality Factors in the Prediction of Performance Factors ……… 55
Table 16. Stepwise Regression Analyses on Student Performance ……… 56
LIST OF FIGURES
PAGE
LITERATURE REVIEW
1. Graphical representation of the Pennebaker and King (1999) study results and proposed relationships between
language and personality of this thesis research study. ………. 8
2. Proposed relationships between personality and
performance factors. ………. 25
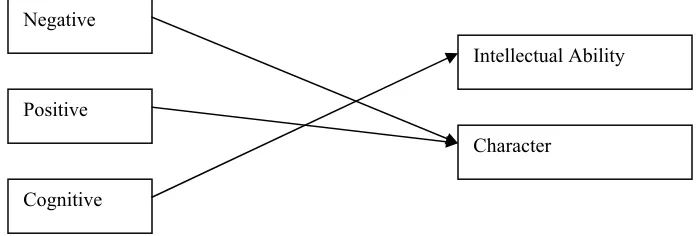
3. Proposed relationships between language and
performance dimensions. ………. 29
4. Proposed full model of the relationships between
Introduction
Previous researchers have established links between language and personality (Pennebaker and Francis, 1999) and personality and performance
(Barrick & Mount, 1991; Tett, Jackson, & Rothstein, 1991; Piedmont & Weinstein, 1994;Barrick, Mount & Judge, 2001), but have neglected to
investigate the direct link between language and performance. This research investigation will attempt to find a direct relationship between language and performance as well as determine what amount of variance in language is
accounted for by personality.
Applicants to university and scholarship programs are typically asket to
submit essays in their application materials. In this research, application essays written by members of two student samples drawn from a university scholarship program were content analyzed. Using existing content dimensions contained in
the Linguistic Inquiry and Word Count (LIWC, Pennebaker and Francis, 1999), applicants who were selected to the program were successfully discriminated from applicants who were not selected to the program. Given the success of this
discrimination procedure, the next step was to determine the extent to which text analysis information could be used to predict applicant success in the scholarship
Literature Review
Pennebaker and King (1999) found that linguistic style is an independent marker of one’s personality after correlating categories of the Linguistic Inquiry
and Word Count (LIWC) with the Five-Factor Model personality dimensions. This finding should not be surprising, however, because it was a perusal of the
English dictionary by Galton in 1884 for personality descriptive terms that began a taxonomy of personality. This taxonomy was sharpened by Allport and Odbert (1936), Cattell (1943), and Norman (1967), and through the use of factor
analyses, ultimately led to the development of the Five-Factor Model of personality (FFM) that is so commonly used today. In fact, Goldberg (1990)
confirmed that an analysis of any large sample of English trait adjectives results in a five-factor structure. These five factors have been named Neuroticism (or Emotional Stability or Need for Stability), Extraversion, Openness to Experience,
Agreeableness, and Conscientiousness (McCrae & Costa, 1987).
Research on job performance using the FFM has found that at least two of the five factors, Conscientiousness and Neuroticism, are reliable, valid predictors
of overall job performance measures (Barrick, Mount, & Judge, 2001) and performance motivation (Judge & Ilies, 2002). Though the remaining three
factors do not predict overall job performance measures in all studies, they do reliably predict important specific performance criteria. Extraversion has been found to relate significantly to teamwork, training performance, leadership,
interpersonal facilitation and goal-setting motivation (Hurtz & Donovan, 2000; Judge & Ilies, 2002). Openness to Experience relates to training proficiency and training performance (Salgado, 1997). In addition to overall job performance,
Neuroticism is a valid predictor of teamwork, and Conscientiousness predicts teamwork and training performance (Barrick, Mount, & Judge, 2001).
This research study explored the relationships between language and performance by performing a text analysis procedure on a group of student essays. Relationships were investigated between language dimensions and the
FFM using the NEO PI-R (Costa & McCrae, 1992). In addition, the relationships between personality factors and important performance criteria as defined by the
scholarship program were determined. Finally, performance ratings were predicted using dimensions based on the text analysis of the student application essays. The following sections will discuss the key points and the recent trends
found in the language, personality, and performance literatures. By discussing these concepts in this order, I will clarify the links between language and personality and between personality and performance in order to establish the
proposed direct link between language and performance.
Language
Research in language and psychology is revealing many interesting insights to the realm of human functioning. Extensive research has found that
unemployed workers finding new jobs faster (Pennebaker & Seagal, 1999; Pennebaker & Graybeal, 2001). Importantly, these results are similar across cultures, social classes, and personality types (Pennebaker & Graybeal, 2001).
Text analysis has rapidly become an efficient way of studying language. It is a non-invasive, reliable, and blind procedure that can be used to evaluate
interviews, letters, diaries, survey responses, TAT protocols, scripts of therapy sessions, essays, electronic mail, and newspaper stories without having to directly involve the writer or speaker (Zullow, Oettinger, Peterson, & Seligman, 1988;
Lee & Peterson, 1997; Daw, 2001). Lee and Peterson (1997) argue that text analysis is particularly useful for measuring cognitive variables and constructs,
and that its use is particularly advantageous for the expansion of the participant pool to include the famous, dead, unavailable, or in the case of this study, large numbers of student essays.
Zullow and Seligman (1990) analyzed 20 nomination speeches from Democratic and Republican conventions and found that pessimistic rumination predicted which candidate lost the election 90 percent of the time. In a procedure
that Zullow et. al. (1988) called content analysis of verbatim explanations
(CAVing), text analysis, or content analysis, applied to transcribed psychotherapy
sessions helped predict mood swings and depression by looking at patients’ causal explanations of events. They found that pessimistic explanations predicted
depressive behavior, while optimistic explanations predicted non-depressive
Other researchers, such as Mergenthaler (1996) and Pennebaker, Francis, and Mayne (1997), have used similar text analysis procedures. Mergenthaler chose to research emotional tone, or the density of emotion words within an area
of text, due to its importance in many psychotherapies. Pennebaker, Francis, and Mayne (1997), using transcripts from two brief interviews, found that increases in
insightful and causal thinking and increases in positive emotion words improved health and student grades. Importantly, the text analysis of the two interviews in this study predicted self-reports and behaviors one year later.
The impressive results of these studies led researchers to believe that examining linguistic style was an independent and meaningful way of researching
personality style and cognitive processing. Language serves as a marker of individual differences, and language variables show consistency across time and context (Pennebaker & Graybeal, 2001). Individuals express themselves verbally
and through written language with their own unique styles. By analyzing word frequencies, it has been possible to establish the identities of the authors of biblical and literary works, to understand the speaking styles of political leaders,
and to distinguish the authors of letters written by soldiers in the 1800s
(Pennebaker & King, 1999). It is also possible to monitor employee moods by
detecting changes in negativity in an employee’s electronic mailings, and to detect fraud (Daw, 2001; Dyrness, 2002). Due to the many benefits of text analysis, researchers have recently developed a sophisticated technique hoping to influence
Pennebaker and King (1999) have created a word-based counting system called the Linguistic Inquiry and Word Count (LIWC). Most text analysis programs using word counts are unable to consider context, irony, sarcasm, and
multiple word meanings, and, therefore, have seldom been used by social and personality psychologists. However, judges independently rated the LIWC’s
dictionaries. These ratings were then compared with LIWC analyses of the same text. The strong correlations between judge’s ratings and LIWC analyses of the text helped to establish a more sophisticated and valid picture of text analysis
through word counts (Pennebaker & King, 1999).
The LIWC has demonstrated its success in many recent studies. The
following studies have all used the LIWC in their analyses. Pennebaker and Seagal (1999) assessed improvements in mental and physical health, and found that those who benefit most from writing over time use more positive emotion
words, a moderate amount of negative emotion words, and an increased use of cognitive words over time. Similarly, Klein and Boals (2001) determined that the increased use of causal and insight words is associated with greater working
memory improvements, which may help to explain why writing improves health. Pennebaker, Crow, Dabbs, and Price (2001) were able to extract linguistic
categories from recorded daily conversations, and Stirman and Pennebaker (2001) were able to find linguistic predictors of suicide. Most recently, Pennebaker (2002) found that, in general, patterns in articles, prepositions, conjunctions, and
Substantial amounts of research have shown the usefulness of the LIWC in research on language, which leads to my first hypothesis: content analysis of a combination of the essays from the Sample 1 and the Sample 2 will discriminate
between those applicants selected to the scholarship program and those not selected to the program.
The next section of this research paper will concentrate on the link between language and personality as well as the development of the Five-Factor Model of personality. This section will also elaborate on the proposed
relationships between dimensions of language and personality.
Personality
It is generally known that people have their own styles of expression through both written and spoken language. Literary works and even personal
letters have been analyzed by assessing word frequencies to determine their authors. However, social and personality psychologists have paid little attention to text analysis in naturally occurring language and instead have relied on
self-reports of personality (Pennebaker & King, 1999). The research that exists on personality correlates of language usually centers on speech and speech styles or
patterns. For instance, Furnham (1990) studied the relationship between
extraversion and frequency of silent pauses and amount of verbal productivity. In addressing the gap between text analysis in language and self-reports of
text analysis to personality assessment more feasible (Pennebaker & Francis, 1999).
Linguistic style is an independent marker of one’s personality (Pennebaker
& King, 1999). When correlating LIWC categories with the FFM dimensions, Pennebaker and King (1999) found significant, reliable correlations between
Neuroticism and use of negative and positive emotion words (r = .13 and r = -.13 respectively), Extraversion and use of positive (r = .15) and negative emotion words (r = -.08), Agreeableness and use of positive (r = .07) and negative emotion
words (r = -.15), Conscientiousness and use of positive (r = .07) and negative emotions words (r = -.15), and Openness with use of insight (r = .07) and
causation (r = -.08) words. See Figure 1 for a graphical representation of these relationships.
Figure 1: Graphical representation of the Pennebaker and King (1999) study results and proposed relationships between language and personality of this thesis research study.
Negative Emotion Words
Positive Emotion Words Cognitive Thinking Words Neuroticism
Extraversion
Agreeableness
Conscientiousness
Though correlations between personality and linguistic style are not large, they are consistent throughout the literature (Digman & Takemoto-Chock, 1981; Barrick & Mount, 1991; Tett, Jackson & Rothstein, 1991; Pennebaker & King,
1999). This research study will attempt to replicate and build upon the findings of the Pennebaker and King (1999) study (see Figure 1). Despite the relatively small
correlations, Pennebaker and Graybeal (2001) stated that “language use correlates with real-world behaviors at least as highly as many traditional personality
dimensions” after text analysis of student essays revealed correlations between
language use and physical health, alcohol use, and school grades.
Pennebaker and Francis (1999) and Pennebaker and Graybeal (2001)
found word category usage to be stable across time and writing topic, offering evidence that language use is a reliable individual difference, or personality style. However, as Goldberg (1981) asked himself, of all the individual differences that
one can observe, which are the most important? The more important an individual difference is the more likely it will be noticed and talked about, and therefore, the more likely different languages will have invented a term for it.
Hence, it became useful to look for personality in studies of words and language. For example, English has only one word for camel, while Nomadic Arabs have
twenty. In their climate, it makes sense to distinguish between certain types of camels, while most Americans do not have that need (Sternberg, 2003). This same process occurs for words used to describe people. Relating more to
behavior similar to schizophrenia, anxiety, and depression are noticeable enough that almost every language has a term for them (Murphy, 1976; Morice, 1978). It is in these studies of language trait terms that the FFM has its origins (McCrae &
John, 1992).
The search for personality factors necessarily began in the natural
language. For the layperson, personality is defined by the words one uses everyday to describe friends, family, and co-workers. Using these words is the basic way in which one understands others and oneself. Therefore, a theory of
personality must explain how individuals use linguistic terms in everyday life (McCrae & John, 1992).
In 1936, Allport and Odbert began the daunting task of cataloging some 18,000 personality terms from a perusal of the Webster’s 1925 Second Edition English Dictionary. These terms were divided into four lists, the first of which was categorized as “biophysical,” or stable, traits. Of these approximately 4,500 terms, plus some psychological terms that he added, Cattell (1943) constructed 171 scales and had judges use them to rate people whom they knew. Cattell then
developed a set of 36 bipolar clusters of related terms based on the correlations among the different ratings, and constructed rating scales, including the 16
Personality Factors Questionnaire (16PF). However, when Fiske (1949) as well as Digman and Takemoto-Chock (1981) later factor analyzed Cattell’s data, they found only five factors.
structure was supported, and concluded that virtually all English trait terms can be represented within the same model. By explaining as much as possible with these five factors, and then looking for communalities in what was left to be
explained, a systematic mapping of personality was finally possible (McCrae & John, 1992). The result was the birth of the Five-Factor Model of personality, or
the “Big Five.”
The FFM is a version of trait theory, which states that the five basic factors of Neuroticism, Extraversion, Openness to Experience, Agreeableness,
and Conscientiousness sufficiently summarize how individuals differ in their “enduring, interpersonal, experiential, attitudinal, and motivational styles”
(McCrae, 1991). The FFM represents the dimensions of personality on a broad level with five heterogeneous and inclusive domains (Briggs, 1992).
Neuroticism measures such emotions as fear, guilt, anxiety, depression,
embarrassment, insecurity, and frustration. It contrasts emotional stability with maladjustment. Individuals scoring high in Neuroticism tend to have irrational ideas, difficulty controlling their impulses, and trouble coping with stress (Costa
& McCrae, 1992). Those who score high on this factor tend to choose jobs that have set routines, are less complex, and require more teamwork rather than
independent work (Lindley & Borgen, 2000). Individuals scoring low on Neuroticism are calm, relaxed, even-tempered, and face stress easily (Costa & McCrae, 1992).
individuals like social gatherings and prefer large groups rather than being alone. The opposite end of this scale, Introversion, is represented by adjectives such as reserved, independent, and even-paced (Barrick & Mount, 1991; Costa &
McCrae, 1992).
Openness to Experience is associated with the importance of
self-actualization, imagination, culture, originality, aesthetic sensitivity, intellectual curiosity, and liberality. These individuals are more often likely to entertain novel ideas, to experience strong emotions more than others, and to live experientially
richer lives. Low scorers on this domain tend to be conventional and
conservative. They prefer routines and are reserved in their emotions. Openness
to Experience is related to certain aspects of intelligence, such as divergent thinking, or creativity. While it includes aspects of intellectual ability, Openness to Experience and intelligence are separate and distinct factors (McCrae & John,
1992; Costa & McCrae, 1992).
Individuals scoring high in Agreeableness show trust, support, sympathy, cooperation, courtesy, flexibility, forgiveness, tolerance, and are team-oriented.
These individuals are altruistic and while eager to help others, believe that others will reciprocate in similar fashion. Those scoring low on Agreeableness are
egocentric, skeptical, and competitive. Even though low scorers may seem maladjusted, their skepticism often leads to accuracy in scientific analyses (McCrae, 1991; Costa & McCrae, 1992)
hardworking, responsible, careful, persevering, strong-willed, and
self-disciplined. High scores are related to academic and occupational achievement, while low scores relate to extreme tidiness and overworking (Barrick & Mount,
1991; McCrae, 1991; Costa & McCrae, 1992; Lindley & Borgen, 2000). While many researchers have worked to expand the descriptions of these five personality
dimensions, McCrae and Costa have been very important in their development and use today.
McCrae and Costa have made crucial contributions to the development of
this taxonomy of personality. In 1980, they began work on an instrument to classify personality traits using items based on analyses of standardized
questionnaires. They called the resulting instrument the NEO Inventory (NEO-I) due to the fact that the original instrument was built around only three of the major personality domains, Neuroticism, Extraversion, and Openness to
Experience. This instrument also re-named Norman’s Culture factor to Openness to Experience. Mental ability they argued, though related to Openness to
Experience, was really a separate factor (Costa & McCrae, 1980). McCrae and
Costa (1987) believed that if the FFM was to be representative of personality, it had to be found in both measures of trait adjectives and questionnaires, as well as
in self-reports and observer ratings. The lexical approach was limited to those personality descriptive terms existing in language, while the questionnaire approach allowed more theoretical characteristics (McCrae & John, 1992).
By 1985, McCrae and Costa had found substantial correlations between personality models based on adjective factors and those based on standardized questionnaires as well as strong validity coefficients with both self-reports and
peer ratings. These findings led to the empirical justification of the
correspondence between the two approaches and to the addition of two more
factors to their model, Agreeableness and Conscientiousness. This five-factor inventory was renamed the NEO-Personality Inventory (NEO-PI) and measured all five factors as well as specific facets defining each factor. The NEO-PI
consists of two forms: Form S is used for self-reports, and Form R is used by raters. Moderate-to-strong correlations were found between the NEO-PI and
other inventories such as the Eysenk Personality Inventory, the
Guilford-Zimmerman Temperament Survey, five measures of well-being, the Myers-Briggs Type Indicator, and the Holland Self-Directed Search (Dolliver, 1987;
MacDonald, Anderson, Tsagarakis, Holland, 1994). Factor analysis also showed substantial correlations between the needs assessed by Jackson’s Personality Research Form (PRF) and the NEO-PI, demonstrating that there is no need to
develop separate measures or taxonomies for traits and needs (Costa & McCrae, 1988). Re-test coefficients for the NEO-PI are very high, emphasizing the
stability of individual differences (McCrae, 1991).
The NEO-PI (Costa & McCrae, 1992) and the Hogan Personality
Inventory (HPI) (Hogan, 1986) are the only two inventories developed explicitly
validity, and to ensure that the five factors would replicate across a variety of observers. Using virtually every personality inventory available, Costa and McCrae have uncovered the same five-factor structure consistently with the
NEO-PI (Briggs, 1992). Hogan, on the other hand, began with work on the FFM, but changed his focus to predicting work-related performance criteria. The HPI is,
therefore, a less faithful measure of the FFM when compared to the NEO-PI (Briggs, 1992).
The comprehensiveness of the FFM has been supported by research in
both natural language adjectives and standardized personality questionnaires. The same five factors are found in self-reports and ratings, in children, college
students, older adults, men and women, and in English, Dutch, German, and Japanese samples (John, 1990; McCrae & John, 1992). The factors have also shown convergent and discriminate validity across instruments and observers, and
have endured for decades in adult samples (McCrae & Costa, 1990). Heritability estimates of the five factors are quite high. Agreeableness reaches uncorrected estimates of .39, while Extraversion reaches .49 (Bouchard, 1997). Though the
FFM may not be the last model to ever describe personality, some version of these five traits are needed to accurately describe individual differences because
these five factors are found either singly, or in combination, in virtually all personality instruments (McCrae & John, 1992).
Many researchers argue that the FFM is too broad and insufficient in
Rather, they propose that having five broad factors can help organize a much larger number of traits (Lindley & Borgen, 2000). Because the five factors represent the highest hierarchical level of trait description, they may not
encompass every description of personality, but it is highly unlikely that there are additional common factors given the increasing support for the
comprehensiveness of the FFM (McCrae & John, 1992). Occasionally studies will show evidence of more than five factors in their analyses, but these extra factors have never been replicable and are most likely due to differences in
methodology and sampling (Lanning & Gough, 1991; Goldberg, 1990). Some researchers argue that all five factors are unnecessary (Zuckerman, Kuhlman, &
Camac, 1988; Peabody, 1987). However, empirical analyses have consistently supported the need for all five factors (McCrae & Costa, 1987; Goldberg, 1990; Fleenor & Eastman, 1997). Given the overwhelming support for and ease of
classification with the FFM, many researchers have begun to relate these five personality domains to other behaviors, such as job performance (Barrick & Mount, 1991; Tett, Jackson, & Rothstein, 1991; Barrick, Mount, & Judge, 2001).
Due to the comprehensiveness of the NEO-PI in assessing the five factors of personality and the ability of the LIWC to use text analysis to identify these
five domains, my second hypothesis is: language factors found by the LIWC will be related to the five personality domains assessed by the NEO-PI. Specifically, a Positive language factor will include LIWC categories related to positive
factor will include LIWC categories related to insight and causality. My third hypothesis is: the Positive and Negative factors will be related to
Conscientiousness, Extraversion, Agreeableness, and Neuroticism, and the
Cognitive factor will be related to Openness to Experience (see Figure 1).
Performance
Until the last 20 years, research on the relationship between personality and performance showed dismal and inconclusive results due to a lack of clarity
about the personality traits and indecision on how they were to be classified. In addition, literature on the subject was largely lacking in quantitative studies and
did not correct for study artifacts that deflated validity estimates. Relationships between the personality traits and performance criteria were undeniably difficult to uncover under these circumstances (Barrick, Mount, & Judge, 2001).
Since the 1980’s, the FFM has revolutionized the way researchers look at the relationships between personality and performance. Recent research, meta-analysis in particular, has shown that factors of personality can consistently
predict job performance (Barrick & Mount, 1991; Tett, Jackson, & Rothstein, 1991; Piedmont & Weinstein, 1994; Barrick, Mount, & Judge, 2001). Corrected
estimates of the overall relationship between personality and job performance are usually in the .20s to .30s, though the estimate increases if job analysis is used to select predictors (Tett, Jackson, & Rothstein, 1991). The estimates are lower than
ability due to the diversity of personality traits necessary for different jobs (Anastasi, 1985). Because personality provides information about individuals in addition to cognitive ability measures, the use of both methods creates a powerful
predictive combination for selection purposes (Piedmont & Weinstein, 1994; Oakes, Ferris, Martocchio, Buckley & Broach, 2001). In addition, larger
correlations between personality and performance may be found with better-developed measures of performance (Furnham, Crump, & Whelan, 1997). Well-developed personality measures also combat adverse impact for minority
applicants, and increase productivity and social justice with their use in pre-employment screening. Though some gender differences do exist in personality,
these differences do not result in differential selection rates when applying for jobs (Hogan, Hogan, & Roberts, 1996).
Conscientiousness consistently predicts all job performance criteria for all
occupational groups with validity estimates generally in the .20s (Hough et. al., 1990; Furnham, Crump, & Whelan, 1997; Barrick & Mount, 1991; Barrick & Mount, 1993; Piedmont & Weinstein, 1994; Furnham & Coveney, 1996; Salgado,
1997; Hurtz & Donovan, 2000; Barrick, Mount, & Judge, 2001). This
relationship makes intuitive sense because possessing characteristics such as
hard-working, responsible, persevering, and achievement-oriented are important in all occupations (Barrick & Mount, 1991). Conscientiousness is also a positive predictor of teamwork and training performance (Barrick, Mount, & Judge, 2001)
that competence, achievement striving, and self-discipline were important characteristics underlying successful performance in every rated area. Furnham, Crump, and Whelan (1997) found that Conscientiousness correlates highly with
manager capability ratings of “Drive to Achieve” and “Internal Locus of Control,” and Judge and Ilies (2002) found Conscientiousness to be a consistent correlate of
performance motivation with an average validity of r = .24. Conscientiousness has also been found to highly relate to citizenship performance, including helping others with their jobs, organizational support, and volunteering for additional
work. This aspect of Conscientiousness is particularly important because these activities, unlike task-oriented activities, are similar across most jobs (Borman,
Penner, Allen, & Motowidlo, 2001).
Conscientiousness has also consistently correlated with educational achievement. Peer ratings on this factor correlated .43 with first-year college
grades, and teacher ratings correlated .70 with educational achievement earned in high school. This factor is also correlated .60 with vocational achievement (Digman & Takemoto-Chock, 1981; Smith, 1967). Women tend to score higher
than men do on Conscientiousness (Hogan & Hogan, 1995). Overall,
Conscientiousness relates more highly to job and academic performance than any
other personality factor, and should maintain a large role in any theory attempting to explain these types of performance (Barrick, Mount, & Judge, 2001).
Extraversion shows consistent relationships with occupations involving
significantly relate to overall job performance when using self-report measures, such as the NEO-PI, and supervisor ratings (Barrick & Mount, 1993; Furnham, Crump, & Whelan, 1997; Piedmont & Weinstein, 1994). Mount, Barrick, and
Strauss (1994), however, found mixed results. They discovered that while observer ratings of Extraversion predicted performance, self-ratings did not.
Recent research by Barrick, Mount, and Judge (2001) has found that while the relationship between Extraversion and performance reaches estimates of .15, with a 90% confidence interval, the correlation is indistinguishable from zero.
However, they did find positive correlations between Extraversion and teamwork, training performance, and managerial performance. Furnham, Crump, and
Whelan (1997) found high correlations between Extraversion and “Social Adaptability” and “Optimism,” and Judge and Ilies (2002) found a moderately strong correlation between Extraversion and self-efficacy motivation.
Importantly, Judge, Bono, Ilies and Gerhardt (2002) found that Extraversion was the most consistent correlate of leadership among the Big Five, with a correlation coefficient estimated at r = .31. Ployhart, Lin and Chan (2001) found that
Extraversion predicted both typical and maximum ratings of transformational leadership performance. Women are generally more extraverted than men
(Furnham & Stringfield, 1993). It seems that while a significant relationship between Extraversion and overall job performance may not be consistent, there is sufficient support that Extraversion is significantly related to certain components
Individuals possessing characteristics of Neuroticism would be less successful at work due to traits such as anxiety, insecurity, and depression, which tend to inhibit job tasks (Barrick & Mount, 1991). High scores of Neuroticism are
consistent negative predictors of job performance, performance motivation (Judge & Ilies, 2002), leadership (Judge, Bono, Ilies & Gerhardt, 2002), ratings of
interpersonal relations, absenteeism, and adaptive capacity (Tett, Jackson & Rothstein, 1991; Furnham, 1994; Piedmont & Weinstein, 1994; Furnham & Coveney, 1996; Barrick, Mount, & Judge, 2001). However, high scores of
Neuroticism are positive predictors of teamwork (Barrick, Mount, & Judge, 2001), training proficiency, (Salgado, 1997), typical transformational leadership
performance (Ployhart, Lin & Chan, 2001) and counterproductive work behavior (Penner & Spector, 2002). Furnham (1994) failed to find a relationship between Neuroticism and productivity, but Furnham, Crump, and Whelan (1997) did find
high correlations with management capability ratings of “Resilience,” “Internal Locus of Control,” and “Optimism.” Neurotic individuals are also less satisfied in their jobs and have a harder time making career decisions (Furnham, 1994;
Furnham & Zacherl, 1986; Lindley & Borgen, 2000). Men tend to score higher on Neuroticism (Hogan, Hogan, & Roberts, 1996). There is now sufficient
support to show that low scorers on Neuroticism scales have higher job performance and better interpersonal skills than people who score high on the same scale (Tett, Jackson & Rothstein, 1991; Furnham, 1994; Piedmont &
Training proficiency is positively predicted by Openness to Experience because these individuals possess traits such as intellectual curiosity and open-mindedness (Salgado, 1997). These traits are associated with positive attitudes
toward learning new tasks and being motivated to learn upon entry, which help these individuals to benefit more from training (Barrick & Mount, 1991; Barrick,
Mount, & Judge, 2001). Judge, Bono, Ilies, and Gerhardt (2002) found Openness to Experience to be predictive of leadership, with a regression coefficient of r = .21, which was the highest of the Big Five behind Extraversion and
Conscientiousness. Ployhart, Lin and Chan (2001) also found Openness to Experience to be predictive of transformational leadership performance.
Furnham, Crump, and Whelan (1997) found that Openness to Experience correlates positively with management capabilities “Conceptual Ability” and “Intuition,” and negatively with “Resilience.” Tett, Jackson, and Rothstein (1991)
found Openness to Experience to predict overall job performance when using confirmatory analyses and job analysis in predictor selection, but other studies have not supported this relationship (Piedmont & Weinstein, 1994). Openness to
Experience is, thus far, a consistent predictor of training proficiency but not overall job performance (Barrick & Mount, 1991; Barrick, Mount, & Judge,
2001).
Agreeableness has been found to significantly predict job performance in studies using confirmatory analyses and job analysis (Tett, Jackson & Rothstein,
1997; Barrick, Mount, & Judge, 2001). Piedmont and Weinstein (1994) found that low scores on straightforwardness, a facet of Agreeableness, are, however, related to the ability of achieving goals and adapting to changing work conditions.
In research based on management capability, Furnham, Crump, & Whelan (1997) found that Agreeableness negatively correlates with “Drive to Lead” and
positively correlates with “Interpersonal Sensitivity.” Agreeableness has also been found to relate with training proficiency, interpersonal facilitation, and leader effectiveness (Salgado, 1997; Hurtz & Donovan, 2000; Judge, Bono, Ilies,
Gerhardt, 2002). Along with Conscientiousness, Extraversion, and Neuroticism, Agreeableness was also found to predict teamwork in a study conducted by
Barrick, Mount and Judge (2001) who quantitatively summarized 15 meta-analytic studies on the relationship between the FFM and job performance.
Though Conscientiousness predicts overall job performance well by itself,
most performance criteria are best predicted by a combination of personality factors (Hogan, Hogan, & Roberts, 1996). Conscientiousness and Neuroticism together substantially predict supervisor ratings of job performance (Ones,
Viswesvaran, & Schmidt, 1993). Frei and McDaniel (1998) found mean validities of .50 for predicting performance in service jobs with customer service scales
containing facets of Agreeableness and Neuroticism. Furnham, Crump, and Whelan (1997) found that combinations of high Conscientiousness and
Extraversion, and low Agreeableness and Neuroticism predicted the management
“optimistic internal locus of control.” They also found that Openness to
Experience and Neuroticism predicted “cognitive flexibility”. Witt et. al. (2002) found that high scores on both Conscientiousness and Agreeableness predict
higher job performance ratings than those who scored high on Conscientiousness and low on Agreeableness. Such research gives support to the increased use of
combinations of personality factors as well as cognitive ability in predicting performance.
Due to research suggesting that personality factors as well as cognitive
ability predict performance both singly and in combination, my fourth hypothesis is: the performance ratings made by Subject Matter Experts (SMEs) in the
scholarship program will reveal two separate performance factors. One factor will be consistent with Intellectual Ability and the other will be consistent with student Character. More specifically, my fifth hypothesis is: (1) the Neuroticism,
Agreeableness and Extraversion personality factors will relate to the Character performance factor, and (2) the Openness to Experience and Conscientiousness personality factors will relate to both the Intellectual Ability and Character factors
Figure 2: Proposed relationships between personality and performance factors.
Also related to performance, many studies have shown the importance of
the relationship between personality and leadership. Studies of adult leadership have found that personality characteristics contribute to leadership ability (Karnes
& D’Ilio, 1990). Cattell and Eber (1966) found that leaders scored higher on scales of intelligence, enthusiasm, conscientiousness, sufficiency, and self-control. Piedmont and Weinstein (1994) found that during group situations,
individuals scoring high on Extraversion and low on straightforwardness (a facet of Agreeableness) are more often perceived as leaders. In research relating
personality to the Strong Interest Inventory, Lindley and Borgen (2000) found that Conscientiousness was related to preferences of leading others, directing, and persuading. Openness to Experience was correlated to learning environments,
leading others, and risk taking, while Neuroticism was not related to any scale. Keller (1999) found that all of the five personality factors influence
implicit leadership theories, or idealized leadership images. Agreeableness
positively predicted leader sensitivity but was negatively related to leader tyranny. Neuroticism
Extraversion
Agreeableness
Conscientiousness
Openness
Intellectual Ability
Conscientiousness related to leader dedication and predicted leader tyranny, and Extraversion positively predicted leader charisma. Openness to Experience, self-monitoring, and Neuroticism significantly related to leader sensitivity.
When researching transformational leadership, Judge and Bono (2000) found that Extraversion, Openness to Experience, and Agreeableness were
positively correlated with transformational leadership, while Neuroticism and Conscientiousness showed no significant relations. All together, the corrected multiple correlation between the five domains and transformational leadership
was .40. Transformational leadership also shows significant correlations with leader effectiveness (Fuller, Patterson, Hester, & Stringer, 1997). Those leaders
judged to be most effective by superiors are rated highly as exhibiting transformational behaviors by their subordinates (Judge & Bono, 2000).
Transformational, or charismatic, leaders inspire followers to reach beyond their
own interests (Burns, 1978), and articulation and emotional expressiveness are important characteristics when achieving these goals (Friedman, Prince, Riggio, & DiMatteo, 1980).
In their study with 95 student leaders, Karnes and D’Ilio (1990) used the High School Personality Questionnaire (HSPQ) and the Leadership Skills
Inventory (LSI) to explore the relationship between personality characteristics and leadership skills. Among many significant correlations, positive correlations were found between Warmth and Written Communication Skills, Speech
subscales. Boldness and Control positively correlated with all LSI subscales, while Anxiety negatively correlated with all LSI subscales. Girls scored significantly higher on the Emotional Stability scale. These researchers stated
that study participants could best be described as emotionally mature, stable, conscientious, moralistic, determined, adventuresome, friendly, and not
apprehensive, self-blaming, insecure, or anxious. These results are consistent with results found by Chauvin and Karnes (1983) who found that 181 gifted secondary students scored higher on the intelligence, enthusiasm, and
self-sufficiency subscales of the High School Personality Questionnaire when compared to adult leader profiles.
This brief discussion of leadership has been included due to the scholarship program’s interest in selecting and developing future leaders. Therefore, student leadership ability and interest are important parts of the
performance rating and will most likely fall under the Character factor of performance.
Many of the aforementioned studies on personality and leadership have
been based upon the use of self-report measures. Inherent in the use of self-report measures is the argument that face validity and faking can be problematic. While
face validity increases applicant’s acceptance of the tests, it also increases opportunities for social desirability faking. However, when faking is controlled for through empirical keying, applicants tend to complain about the lack of face
curb effects of social desirability faking, lie scales have been implemented in many personality measures. In all, deliberate faking in applicant pools tends to be low, and faking has been shown to not have a significant effect on validation
studies using job applicants (Hogan, Hogan, & Roberts, 1996; Hough, Eaton, Dunnette, Kamp, & McCloy, 1990; Tett, Jackson & Rothstein, 1991). In
addition, personality assessment using text analysis may be subject to less faking than self-reports of personality due to decreasing the social desirability found with self-reports.
When choosing the best candidates for a scholarship program based on commitment to leadership, scholarship, service, and character, it is important to
find those students who will benefit most from the program’s training and development services. Personality styles are apparent in writing samples, and because research has suggested that personality styles are associated with
performance in school and in leadership roles, examining student essays should give insight to their performance potential. This leads to my sixth, and final, hypothesis: the Positive and Negative language factors will relate to the Character
Figure 3: Proposed relationships between language and performance dimensions.
As discussed in the previous sections, research has looked at the
relationships between language and personality and between personality and performance. However, no research has yet to attempt looking at a direct
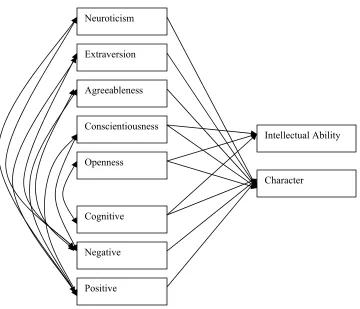
relationship between language and performance. This study proposes that these direct relationships exist (see Figure 3). Figure 4 below is a combination of Figures 1 through 3 and suggests that measures of personality can be replaced by
measures of three language dimensions in order to predict performance. Negative
Positive
Cognitive
Intellectual Ability
Figure 4: Proposed full model of the relationships between language, personality, and performance.
Neuroticism
Extraversion
Agreeableness
Conscientiousness
Openness
Negative
Positive Cognitive
Intellectual Ability
Method
Participants
Participants were randomly selected from applicants who were and were not selected to be part of a scholarship program at a large southeastern university.
Participants were drawn from two consecutive application periods. See Table 1 for demographic statistics for all applicant samples. In the scholarship application
packet, students were instructed to submit both a personal and service statement. A total of 277 personal and service statements were collected from 139 applicants during the first application period. This applicant group will be called
Sample 1. One of the applicants did not write a service statement, so the number of essays collected from the selected applicants totaled 137. Both types of
statements were obtained from each of the 70 applicants that were not selected into the program, so the number of essays collected from this group totaled 140.
The total number of selected applicants from Sample 1 was 69, which
included all current students, 4 individuals who declined admittance into the program, and one who deferred admittance to the following year. The remaining
70 applicants were chosen at random from those applicants not selected to
Table 1. Applicant Demographic Information
Male Female Caucasian Native Am African Am Asian Hispanic GPA SATV SATM
Sample 1 66 73 109 1 19 5 5
Selected 30 39 52 1 10 4 2 4.48 696 710
Not Sel. 36 34 57 0 9 1 3 4.19 602 635
Sample 2 59 55 99 3 7 3 1
Selected 24 33 47 2 5 2 1 4.52 691 714
Not Sel. 35 22 52 1 2 1 0 3.64 588 630
Pooled
Selected 54 72 99 3 15 6 3 4.50 694 712
A similar number of personal and service statements were collected from the following application period using the same methods as the previous year.
This sample included 57 students who were selected to the scholarship program and 57 who were not selected, for a total number of 114 applicants selected to
participate in this research. This group of applicants will be called Sample 2. Both personal and service statements were obtained from each of the 57 applicants that were selected to the program and each of the 57 applicants that
were not selected into the program. The number of essays collected from this group total 228.
The total number of selected applicants from Sample 2 was 57, which included all current students and 12 individuals who declined admittance into the program. The remaining 57 applicants were chosen at random from those
applicants not selected to proceed further in the application process. Typed personal and service statements were collected from the application files of all applicants.
The personal and service statements written by applicants in Sample 1 and Sample 2 were pooled into one large sample. This sample includes 126 applicants
selected to the scholarship program and 127 applicants not selected to the scholarship program. Both types of statements were obtained from each of the 126 applicants selected to the program, except for one student in Sample 1 who
statements were obtained from each of the 127 applicants not selected to the program for a total number of 254 personal and service statements collected. These statements were analyzed using the LIWC in order to determine language
differences between the selected and non-selected applicants.
All selected applicants from Samples 1 and 2 were given the Revised NEO
Personality Inventory (NEO PI-R; Costa & McCrae, 1992) to measure their personality based on the FFM. Supervisor ratings were collected for these students as a measure of their performance including managing academic
potential, critical thinking skills, leadership skills, seeking or accepting leadership roles, quality of service behavior, self-awareness, integrity, adaptability, and
presence, plus one rating on the student’s overall effectiveness taking into account the previous 9 criteria.
Materials
Applicant Essays. As a part of the application process, applicants were requested to submit two essays: a personal statement and a service statement. For the personal statements, applicants were asked to describe a person or event that
had a significant impact on their ideas, values, goals and educational or professional aspirations. They were also asked to explain how this experience
influenced their thinking, and to emphasize any special insights gained about themselves. Instructions for the service statements requested applicants to describe a social problem of interest, to describe a public service activity or
important. Instructions for both statements requested that essays be written in fewer than 500 words.
Linguistic Inquiry and Word Count. Pennebaker and Francis’s (1999) Linguistic Inquiry and Word Count was developed to provide an efficient method for studying various cognitive, structural, and emotional components in text
samples. The LIWC is a text analysis computer program that counts and classifies the percentage of words used by an individual into 72 categories. These
categories are listed in Appendix A. These 72 categories are collected into 17
standard linguistic dimensions (e.g., word count, percentage of articles used), 25 psychological process categories (e.g., affect, cognition), 10 relativity dimensions
(e.g., time, space), and 19 personal concern categories (e.g., work, home). The LIWC captures approximately 80% of words used in writing. All of the LIWC’s word categories were developed and evaluated by expert judges to establish their
reliability and validity. The levels of agreement between judges for placing words into certain categories ranged from 93% for the insight category to 100% for the eating, metaphysical, friends, human and relatives categories. Pearson
correlation coefficients between LIWC output and expert judge’s ratings of 72 student essays ranged from r =.22 for the optimism category to r =.41 for the
anger category (Pennebaker & Francis, 1999). Reliability estimates between LIWC categories range from r =.18 for insight to r =.40 for first person singular. Though the reliability estimates are fairly low, the LIWC has been successfully
Pennebaker, 2002; Pennebaker & Lee, 2002), including the prediction of self-reports and behaviors related to physical health, psychological health, and suicidal tendencies. The LIWC has also been a successful indicator of grade point
average, adaptive bereavement, and psychological state (Stirman & Pennebaker, 2001; Pennebaker & Mayne, 1997).
In this study, only ten subcategories comprising the affect and cognitive constructs will be considered due to their ability in previous analyses to
discriminate between selected and non-selected applicants. These subcategories
are: positive emotion, positive feeling, optimism, anxious, anger, negative emotion, sad, cause, insight and cognitive mechanisms.
NEO PI-R. Costa and McCrae’s (1992) NEO PI-R is a comprehensive measure of the 5 domains and 30 facets that define each dimension of normal personality. The 30 facet scales were constructed to identify important
distinctions within each of the 5 domains of the FFM, and give a more detailed analysis of an individual’s personality. This revised version replaces the previous 1985 and 1989 versions by the same authors and includes facet scales for
Agreeableness and Conscientiousness and minor changes in some of the Neuroticism, Extraversion, and Openness items. This revised version is just as
valid as its predecessor is, with correlations between the two ranging from .93 to .95. The NEO PI-R consists of two forms: Form S for self-ratings and Form R for observer ratings. Form S is self-administered, is appropriate for both sexes, and
Form S consists of 240 items with a 5-point response scale, and 3 additional items at the bottom of the answer sheet that serve as validity checks. Internal consistency coefficient alphas for this form range from r = .86 for
Agreeableness to r =.92 for Neuroticism. Retest reliabilities for Neuroticism, Extraversion, and Openness are r =.87, r =.91, and r =.86 respectively. Long-term
retest coefficients range from r =.63 to r =.83 for all five factors, demonstrating its stability in measuring enduring dispositions. Using principal components analysis with varimax rotation, correlations between the factor scores and the five domain
scales ranged from r =.89 for Extraversion and Conscientiousness to r =.95 for Openness and Agreeableness, representing a factor structure consistent with the
FFM. Median convergent validity coefficients range from r =.30 for Neuroticism to r =.40 for Extraversion for self-report and peer ratings. The NEO PI-R exhibits construct validity with its use in studies on psychological well-being, coping,
needs, and job performance, demonstrating its application in many different types of research (McCrae & Costa, 1986; Costa & McCrae, 1988; Piedmont &
Weinstein, 1994).
Performance Ratings. A group of 11 people in the scholarship program who had continuous contact with the selected applicants were selected as subject
matter experts (SMEs). These SMEs met to discuss the appropriate criteria desired by the scholarship program. Four behavior dimensions were selected as adequate. These dimensions were Scholarship, Leadership, Service, and
a performance rating scale. These performance criteria included managing academic potential, critical thinking skills, leadership skills, seeking or accepting leadership roles, quality of service behavior, self-awareness, integrity,
adaptability, and presence, plus one rating on the student’s overall effectiveness taking into account the previous 9 criteria. Effective management of academic
potential and critical thinking skills measured the Scholarship behavior dimension. Leadership skills and leadership roles measured the Leadership behavior dimension. Quality of student’s service commitment measured the
Service behavior dimension. Self-awareness, integrity, adaptability, and presence measured the Character behavior dimension. See Appendix B for the
performance rating booklet and further descriptions and examples of each scale. Ratings of the 10 scales were made on a 7-point scale ranging from not at all effective (1) to very effective (7).
Procedure
The primary purpose of this study is to compare essays of selected applicants with those who were not selected, and to determine whether writing
ability is predictive of program performance. All essays were scanned as text files into Microsoft Word. The spelling and grammar check, set on the formal
writing setting, corrected any misspellings created during the scanning process. Each file was then saved separately and analyzed using the LIWC program. Output from this program was saved as an Excel file to be used in subsequent data
samples (Pennebaker & Francis, 1999), word counts for the personal and service statements were summed to create a total word count for each LIWC category.
The 64 Sample 1 students were administered the NEO PI-R (Costa &
McCrae, 1992) Form S in one large group. The 45 Sample 2 students were administered the NEO PI-R the following year in one large group. Supervisors in
Results
The LIWC reports percentages of words used in writing samples, which may violate sample normality assumptions. Due to this fact, an arcsine
transformation, one of the most popular transformations used with proportions (Cohen & Cohen, 1983), was performed on the language data before any analyses
were conducted. However, means and standard deviations reported in this document are given in percentages for ease of understanding.
The 7 affect (positive emotion, positive feeling, optimism, negative
emotion, anxiety, anger and sadness) and 3 cognitive (cognitive mechanisms, insight and causal) LIWC subcategories were subjected to an exploratory factor
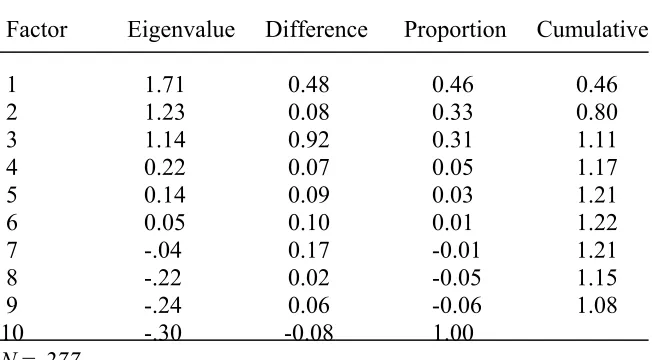
analysis. The principal factor method of factor analysis using priors equal to the squared multiple correlations was used to extract the factors, which was followed by a varimax (orthogonal) rotation. A scree test suggested three factors; so three
Table 2 Eigenvalues for Language Factors
Factor Eigenvalue Difference Proportion Cumulative
1 1.71 0.48 0.46 0.46 2 1.23 0.08 0.33 0.80 3 1.14 0.92 0.31 1.11 4 0.22 0.07 0.05 1.17 5 0.14 0.09 0.03 1.21 6 0.05 0.10 0.01 1.22 7 -.04 0.17 -0.01 1.21 8 -.22 0.02 -0.05 1.15 9 -.24 0.06 -0.06 1.08
10 -.30 -0.08 1.00
N = 277
Table 3. Rotated Factor Pattern of Language Factors
1 = Negative 2 = Cognitive 3 = Positive
Negative Emotion .843 -.013 .051
Sad .561 .062 .080
Anger .577 .098 -.054
Anxiety .471 -.068 .031
Cognitive Mechanisms .073 .757 .065
Insight .105 .698 -.070
Cause -.071 .448 .009
Positive Emotion -.042 .055 .778
Optimism .168 .047 .514
Positive Feeling -.030 -.074 .525
Table 4. Language Subcategory Correlation Matrix
1 2 3 4 5 6 7 8 9
1. Pos. Emot.
2. Pos. Feel. 0.48**
3. Optimism 0.43** 0.11
4. Neg. Emot. -0.03 0.01 0.16*
5. Anxiety -0.05 0.03 0.14* 0.41**
6. Anger -0.04 -0.02 0.09 0.46** 0.19**
7. Sad 0.04 0.07 0.12 0.47** 0.19** 0.20**
8. Cog. Mech 0.10 -0.04 0.13* 0.06 0.02 0.10 0.12
9. Cause 0.04 -0.05 0.02 -0.04 -0.11 0.04 -0.04 0.35**
10. Insight -0.02 -0.09 -0.01 0.04 0.06 0.16* 0.09 0.61** 0.25**
When interpreting the rotated factor pattern, a subcategory was said to
load on a given factor if the factor loading was .40 or greater for that factor, and less than .40 for the other two factors. Using these criteria, four subcategories, negative emotion words, sad words, anger words, and anxiety words, were found
to load on the first factor. This factor was labeled the negative factor. Three subcategories, cognitive mechanism words, insight words, and causal words, were
found to load on the second factor. This factor was labeled the cognitive factor. The final three categories, positive emotion words, optimism words, and positive feeling words, loaded on the third factor. This factor was labeled the positive
factor.
This three-factor model, using data from the pooled sample, is consistent
with preliminary analyses conducted using only the data from Sample 1. A general linear model multivariate analysis of variance (MANOVA) with the three language factors as dependent variables, determined that the two samples did not
significantly differ in regards to scores on the factors, justifying their being pooled into one large sample.
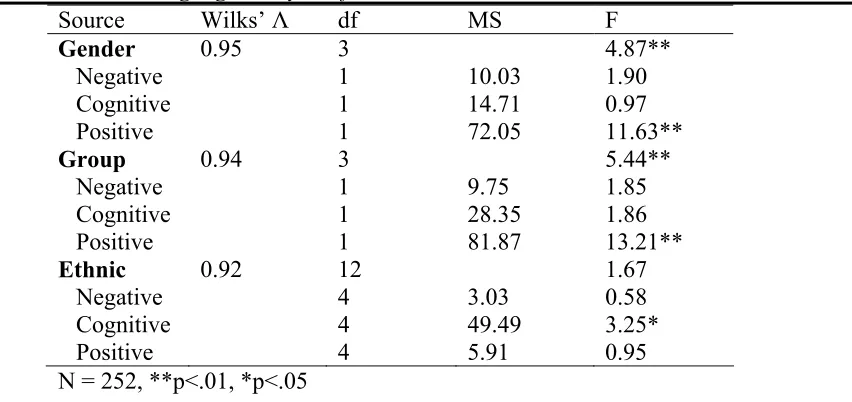
MANOVAs for group, gender, and ethnicity were then computed. Results of the omnibus tests indicated significant differences between selected and non-selected students, F(3,248) = 5.44, p < .001, and between males and females, F(3,
Table 5. Language Analysis of Variance
Source Wilks’ Λ df MS F
Gender 0.95 3 4.87**
Negative 1 10.03 1.90
Cognitive 1 14.71 0.97
Positive 1 72.05 11.63**
Group 0.94 3 5.44**
Negative 1 9.75 1.85
Cognitive 1 28.35 1.86
Positive 1 81.87 13.21**
Ethnic 0.92 12 1.67
Negative 4 3.03 0.58
Cognitive 4 49.49 3.25*
Positive 4 5.91 0.95
N = 252, **p<.01, *p<.05
Univariate tests assessed the differences found between selection groups and gender. A significant difference was found between males and females on the positive factor F(1, 251) = 11.63, p < .0008, with females using significantly more
positive words (M = 7.77%) than males (M = 6.61%). No other gender differences were found. Significant differences were found between selection
groups on the positive factor, F(1, 251) = 13.21, p < .0003, with the selected student group using significantly more positive words (M = 7.83%) than the non-selected group (M = 6.70%). No significant difference was found between
selection groups on the negative or cognitive factors. Despite a non-significant omnibus test, a significant difference was found between ethnic groups on the
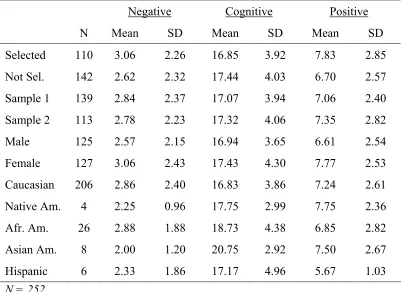
Table 6. Means and Standard Deviations for Language Factors
Negative Cognitive Positive
N Mean SD Mean SD Mean SD Selected 110 3.06 2.26 16.85 3.92 7.83 2.85
Not Sel. 142 2.62 2.32 17.44 4.03 6.70 2.57
Sample 1 139 2.84 2.37 17.07 3.94 7.06 2.40
Sample 2 113 2.78 2.23 17.32 4.06 7.35 2.82
Male 125 2.57 2.15 16.94 3.65 6.61 2.54
Female 127 3.06 2.43 17.43 4.30 7.77 2.53 Caucasian 206 2.86 2.40 16.83 3.86 7.24 2.61
Native Am. 4 2.25 0.96 17.75 2.99 7.75 2.36
Afr. Am. 26 2.88 1.88 18.73 4.38 6.85 2.82
Asian Am. 8 2.00 1.20 20.75 2.92 7.50 2.67
Hispanic 6 2.33 1.86 17.17 4.96 5.67 1.03
N = 252
The positive factor was the only language factor to differentiate between both the selected and non-selected groups. An analysis of covariance (ANCOVA)
was performed on the positive factor to ensure that high school GPA and total SAT score did not influence its relationship with the sample groups. After
adjustment by covariates, GPA and SAT scores, the positive language factor varied significantly with the selected group, F(3, 251) = 4.66, p<.01. Neither of the two covariates were significantly associated with the positive language factor,
and thus, did not influence the relationship between the positive factor and selected or non-selected student groups.
Table 7. Personality and Language Factor Correlations
Mean SD 1 2 3 4 5 6 7
1. Neuroticism 86.84 21.26
2. Extraversion 123.36 25.25 -0.12
3. Openness 126.63 22.46 0.03 0.25***
4. Agreeableness 124.24 16.48 -0.04 0.13 0.25***
5. Conscientiousness 120.21 23.44 -0.45*** 0.14 -0.25*** -0.06
6. Negative 3.06 2.26 0.05 0.05 0.02 -0.07 -0.07
7. Cognitive 16.85 3.92 -0.17* 0.06 0.10 -0.09 0.02 0.07
8. Positive 7.83 2.50 0.03 0.07 0.06 0.18* -0.12 0.09 0.00
Results indicate that the only correlations that approach significance
between the language and personality factors are a negative relationship between the use of cognitive words and Neuroticism (r = -.17) and between the use of positive words and Agreeableness (r = .18). The negative relationship between
cognitive words and Neuroticism was not found in the Pennebaker and King (1999) study. The positive relationship between positive words and
Agreeableness was stronger in this study than in the Pennebaker and King (1999) study. The negative relationship between the positive factor with
Conscientiousness was the next largest correlation in magnitude (r = -.12), but
was in the opposing direction as hypothesized and supported by the Pennebaker and King study (1999). The highly significant negative relationship between
Conscientiousness and Neuroticism and the positive relationship between Extraversion and Openness, first noted by Costa, McCrae and Dye (1991), was evident in this study.
A principal components analysis (PCA) was conducted on the
performance rating scale for Sample 1. The principal component method was
used to extract the factors, which was followed by a promax (oblique) rotation due to moderate to high correlations between performance factors. This PCA resulted in possible 2-factor or 4-factor solutions based upon eigenvalues, a scree
test, and theoretical conceptions of the factors. Eigenvalues are presented in Table 8. The two-factor and four-factor solution rotated factor patterns can be
if the factor loading was .40 or greater for that factor, and less than .40 for the other factors.
Table 8. Eigenvalues for Performance Factors
Factor Eigenvalue Difference Proportion Cumulative
1 6.02 4.90 0.60 0.60 2 1.12 0.42 0.11 0.72 3 0.70 0.13 0.07 0.79 4 0.56 0.17 0.05 0.84 5 0.39 0.05 0.04 0.88 6 0.33 0.02 0.03 0.91 7 0.30 0.03 0.03 0.95 8 0.27 0.10 0.03 0.97 9 0.16 0.06 0.02 0.99 10 0.10 0.00 0.01 1.00
Table 9. Rotated Factor Pattern of Two-Factor Performance Model
Factor 1 Factor 2
Managing academic potential (Sch) -.11 .95
Critical thinking skills (Sch) .04 .87
Leadership skills (Lead) .99 -.25
Seeking leadership roles (Lead) .83 -.04
Quality of service behavior (Serv) .43 .28
Self-awareness (Char) .72 .24
Integrity (Char) .71 .19
Adaptability (Char) .50 .45
Presence(Char) .82 .05
Overall effectiveness .76 .27
N = 64, total variance accounted for = 71.5%
Table 10. Rotated Factor Pattern of Four-Factor Performance Model
Factor 1 Factor 2 Factor 3 Factor 4
Managing academic potential (Sch) -.06 .00 .93 .07
Critical thinking skills (Sch) .19 .03 .85 -.12
Leadership skills (Lead) .31 .78 -.15 -.09
Seeking leadership roles (Lead) .13 .93 .16 .07
Quality of service behavior (Serv) .03 .02 -.03 .98
Self-awareness (Char) .86 .10 .06 -.09
Integrity (Char) .91 .02 -.02 -.04
Adaptability (Char) .77 -.14 .17 .15
Presence (Char) .58 .35 -.05 .07
Overall effectiveness .56 .28 .12 .17
N = 64, total variance accounted for = 84.2%