The Detection and Quantification of
Symmetry in 2D shape
A Thesis Submitted to the University o f London
for the Degree o f PhD
David S.Walsh
Department of Medical Physics and Bioengineering University College London
ProQuest Number: 10016136
All rights reserved
INFORMATION TO ALL USERS
The quality of this reproduction is dependent upon the quality of the copy submitted.
In the unlikely event that the author did not send a complete manuscript and there are missing pages, these will be noted. Also, if material had to be removed,
a note will indicate the deletion.
uest.
ProQuest 10016136
Published by ProQuest LLC(2016). Copyright of the Dissertation is held by the Author.
All rights reserved.
This work is protected against unauthorized copying under Title 17, United States Code. Microform Edition © ProQuest LLC.
ProQuest LLC
789 East Eisenhower Parkway P.O. Box 1346
Errata April 1998
Chapter 5
Chapter 6
Chapter 7
‘principle” should be “principal”.
‘Dimentionalaity” should be “Dimensionality”, ‘dimentionalaity” should be “dimensionality”. ‘s i” and “s2” should be “S I” and “S2”. ‘s i” and “s2” should be “81” and “82”.
‘maybe” should be “may be”. ‘potion” should be “portion”. ‘dependant” should be “dependent”. ‘(N)^” should be “(N^)”
‘...are laid down which and this allow...” should be ‘...are laid down and this will allow..”.
‘5.2d” should be “5.2e”. “cord” should be “chord”,
page 47 footnote 37;the first sentence should read “Which for present purposes will be considered an ellipse”.
Chapter 1 page 8, lin e l':
Chapter 3 page 20, line 13 page 21, line 8 page 23, line 14 page 23, line 15
Chapter 4 page 29, line 15 page 33, line 29 page 35, line 13 page 37, line 13 page 40, line 22
page 43, line 17: Page 45, line 10:
page 53, equation 6.5 should be = [X{t, <t), Y{t, c r ) |. page 53, line 8: “courser” should be “coarser”,
page 57, line 20: “effects” should be “affects”,
page 61, line 13: “complimentary” should be “complementary”,
page 62: The caption for figure 6.9 should read “...differs from the Oliensis smoothed equivalent (b).”
page 72, line 1 page 72, line 4 page 73, line 8
( E l i n e ) E e d g e ? and E ^ e rm ) should be ( E ü n e » E e d g e ? and E t e r m ) •
‘(E-Hne)” should be
‘boundaries it which it is placed” should read “...boundaries in which it is placed”,
page 75, line 14: “dependant” should be “dependent”.
Chapter 8
Chapter 9
Chapter 10
Chapter 11
Appendix I
page 81, line 11 : “..each sub-symmetry is an” should read “each sub symmetry is on an”,
page 87, line 20: “...described on as...” should read “...described as a...”
page 106, equation 9.7 “v ” should be bold.
page 107, equation 9.10 should be = («(5)|v^(5)|^ + /?(5)|v^(5)|^ j / 2
page 113, line 21 : “...process dependant on” should be “process dependent on’
page 129, line 15: “...these have been of no..” should be “...has been of no...”.
page 134, line 16: “...types of Isometries” should be “...types of isometry”. page 135, line 4: “of cp(F)” should be “cp(F) of F”.
Abstract
The ability to identify and quantify asymmetrical shape change is potentially
valuable in the study of biological shape. This thesis describes a new approach to
the analysis of symmetry in two dimensional shapes.
Two methods of quantifying asymmetry and a means of identifying the
boundary distortions that cause them are posited. Underlying these techniques is
the assertion that symmetry is a continuous, measurable property of shape,
encapsulated in a detectable curve equivalent to the bilateral axis. Theories from
psychology and computer vision are used to justify these claims and a unique
combination o f image analysis techniques is used in the practical execution of
these ideas.
Central to the implementation o f this new approach to symmetry analysis
is the ability to isolate and extract the bilateral axis. A novel approach to axis
identification is developed that involves the interrogation o f the local symmetries
in each boundary in a multi-scale description of a shape using active contours. A
set of nine test shapes that exhibit a wide variety of asymmetry is used to
Acknowledgements
I would like to thank both my supervisors for their continued support and guidance. I am
particularly grateful to Dr Alf Linney, my academic supervisor, for giving me the freedom to
explore, and I indebted to Professor Richard Brook, my industrial supervisor, for keeping me on
the straight and narrow.
This work has gone through many stages of development and improvement that would
not have been possible without help and support from Tony Allnutt, Alan Brett, Mark Davey,
Alexander Birkett, Mandy Fader, Mick Farquharson, Gary Gladwin, John Gardener, Tricia
Goodwin, Robin Hennessy, Tryphon Lambrou, Daren McDonald, Nigel Pugh, Robin Richards,
and Julia Schnabel. Many thanks to you all.
I would also like to thank all my friends and family who have encouraged and cajoled
during the last four years. They are too numerous to mention individually, but they know who
they are.
This research was undertaken within the Postgraduate Training Partnership established
between Sira Ltd and University College London. Postgraduate Training Partnerships are jointly
sponsored by the Department of Trade and Industry and the Engineering and Physical Sciences
ô^m m eiry is a properi^ cfeacf i^in^s. Q)icf ^ou ever
see a iree or a mouniain i/ia i was spm m eirical? ^Ps pn e^ or
Suilcfinps^ Sui i^you eoer see a symmeirical^uman^ace^ you
w ill £aoe i£ e im pression i/ia i yo u ou y£i io i£ in £ i i is
Seauiiful^ Pui i/ia i in fa c iyou j-in(f ii colcf... J3oo£ a iyo u rfa ce
in a mirror^ ancf you w ifi see i^ a i one eyeSrow is a iiiile
Jiiy£er iJian i/ie oi^ep i/ia i i^ e se i ofi^ e lic fo f y o u r le fi eye is
a fraciion more open i^an iJie oiJier. P7i is i/iese i/iin ys i/ia i
maÂe you PoiJi aiiraciiue ancf 6eauiiful^ ...oifierw ise you
would£e a siaiue. ôym m eiry is fo r ^od^ n oifor us.
C a p ta in C o r e lli
in C a p ta in C o relli^ s U Kancfolin
Contents
CHAPTER ONE - INTRODUCTION...1
1...Overview...1
1.1 Motivation... 2
1.2 Initial Considerations... 3
1.3 Symmetry Detection in 2D...4
1.4 Isolating The Bilateral Axis...5
1.5 Practical Considerations...6
1.6 Discussion Outline... 7
1.7 Summary...7
CHAPTER TWO - SYMMETRY AND PERCEPTION...9
2 Overview... 9
2.1 The Gestalt Theory of Perception... 10
2.1.1 Perceptual Organisation - Grouping... 10
2.1.2 Perceptual Organisation - Figurai Goodness...11
2.1.2.1 The Characterisation of Figurai Goodness... 12
2.1.2.2 Goodness and Symmetry... 13
2.1.3 Perceptual Organisation - Shape Equivalence...14
2.1.3 .1 The Reference Frame Hypothesis - An Example...15
2.1.3 .2 The Reference Frame Hypothesis and Symmetry...16
2.1.4 The Nature of Symmetry...16
2.2 Summary...17
CHAPTER THREE - SYMMETRY AND COMPUTER VISION...18
3 Overview...18
3.1 Perceptual Organisation and Machine Vision...19
3.2 Perceptual Organisation - A Classification System... 19
3.3 Perceptual Organisation Based Vision Systems... 21
3.3.1 CANC2 - Symmetry... 22
3.3.2 CANC2 - Symmetry Detection...23
3.3.3 CANC2 - The Use of Symmetry... 24
3.4 Symmetry and Closed Contours... 24
3.5 Towards Axial Shape Description...26
_____________________________________________________________
Contents
C H A P T E R F O U R - R IB B O N S AND A X IA L D E S C R IP T IO N S ...27
4 Overview...27
4.1 Ribbons...28
4.2 Axis Recovery... 29
4.2.1 Blum’s Axial Description - The Symmetry Axis Transform... 29
4.2.1.1 Problems...32
4.2.2 Brady’s Axial Description - Smooth Local Symmetries...34
4.3 Smooth Local Symmetry Generation - Algorithm One...36
4.3.1 Algorithm One - Weaknesses... 37
4.4 Smooth Local Symmetry Generation - Algorithm Two... 37
4.4.1 Algorithm Two - Weaknesses... 38
4.5 Smooth Local Symmetry - Axis Extraction...38
4.6 Symmetry Extraction - A New Approach... 39
4.7 Summary...40
C H A P T E R F IV E - AXIS L O C A T IO N ... 41
5 Overview...41
5.1 Simple Prototypification...42
5.2 Complex Prototypification...44
5.3 Reverse prototypification... 46
5.4 Summary...47
C H A P T E R SIX - M U L T I-SC A L E BO UN DA RY L O C A T IO N ...48
6 Overview...48
6.1 Process Grammar... 49
6.2 Scale... 49
6.2.1 Representation Selection... 51
6.2.2 Scale and Shape... 52
6.3 Boundary Smoothing... 53
6.3.1 Boundary Shrinkage...55
6.3.2 Alternative Filters...56
6.3.2.1 The Oliensis Filter... 56
6.3.2.2 Modifying Oliensis Filtering...59
6.3.3 Boundary Sequences...61
6.4 Summary...64
C H A P T E R SEV EN - SY M M E T R Y T R A C K IN G ... 65
7 Overview...65
7.1 Boundary Sequences and Symmetry... 66
7.1.1 Symmetry in the Prototype... 66
7.2 Selective Point Tracking... 68
7.3 Whole Axis Tracking...69
7.3.1 Active Contours - Introduction...69
7.3.2 Active Contours - The Kass Algorithm... 70
7.3.2.1 Internal Energy (Eintem)... 71
7.3.2.2 Image Energy (Eimage)... 72
13.23 External Energy (Egon)... 71
7.3.3 Controlling Parameters... 72
7.3.4 Active Contours and Symmetry Tracking...73
7.3.5 Active Contours - Initial Implementation... 73
7.3.6 Discrete Energy Field Generation... 75
_____________________________________________________________
Contents
CHAPTER EIGHT - SYMMETRY TRACKING ENERGY FIELDS... 77
8 Overview...77
8.1 Energy Field Optimisation...78
8.1.1 Continuous Angular Equality... 82
8.1.1.1 Calculating the Energy Field (Continuous)... 83
8 .1.1.2 Examples of the Energy Field... 84
8.1.2 Perpendicularlity...86
8.1.2.1 Calculating the Energy Field (Perpendicularity)... 87
8.1.2.2 Examples of the Energy Field... 88
8.1.3 Energy Field Combination... 91
8.1.3 .1 Calculating the Energy Field Combination...91
8 .1.3 .2 Examples of the Combined Energy Fields...91
8.2 Summary... 95
CHAPTER NINE IMPLEMENTATION... 96
9 Overview...96
9.1 Implementation - An Outline...97
9.2 Parameter Value Selection...98
9.2.1 Parameter Selection for Sequential Oliensis Filtering... 100
9.2.1.1 The Limits of the Filter Range (Ku.start, K,.start, Ku.end, Ki.end)...101
9.2.2 Parameter Selection for Sequential Gaussian smoothing...102
9.2.3 Active Contour and Boundary Anomalies...102
9.2.3.1 Snaxel Clustering and Active Contour Shrinkage... 102
9.2.3.2 Boundary Size Change...104
9.2.4 Modifications... 105
9.2.5 Active Contour Parameters... 105
9.2.5.1 Defining the Active Contour... 106
9.2.5 .2 Defining the Behaviour of the Active Contour... 106
9.3 Summary... 108
CHAPTER TEN SYMMETRY ANALYSIS... 109
10 Overview...109
10.1 Results... 110
10.1.1 The Classification of Asymmetry... 110
10.1.2 Axis Validity... 113
10.1.2.1 Axis Evaluation... 113
10.1.2.2 Axis Variabihty... 115
10.1.2.3 An Explanation of Axis Variability... 118
10.1.2.4 Axis Selection... 119
10.1.3 Axis quantification...120
10.1.3.1 Asymmetrical Shape Change and Curvature... 122
10.1.3.2 Symmetry Identification...123
10.1.3.3 Identifying Sources of Asymmetry...125
10.2 Summary...126
CHAPTER ELEVEN - FINAL CONSIDERATIONS... 127
11 Overview...127
11.1 Anomalies...128
11.1.1 Prototype Shape...128
11.1.2 Concavities... 129
11.1.3 Intuitive axes... 130
11.2 Future Work -Technique Development... 131
11.3 Future Work - Applications...132
Contents
APPENDIX I DEFINITIONS...134
1 Symmetry...134
1.1 Transformations and Isometries... 134
1.2 Symmetry and Reflection...135
1.2.1 An Example...135
1.3 Sub-Symmetry... 136
1.3.1 An Example...136
1.4 Local Symmetry... 136
APPENDIX n ALGORITHMS...138
1 Boundary Finding (8-connectivity)... 138
1.1 Boundary Resampling(8-connectivity)...139
APPENDIX m MATHEMATICAL BACKGROUND... 140
1 Curvature...140
APPENDIX IV RESULTS... 142
1 Boundary, Energy Field and Interrogation Sequences...142
List of Figures
CHAPTER ONE - INTRODUCTION
Figure 1.1 Facial asymmetries... 3
Figure 1.2 Local symmetries...5
Figure 1.3 Test shapes... 7
CHAPTER TWO - SYMMETRY AND PERCEPTION Figure 2.1 Wertheimer’s grouping principles... 11
Figure 2.2 Symmetry structure inside a rectangle... 14
Figure 2.3 Reference frame description of a set of circles... 15
CHAPTER THREE - SYMMETRY AND COMPUTER VISION Figure 3.1 Symmetry between two curves... 22
Figure 3.2 The symmetry axis between two curves...23
Figure 3.3 A Ribbon... 24
Figure 3.4 Determining the beginning and end of curve segments...25
CHAPTER FOUR - RIBBONS AND AXIAL DESCRIPTIONS Figure 4.1 Ribbon Generation... 28
Figure 4.2 The symmetric axis transform... 30
Figure 4.3 Two examples of the medial axis... 31
Figure 4.4 Axes of a rectangle... 32
Figure 4.5 Geometry of a SLS... 34
Figure 4.6 Examples of SLS... 35
Figure 4.7 Calculating SLS... 36
Figure 4.8 Knots...38
Figure 4.9 SLS and skeletons... 39
CHAPTER FIVE - AXIS LOCATION Figure 5.1 Global prototypification... 42
Figure 5.2 Eigenspace...43
Figure 5.3 Complex prototypification...45
Figure 5.4 Four stages of prototypification... 46
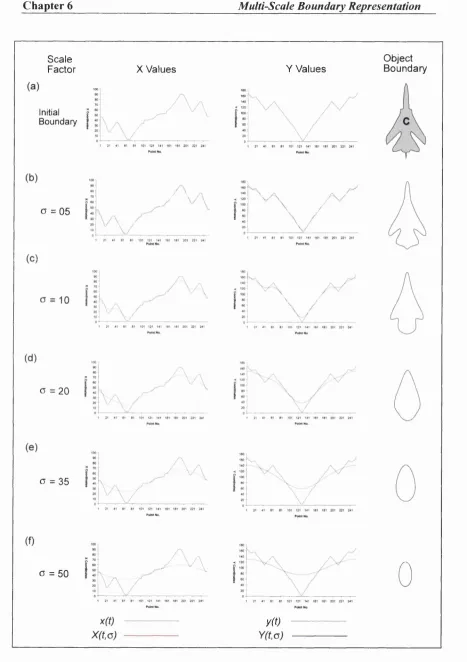
CHAPTER SIX - MULTI-SCALE BOUNDARY REPRESENTATIONS Figure 6.1 Gaussian Smoothing... 50
Figure 6.2 Scale-space image... 52
Figure 6.3 Gaussian Smoothing... 54
Figure 6.4 Gaussian shrinkage... 55
Figure 6.5 The Oliensis filter... 58
Figure 6.6 The Oliensis filter and shrinking... 58
Figure 6.7 Oliensis Smoothing... 60
Figure 6.8 Boundary shrinkage... 61
Figure 6.9 Prototypification sequences...62
List o f Figures
CHAPTER SEVEN - SYMMETRY TRACKING
Figure 7.1 Local symmetries in a boundary sequence...66
Figure 7.2 Curvature of an ellipse... 67
Figure 7.3 Scale-space image...68
Figure 7.4 Point tracking... 69
Figure 7.5 Active contour... 70
Figure 7.6 Successful symmetry tracking...74
Figure 7.7 A discrete external energy field... 74
Figure 7.8 A local symmetry... 75
CHAPTER EIGHT - ENERGY FIELDS Figure 8.1 Angular equality... 79
Figure 8.2 Bivalent energy fields...80
Figure 8.2 Bivalent energy fields...80
Figure 8.3 Angular equality in a circle... 81
Figure 8.4 Local symmetries... 83
Figure 8.5 A continuous energy field for a rectangle (angular equality)... 84
Figure 8.6 Continuous energy Fields (angular equality)... 85
Figure 8.7 The effect of energy plateauing... 85
Figure 8.8 Local symmetries...86
Figure 8.9 A continuous energy field for a rectangle (perpendicularity)... 88
Figure 8.10 Continuous energy fields (perpendicularity)...89
Figure 8.11 Energy field weaknesses... 90
Figure 8.12 A continuous energy field for a rectangle (angular equality and perpendicularity) .92 Figure 8.13 Continuous energy fields (angular equality and perpendicularity)... 93
Figure 8.14 Energy field improvements... 93
Figure 8.15 Combined energy field sequence...94
Figure 8.16 Active contour response... 94
CHAPTER NINE - IMPLEMENTATION Figure 9.1 Symmetry detection algorithm... 97
Figure 9.2 Test shapes... 100
Figure 9.3 Optimal adapted Oliensis filter... 102
Figure 9.4 An elliptical energy field - side o n ...103
Figure 9.5 Active contour anomalies...104
CHAPTER TEN - SYMMETRY ANALYSIS Figure 10 .1 The bilateral axes of the test shapes... 112
Figure 10.2 Symmetrical shape generation...114
Figure 10.3 Area matching... 115
Figure 10.4 Active contour flexibility...116
Figure 10.5 Changes in active contour flexibility... 117
Figure 10.6 Energy ridge angularity...119
Figure 10.7 Axial curvatures... 121
Figure 10.8 Test shape axial curvature...122
Figure 10.9 Symmetry distortions in single shapes... 124
Figure 10.10 Locating boundary distortions... 125
Figure 10.11 Regions of asymmetrical disturbance...126
CHAPTER ELEVEN - FINAL CONSIDERATIONS Figure 11.1 Circular prototypes...128
Figure 11.2 Boundary concavities...129
Figure 11.3 Eccentric axial terminations... 130
List o f Figures
APPENDIX I - DEFINITIONS
Figure A1.1 Global symmetries, sub-symmetries and local symmetries... 136
APPENDIX n - ALGORITHMS Figure A2.1 Direction labels... 138
Figure A2.2 Point equivalent of a pixel boundary... 139
APPENDIX m - MATHEMATICAL BACKGROUND Figure A3.1 Curvature... 140
APPENDIX IV - RESULTS Test Shapes... 142
Shape A ... 143
Shape B ... 144
Shape C ... 145
Shape D ... 146
Shape E ... 147
Shape F ... 148
Shape G ... 149
Shape H ... 150
List of Tables
CHAPTER THREE
3.1 Classificatory structure for perceptual organisation... 20 CHAPTER NINE
9.1 Optimal values of the variable parameters...99 CHAPTER TEN
Chapter One
Introduction
1. Overview
This thesis gives a detailed account of a new approach to the analysis of symmetry in two
dimensional shape. In the following chapter the problems associated with the identification and
quantification of symmetry are discussed and the solutions which are the basis of this new
analysis technique are outlined. It is also intended that this initial discussion will make clear
underlying motivations, objectives and assumptions.
Bilateral symmetry is a key notion in this work and will be assumed from the outset to
be a refiectional symmetry identifiable in instances where more than one mirror symmetry exists
by the fact that it is the refiectional symmetry about the longest axis. In instances where
identical axes of symmetry exist the bilateral axis is differentiated in terms of its proximity to the
Chapter 1__________________________________________________
Introduction
1.1 Motivation
The Human form is approximately bilaterally symmetric. Most body parts exist in pairs and
each instance of a particular structure corresponds to its partner with respect to size, shape and
position relative to a longitudinal axis of symmetry [Weyl 1952]. It is rare that this symmetry is
perfect; paired organs do not usually correspond exactly, and the symmetry of the internal
organs is broken by the position o f the heart and the appendix [Rosen 1975]. However, a close
approximation to bilateral symmetry is generally a sign o f good health and external symmetry is
considered to be aesthetically pleasing.
Abnormal asymmetrical distortions are often caused by ill health, growth abnormalities
or trauma. Following the prevention o f further asymmetrical change, surgical intervention is
often required to correct mechanical dysfunction caused by asymmetry and restore an aesthetic
appearance. Bilateral symmetry is a particularly important morphological characteristic o f the
face and head. Asymmetrical distortions of the craniofacial region are not only psychologically
damaging for the sufferer [Giddon 1995] they often require prompt intervention to prevent long
term difficulties with breathing, speaking and eating.
Asymmetrical distortion of the face is often a subtle non-local phenomenon which
provokes subjective, aesthetically biased qualitative assessment by all concerned. The critical
appraisal of the surgical restoration of symmetry in a particular case, or the auditing of the
surgical techniques used to achieve it, requires a standardised method o f assessing facial
asymmetry pre- and post-operatively that gives consistent quantitative evaluations. Techniques
which enable the assessment of facial asymmetry have been in existence for some time. These
include, Morphanalysis [Rabey 1977a; Rabey 1977b; Hodgkinson and Rabey 1986],
anthropometric measurement [Larson and Nilsson 1983], and stereophotogrammetry [Burke
1983]. Although these techniques provide reproducible descriptions of an object’s asymmetry,
the processes involved are dependent on the extraction o f three dimensional (3D) information
from an intermediary two dimensional (2D) projection o f a 3D object. This can be a complex,
time-consuming process prone to inaccuracies and dependent on extensive user interaction
[Coghlan, Matthews et al. 1987]. More recently, computer based symmetry analysis tools have
been developed, but they also require considerable user interaction and are limited to specific
asymmetry detection tasks. For example, Coghlan et al have developed a system specifically for the assessment of nasal symmetry following cleft lip repair [Coghlan, Matthews et al, 1987;
Coghlan, Laitung et al. 1993; Laitung, Coghlan et al. 1993].
The development o f fast, non-invasive laser scanning techniques [Arridge, Moss et al.
1985; Moss, Linney et al. 1987; Moss, Grindrod et al. 1988] which record the coordinates of up
to 20,000 points on the surface of a face mean that it is possible to obtain 3D geometric
Chapter 1
Introduction
This suggests that shape information, in particular the symmetrical nature o f faces, is now accessible in a direct way that has not been feasible before. The possibility o f developing a new approach to the extraction and quantification of human facial asymmetry and a demand for such a tool that does not require time consuming user participation have been the primary motivations for the work discussed in this thesis.
1.2 Initial Considerations
The bilateral symmetry apparent in most biological forms undergoes small continuous fluctuations throughout life. These changes are a consequence o f either genetic or environmental stresses which destabilise the developmental processes [Kokko, Floate et al. 1996]. The monitoring o f Fluctuating Asymmetry has become an important tool in the study of behavioural ecology and population biology'. It is evaluated in terms of an index which relates a given structure either side of an assumed axis of symmetry. For example, the asymmetry of a given trait (e.g. ear lobe length or limb bone length) can be expressed as the absolute value of the difference in the values of the trait measured either side of the axis.
Comparing and measuring distinct structures is an obvious simple method of isolating and quantifying asymmetries. However, the asymmetrical changes that occur in the craniofacial region often manifest themselves as ill defined soft tissue distortions not confined to distinct measurable structures. For example, a unilateral cleft lip gives rise to a general distortion o f the nasolabial region o f the face [Horswell and Pospisil 1995] and unilateral zygomatic fractures give rise to subtle distortions o f the cheek [Kawano 1987]. Figure 1.1a and b show the asymmetrical faces of tw o people with hemifacial microsomia; compared with the healthy face (c) it is clear that they are both asymmetrical but the asymmetry cannot be attributed to any particular facial structure.
F igure 1.1 F acial asymmetries. A com parison o f sym m etrical (c) an d asym m etrical (a)(b) f a c e s shows that asym m etries o f the human fa c e are not n ecessarily confined to any distinct
m easurable structures.
Chapter 1__________________________________________________
Introduction
The analysis of facial symmetry requires a technique that goes beyond the comparison
of differences in specific structures. An approach is required that takes into account the facial
surface as a 3D whole. An examination of the complexities of this view and uncertainties
associated with methodology prompted the consideration of a less complicated formulation o f
the problem in which the asymmetries of 2D boundaries are considered as opposed to 3D
surfaces^. Although considering symmetry analysis in 2D simplifies the problem mathematically
and makes the task of visualisation easier, the fundamental problem of identifying and
quantifying ill-defined asymmetries remains the same. It is assumed that the examination of
surface changes and boundary changes can be performed using the same techniques and with
some algorithmic adaptations, the transition from 2D to 3D will be a tractable process. Although
this transition is not considered in the current work, it has been an influencing factor in the
development of the symmetry analysis technique described in this thesis.
1.3 Symmetry Detection in 2D
The solution to the problem of 2D symmetry analysis described in this thesis is based on a
relaxation o f the traditional definition of symmetry. From a mathematical point o f view,
symmetry is an isometry that maps a set of points in a Euclidean plane (2D) onto itself such that
after the mapping nothing appears to have changed^. Symmetry is a property of the set o f points
as a whole and consequently a global property of the 2D shape of which they are a part. A shape
is reflectionally symmetric when one half is a mirror image of the other. This is only ever the
case when the axis about which the reflection occurs is straight. It follows that if a set o f points
cannot be mapped onto itself by reflection it is not symmetric. Thus a shape either is or is not
symmetrical and the bilateral axis caimot be anything other than a straight line. This definition
of symmetry does not allow the approximate symmetries that are so intuitively apparent in our
perception of objects and their 2D representations. If asymmetries are to be recognised,
symmetry has to be reconsidered as a continuous property such that approximate symmetry can
be attributed to a shape.
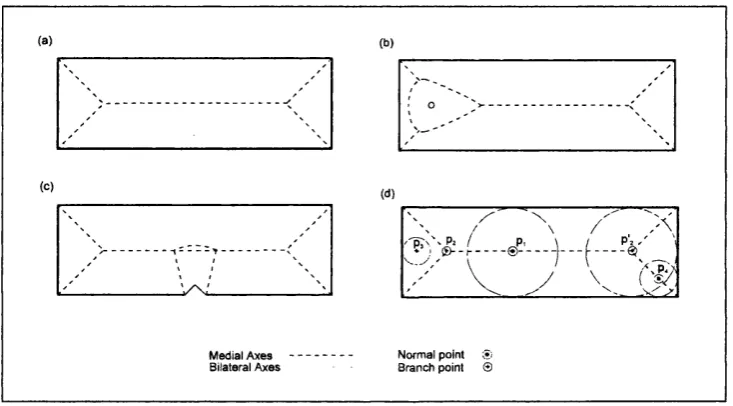
The global symmetries of any reflectionally symmetrical shape (figure 1.2a) can be
described as an accumulation of local reflections between pairs of boundary points (P/, Pj) about
points o f reflection (M/) that lie on one of the axes of refiectional symmetry {Sj). By considering refiectional symmetry in terms of local symmetries as well as a global property between “halves”
of a shape, degrees of symmetry can be legitimately identified. Although the global symmetry is
^ The 2D formulation of the problem should not be confused with the 2D intermediary previously mentioned. The former is intended to give a clear insight into the nature of the problem of symmetry analysis and the problems associated with 3D symmetry analysis rather than a solution in itself.
Chapter 1
Introduction
destroyed by asyiTunetiic boundary distortions, local symmetries persist, and an axis equivalent to the original straight bilateral axis - consisting o f the locus o f midpoints o f the local symmetries - can be derived (figure 1.2b). The change in the bilateral axis from straight to curved is proportional to the asymmetrical distortion o f the original boundary; the greater the asymmetry the greater the axial distortion. Complex asymmetrical shape changes are encapsulated in relatively simple measurable curvature changes in the axis o f reflection. It is the quantification o f the axial shape change that will be exploited as a means o f symmetry quantification in this work. The direct link between axial distortions and boundary point pairs will also be used as a means o f identifying the asymmetrical distortions on the boundaiy. Together, the processes o f quantifying the change in the bilateral axis and relating those changes to the boundary forni the basis o f the 2D symmetry analysis technique described in this thesis.
-F igure 1.2 L ocal sym m etries. G lo b a l sym m etries (Sj,S2) can be d e sc rib e d a s an accum ulation o f lo ca l sym m etries betw een p a ir s o f p o in ts (P„PJ abou t axia l p o in ts (Md (a). N o n -lin ea r axes o f sym m etry in asym m etrical sh apes can a lso be d e sc rib ed in term s o f loca l sym m etries (b).
1.4 Isolating The Bilateral Axis
The proposed method o f symmetry analysis is dependent on isolating the bilateral axis in any given shape. The bilateral axis in a reflectionally symmetric shape is a continuous straight line that does not fork and intersects the boundary in two and only two places. It is assumed that the equivalent axis in an asymmetiical shape will have the same properties except that it will not be straight. Given that the asymmetries being sought aie ill-defined smooth (C2 continuous) boundary distortions the desired axis will also be assumed to be smooth.
Chapter 1__________________________________________________
Introduction
symmetries that give rise to the bilateral axis is that, in the absence of a single distinguishing
property, it is very easy to undermine the detection process by utilising implicitly assumed
knowledge o f the axis being sought. A new approach to bilateral axis extraction described in
this thesis avoids such difficulties by moving away from the idea of selecting the relevant set of
boundary points and attempts to find the bilateral axis by multi-scale generation and
interrogation of all possible midpoints. This approach entails finding the bilateral axis directly
rather than finding the boundary points that give rise to it.
1.5 Practical Considerations
The use of information other than that contained in an object’s image could make the task of
bilateral axis detection easier. For example, the analysis of facial symmetry can be simphfied if
the knowledge that faces are generally ellipsoid with a vertically orientated bilateral axis is used
to limit the axis identification process. However, the use of specific shape and orientation
information has been avoided in the work described below. This has enabled a generality to be
maintained, making the new technique potentially applicable to other 2D axis identification tasks
in which orientation and general shape information is not known. Areas o f potential use include
the analysis o f fluctuating asymmetry, the modelling of perceptual organisation and the
representation of shape.
A general axis evaluation technique has the disadvantage of being difficult to assess; it is
not possible to test the proposed method on all possible shapes in all orientations. For the
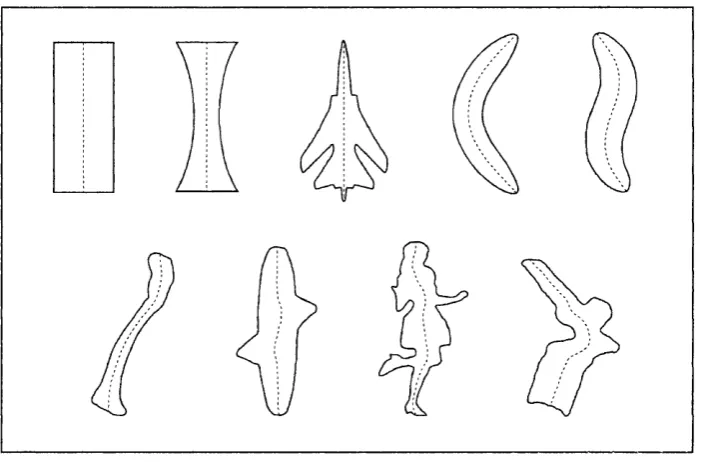
purposes o f this investigation nine test shapes have been selected which encompass the common
axial variations (figure 1.3). The desired axis in each of these shapes corresponds with the
intuitive conception of the bilateral axes as sketched in figure 1.3. A crude evaluation of the
success o f the proposed method of axis extraction can be made in terms of the extent of the
correspondence between the intuitive and extracted axes. A more rigorous method of evaluation
will be discussed in the latter part of this work.
It is intended that this approach to symmetry analysis should become part of a general
purpose symmetry analysis tool. For this reason, effort has be made to minimise user
intervention and to automate the process as much as possible. Problems that are peculiar to 2D
image manipulation and not relevant to future 3D applications have been side-stepped. In
particular the problem o f segmentation has been avoided by the use of simple binary
representations of the test shapes. Similarly, the complications that emerge when a mirror
symmetric planar shape is viewed obliquely (skew symmetry [Gool, Moons et al. 1995]) have
Chapter 1
Introduction
F ig u re 1.3 T est sh a p es These sh a p es ca p tu re a w ide ran ge o f a x ia l va ria tio n s s u ita b le f o r test p u rp o se s. The in tu itive b ila te r a l axes a re sh ow n a s d o tte d lin es
1.6 Discussion Outline
Symmetry and its detection have roles in areas as diverse as psychology, computer vision,
medicine, and entomology. No single review can cover the wealth and diversity of associated
literature which spans more than one hundred years. As a consequence, this work is not based
on an all encompassing overview of existing work. Instead, starting from fundamental
principles, a thread o f argument which gives rise to the new approach to symmetry analysis is
followed through existing ideas and is supported and justified by discussions of relevant past
work where necessary.
In chapters 2, 3 and 4, the ideas outlined above are developed and the new approach to
bilateral axial extraction is suggested. The tools and techniques employed in the realisation of
this idea are discussed in chapters 5,6,7 and 8. The remainder o f this work looks at the practical
implementation of the proposed technique, the strengths and weaknesses of the results, and
future applications.
1.7 Summary
The work described below is based on the hypothesis that symmetry is a quantifiable property of
shape and that indices of symmetry can be developed for use in description and quantification of
asymmetry in biological shapes. This thesis gives a detailed account of the foundational 2D
Chapter 1___________________________________________________
Introduction
The principle objective of this work is to find and quantify the asymmetries caused by boundary
distortions in 2D planar shapes.
The new approach to symmetry analysis posited in this work is based on the assumption
that the identification and quantification of asymmetry is possible in terms o f the relationship
between a shape’s bilateral axis and its boundary. A new approach to bilateral axis extraction is
posited based on the assumption that symmetry can be considered to be a continuous property o f
Chapter Two
Symmetry and Perception
2. Overview
The ability to detect and utilise symmetry is a fundamental process in visual perception. In this
chapter a review of relevant past work will be given which justifies this assertion and highlights
the theoretical foundations upon which the uses of symmetry in computer vision are based.
Current attempts to explain perception draw on four contrasting theoretical traditions:
information processing, inference theory. Gestalt theory and stimulus theory [Rock 1995].
Although individually consistent, these schools of thought have tended to generate incompatible
theories that have led to contradictory explanations of cognition. The unification of these
theories, giving a single coherent explanation of any of the processes involved in perception, has
rarely been achieved. Consequently, the elucidation of the underlying mechanisms of perception
has been the result of a combination o f relevant aspects of these theories into coherent, but
unintegrated, sets of beliefs [Rock 1995].
However, there is one particular aspect of perceptual psychology where this is not the
case. There is a general positive consensus regarding the theoretical explanation of the
mechanisms underlying perceptual organisation:the ability to impose structural organisation on
sensory data [Palmer 1983]. It is within this process that symmetry plays an important part in
perception.
The concept of perceptual organisation was developed principally within the Gestalt
tradition; it is within this context that the relationship between symmetry and perception will be
examined. Symmetry has a role in three aspects of perceptual organisation: perceptual
grouping, figurai goodness’,and shape equivalence. For the sake of completeness each of these will discussed. However, it is the first, perceptual grouping, that is central to the work discussed
Chapter 2_______________________________________
Symmetry and Perception
2.1 The Gestalt Theory of Perception
The Gestalt school of psychology was founded in the early 20th century by three German
psychologists Koffka [1935], Kohler [1929], and Wertheimer [1923]. Derived from the
philosophical views of Descartes and Kant, Gestalt theory claims that perception is an interactive
act [Rock 1995]. Perception is not just the awareness of an image containing two dimensional
(2D) regions that correspond to external objects: it necessarily involves the imposition of mental
concepts upon the sensory information received. For example, two dots together on a page have
the property of orientation; a trait that each individual dot, when considered alone, does not
have. Orientation is an emergent property attributed by the perceiver onto the world
[McCafferty 1990]. For the Gestalt psychologist, meaning is derived from visual sensory data
after it has been organised into sensible wholes or Gestalts. Without this organisational pre
processing, the world would appear as a chaotic juxtaposition of sensory primitives.
2.1.1 Perceptual Organisation - Grouping.
Max Wertheimer, a leading exponent of the Gestalt ideology, postulated processes within the
visual nervous system that unify perceptual stimuli by conferring the simplest and most balanced
organisation upon them. Wertheimer claimed that perception organises stimulation by grouping
stimuli according to certain properties present in the retinal image [Wertheimer 1923]. He
defined a number of principles that govern how grouping is achieved, for example:
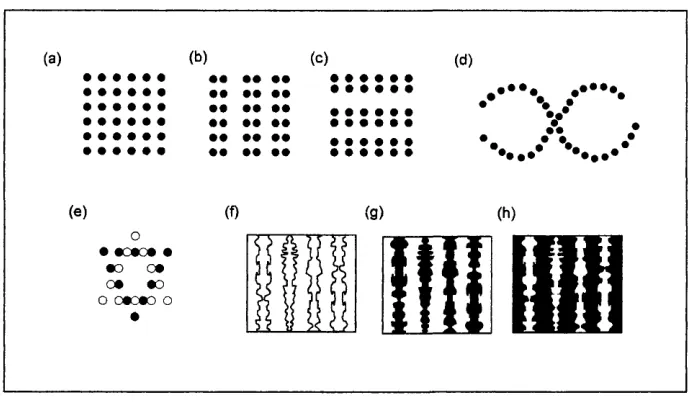
• The principle of proximity. Elements in an image that are close together will be perceived
as being part of a single entity. Evenly spaced dots appear as a grid with no dominant
direction or pattern (figure 2.1a). Changing the spacing between the dots results m the
apparent grouping of the closer dots (figure 2. lb and c). [Gordon 1989, pp 53-54].
• The principle of good continuation. The elements of an image that are aligned in a
smooth, continuous manner are perceived as being part of the same object. The dots in figure
2. Id appear to form two distinct curves[Gordon 1989, pp 53-54].
• The principle of similarity. A resemblance in the properties of the elements in an image
(e.g., size, intensity or colour) causes them to appear to belong to the same object. The
difference in colour o f the dots in figure 2. le causes them to be perceived as part of two
Chapter 2
Symmetry and Perception
The principle of symmetry. Symmetrical contours define a figure and isolate it from the
background.(figure 2. If). The most prominent shapes that can be constructed from a series
of lines are those that have a symmetrical boundaries. Even when the distinction is biased by
other segregation phenomena, e.g. colour co-operation where black objects are favoured as
figures and white as ground, the principle of symmetry dominates the selection (figure 2.1 g
and figure 2.1h).'^
(a) (b) ( c ) ( d )
:::
• • • • • •
... .
(e) (f) (g) (h)
o • #c#c# #
#o o# o# #o o o#c#o o
•
F ig u re 2.1 W erth e im er’s g ro u p in g p rin c ip le s: U n g ro u p ed d o ts (a). P ro x im ity in d u ced g ro u p in g in to colu m n s (b) a n d into ro w s (c). G ro u p in g b y c on tin u ation (d), a n d sim ila rity (e). The p r in c ip le o f sym m etry (j) do m in a tes even when o th e r fig u r e -g r o u n d seg re g a tio n f a c to r s exist, e.g., c o lo u r co -o p era tio n (g, h).
Not only does symmetry have an important role in the specific concept of perceptual
grouping, it is also fundamental to the general concept of perceptual organisation. Particularly,
this is the case with respect to the isolation o f individual figures previously distinguished by
grouping. The importance of all the aspects o f perceptual grouping in the human visual process
has been recognised by the computer vision community. Its role in artificial vision systems will
be discussed in detail in chapter three. Particular attention will be given to symmetry based
grouping, since the techniques involved in its implementation are central to the ideas developed
in this work.
2.1.2 Perceptual Organisation - Figurai Goodness
The principles of grouping are considered by Gestalt psychologists to be inherent in the general
law of figurai goodness (Pragnanz) that governs all perceptual organisation. According to this principle, figures possess varying degrees of figurai goodness that enable an object to be easily
Chapter 2_______________________________________
Symmetry and Perception
and accurately isolated in a perceived scene. Good figures are simple and regular, and bad
figures are complicated and irregular.
Subjective feelings of order, regularity and simplicity are associated with the perceived
form o f a figure and it is the extent of these subjective experiences that indicate its goodness.
Figurai goodness is not a matter of taste. People differ in their aesthetic preference for complex
irregular figures. However, there tends to be general agreement as to what is good and bad in
the sense described above [Berlyne 1971]. Arguably such an isolated subjective phenomenon
has little scientific value. However, most perceptual tasks including recollection, recognition,
description, and matching have been shown to be directly related to figurai goodness [Gamer
1974]. Given the importance o f figurai goodness, a characterisation of the image properties that
provoke this subjective response is necessary if perception is to be understood.
2.1.2.1 The Characterisation of Figurai Goodness
The early Gestalt psychologists accepted that goodness is an un-analysable primitive that is
tentatively related to symmetry. This view is limited and of little practical benefit. The advent
of information theory saw the first useful characterisation of figurai goodness [Attneave 1954].
A good figure was considered to contain less information than a bad one. That is, a good figure
is highly redundant in the sense that large areas of its own shape are highly predicable fi’om other
portions of itself [Hochberg and McAlister 1953]. In this respect symmetrical figures can be
described as having more goodness than non-symmetrical figures. Although potentially
complicated, they have a predictable repeated structure and therefore contain only a small
amount of unique information, the rest of which is redundant.
The information theoretical construct of redundancy meant that “figurai goodness” could
be defined in an objectively stable and non-circular fashion. However, early formulations of this
idea did not make explicit the mechanism by which the amount o f information in a given pattern
is determined [Attneave 1954]. This was rectified by Leeuwenberg [1971; 1978], who
developed a systematic coding theory that enabled effective figurai description and the
quantification of redundancy. The degree of redundancy in a figure is effectively a measure of
figurai goodness. Both Attneave and Leeuwenberg considered redundancy to be a property that
identifies the sameness and identity of figure in terms of the relationship between its local parts.
However, this idea does not conform to the Gestalt notion o f wholeness. Another approach,
more in line with the Gestalt ideology, assumes that a good figure is redundant to the extent that
it is the same as itself after various transformations [Gamer 1974]. On the basis of this idea
Gamer developed the reflection and rotation measure which could be used to quantify goodness.
Chapter 2_______________________________________
Symmetry and Perception
patterns produced by its reflection or rotation. Experiments showed [Gamer and Clement 1963]
reflection and rotation correlated highly with the way subjects rate goodness; the lower the
rotation or reflection value, the higher the goodness.
Stephen Palmer has reinterpreted Gamer’s work in a way that enables the results to be
formulated in group theoretic terms enabling a more refined analysis extendible to other sorts of
geometric regularities. Gamer claims that good figures have few transformational variants
whereas bad figures have many. Palmer reformulated Gamer’s view so that goodness is
described in the opposite but nearly equivalent language o f transformational invariance, i.e., symmetry. Thus good figures have greater transformational invariance (symmetry) than bad
figures. This view would seem to corroborate the beliefs of the early Gestaltist’s and Attneave’s
view that the aspect o f figurai goodness best captured by redundancy is symmetry [Attneave
1959].
2.1.2.2 Goodness and Symmetry
These conclusions have been corroborated in a study performed by Palmer in which it was
shown that goodness ratings are related to global and local symmetries [Palmer 1983; 1991].
Observers were presented with thirty five images of a rectangle and a single small circle in one
of the positions shown in figure 2.2a. Each image was orientated such that the long axis of
reflectional symmetry (bilateral axis) was horizontal. (The global and local reflectional
symmetries^ o f a rectangle are shown in figure 2.2b.) The participants were asked to rate how
good, stable and natural the position of each circle was within the rectangle on a scale of one
(bad, unstable, unnatural) to seven (good, stable, natural). The results are displayed in figure
2.2c. The highest ratings were given to the central position. The second highest ratings occurred
along the vertical axis of global symmetry, followed by those along the horizontal axis. Next
come the sub-symmetries - the bisectors o f the four comers. These are only local regions of the
figure but they are still perceived to be better than the remaining positions.
The fact that the vertically orientated symmetry was preferred to the horizontal
symmetry confirms other studies concerning orientation effects in explicit symmetry detection
[Palmer and Hemenway 1978]. It can be concluded fi*om Palmer’s experiments that goodness is
systematically related to global and local symmetry within a shape. The relationship between the
symmetry structure inside a rectangle as measured by goodness ratings and symmetry-based
shape descriptors was noted by Brady [1983] and will be discussed in chapter 4.
Chapter 2
Symmetry and Perception
(a)
o o o o o o o
o o o o o o o
o o o o o o o
o o o o o o o
o o o o o o o
(c)
0 @ 0 0 0 0 @
0 0 0 0 0 0 0
0 0 0 0 0 0 0
0 0 0 0 0 0 0
0 0 0 0 0 0 0
Global S y m m e t r i e s ---Local Symmetries
F igu re 2 ,2 Sym m etry stru ctu re in sid e a rec ta n g le a s m ea su re d b y g o o d n e ss ra tin g s (c) f o r a sm a ll c ircle p la c e d a t a n y one o f 35 p o s itio n s (a ) th a t l ie a lo n g the g lo b a l o f lo ca l sym m etry a x e s ( b ) f
2.1.3 Perceptual Organisation - Shape Equivalence
Another equally important aspect of perceptual organisation is Shape Equivalence.^ This is the
ability to recognise that two objects have the same shape even though they might differ in
position, orientation, size, sense (mirror-image reflection) or any combination of these four
properties. In order to achieve this, the perceptual system must be able to identify and exclude
(or account for) the effects of the set o f transformations underlying these characteristics. This set
o f transformations includes translation, rotation dilatation, reflection and their composites. Two
hypotheses have been posited which explain shape equivalency:
• The Invariant feature hypothesis [Palmer 1983; 1989] claims that two shapes are
equivalent if certain geometric properties, which by definition do not change during a
transformation, are the same in both objects. Transformation invariant features include:
number of lines; angle size; relative length of lines; and number of angles.*
• The Reference frame hypothesis [Palmer 1983; 1989] states that equivalency is determined
by eliminating the underlying transformations and associated effects that complicate
recognition. This is accomplished by imposing an intrinsic frame o f reference on the stimuli
concerned.
^ Diagram taken from Palmer [1983 p 286]. ’ Also know as shape constance [Palmer 1983].
Chapter 2
Symmetry and Perception
2.1.3.1 The Reference Frame Hypothesis - An Example
The reference frame hypothesis is most relevant to the present discussion and is best explained in
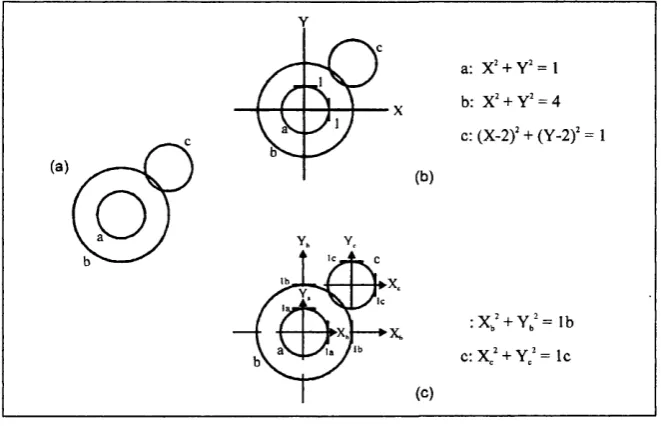
terms o f a simple geometric analogy [Palmer 1983 pp. 275-277; 1989 125-127]. Consider three
circles: a, b, and c (Figure 2.3a). It is obviously true that they have the same shape but differ
from each other with respect to size and position. It is reasonable to assume that a frame of
reference, similar to a Cartesian co-ordinate system, is required against which the properties of
these objects are perceived and compared (Figure 2.3b). If these circles are described within a
single extrinsic frame o f reference common to them all, their mathematical shape descriptions
(represented by the equations in Figure 2.3) would be different and equivalency would not be
apparent. Alternatively, each circle can be described in terms o f its own reference frame that
captures its intrinsic structure. This is achieved by placing the origin o f each frame at the centre
of a circle and making the unit size of the frame equal to the radius of the circle it describes. In
this situation each frame would optimally correspond to the structure o f a circle (Figure 2.3c).
All three descriptions would be the same and variations due to size and position are eliminated,
leaving the shape descriptions invariant and obviously equivalent.^
a: X' + Y' = 1
b: X' + Y' = 4
c: (X -2 f + (Y - 2 f = 1
F igu re 2 .3 A s e t o f circles (A) can b e d e s c r ib e d in d ifferen t referen ce fra m e s: eq u a tio n s f o r c ir c le s can b e g ive n re la tiv e to the sam e referen ce system (b) o r d ifferen t referen ce
sy stem s s e le c te d to c o rre sp o n d to the s im p le st d e sc rip tio n (c).
This simple example demonstrates that an appropriately chosen intrinsic reference frame
compensates for translation effects and enables shape equivalency to be determined. Much work
^ Although it cannot be demonstrated in this simple example, because of the symmetrical nature of the example figures, intrinsic reference frames can compensate for differences in orientation and sense. For asymmetric figures, differences in orientation are compensated by reflecting the frame about its origin and difference in sense by reflecting it about its axis.
Chapter 2_______________________________________
Symmetry and Perception
has been carried out to support this view and to justify the general claim that reference frames
have a fundamental role in shape perception and memory [Rock 1973; Wiser 1981]. It has also
been shown that the reference frame hypothesis succeeds in accounting for certain perceptual
anomalies that undermine other explanations of shape equivalency.^^
2.1.3.2 The Reference Frame Hypothesis and Symmetry
The reference frame hypothesis requires the selection of an intrinsic frame. In the
majority of cases a choice of frames exists. It follows that a particular property o f an object
must cause the visual system to select one orientation as the intrinsic standard rather than
another. Three properties are potential candidates for this role and have been tested
experimentally [Palmer 1992]:
• The axis of elongation [Palmer 1975; Marr and Nishihara 1978], i.e., the longest axis
o f a figure, such as the major axis o f an ellipse.
• The axis of reflectional symmetry [Palmer and Bucher 1982b; Palmer 1983; Palmer
1985].
• Low spatial frequency power [Ginsburg 1971; Janez 1983]’^
Palmer’s experimental scrutiny has shown that the axis of elongation is not a major
factor in estabhshing perceptual reference frames and the symmetry based approach fares better
than spatial frequency models. Symmetry alone does not appear to be entirely adequate either.
Obviously there are unanswered questions concerning this point, and work remains to be done.
However, it is unlikely that this doubt undermines the general role of symmetry in perceptual
organisation.
2.1.4 The Nature of Symmetry
In an end-note to his work on reference frames Palmer makes an interesting point concerning the
nature o f symmetry that is worth considering [Palmer 1992]. From a geometric point o f view, a
figure either is or is not symmetrical. Perceptually this is not the case: few things in the world
are perfectly symmetrical, yet is possible to recognise an approximation to symmetry. It is
highly likely that the perceptual system works with a continuous representation of “degrees of
symmetry”. At the time at which he made this point, the quantitative nature o f continuous
symmetry had not been determined. This is a principal objective o f this work.
" A n overview ean be found in Palmer’s work [Palmer 1983 pp. 27 5 -2 7 7 ; 1989 125-127],
Chapter 2_______________________________________
Symmetry and Perception
There is little doubt that symmetry has a role in human visual perception. In the next
chapter, the symmetry extraction techniques used in practical attempts to model the symmetry
based grouping will be discussed
2.2 Summary
Assuming the validity of the Gestalt theory of perception, perceptual organisation has a central
role in human vision. Three aspects o f perceptual organisation have been discussed; each of
them are dependent on the ability to isolated and detect symmetry. The simple experiments
performed by Palmer and his associated arguments appear to give credence to claims that the
principle o f figurai goodness, which underpins the concept of perceptual organisation, is
symmetry dependent. More specifically, the pictorial evidence (figure 2. Ih) for symmetry based
Chapter Three
Symmetry and Computer Vision
3. Overview
In the previous chapter, the importance of perceptual organisation (particularly symmetry based
grouping) in human visual perception has been discussed. In this chapter these ideas will be
developed further with the intention of explaining the symmetry extraction techniques that have
been used in practical attempts to model the grouping processes.
A Gestalt based psychological approach, incorporating perceptual organisation, is one of
a number of theoretical models underlying various computer vision methodologies. The truth or
falsity of these doctrines will not be argued in this discussion. For present purposes it will be
assumed that the symmetry extraction techniques incorporated in perceptual organisation based
vision systems are significant in their own right, even though arguments may exist that counter
Chapter 3___________________________________
Symmetry and Machine Vision
3.1 Perceptual Organisation and Machine Vision
David Marr was one of the first to acknowledge the role of perceptual organisation in machine
vision. He proposed that grouping occurred on the basis of similarity between edge points and
lines during the derivation of the full primal sketch. However, this was only a small aspect of
his hierarchical explanation of the visual process and it is hardly discussed in his work [Marr
1982]. The full significance of perceptual organisation in the development of machine vision
was first recognised by Witkin and Tenenbaum [1983b], and Lowe [1985; 1987] They have
suggested that models of vision which necessitate bottom-up depth reconstruction depend on
information that is either often unavailable or expensive to obtain. In particular, Lowe has
argued that the fundamental problem o f computer vision consists in bridging the gap between
2D images and knowledge of 3D objects, and it is not solved by the derivation o f depth. The
solution, according to Lowe, entails matching image structures made apparent by perceptual
organisation to corresponding object structures through a knowledge-based matching process
[Lowe 1987].
There has been a proliferation of research concerning the role of perceptual organisation
in machine vision.’^ Although the type o f organisation most considered by the computer vision
community is grouping, the nature and diversity o f their work has given rise to inconsistencies in terminology and resulted in confusion. Specifically, ambiguities have arisen with regard to the
meaning of the term “perceptual organisation”. Perceptual organisation based vision systems are
necessarily recursive: features identified by grouping are themselves grouped [Mohan and
Nevatia 1992]. It follows that various groupings are applicable to different types of image
features at various stages in the vision process. Thus, the term “perceptual organisation” can
refer to different groupings and image features at each level of grouping. In response to these
difficulties Sarkar and Boyer [1993 pp 365-392] have proposed a standard nomenclature to
discuss work in this area. It is with the aid o f this framework that the role of perceptual
organisation in computer vision will now be described.
3.2 Perceptual Organisation - A Classification System
Sakar and Boyer’s classification of perceptual organisation is based on the fact that perceptual
groupings differ from one another with respect to the type of features they influence and the
dimensions over which the organisation is sought. These two factors comprise the axes in a
diagrammatic representation of their classification stmcture. One axis represents the feature
types to be organised, the other represents the dimensions over which organisation is sought
Chapter 3
Symmetry and Machine Vision
(table 3.1). The complete classificatory structure covers dimensions ranging from 2D to 3D plus
motion. For the purposes of the present discussion it is only necessary to consider 2D
organisation.14
Assembly
Level
Stmctures found below.
Organisation of the structures.
Arrangement of polygon.
Structural
Level
Edge and region primitives
ribbons, comers, merges,
polygon, closed regions.
Primitive
Level
regions, edge chains.
region boundaries,
contour segmentation.
Signal
Level
Dots, Interest points.
dot clusters, edge chains
regions, textile analysis.
2D
T a b le 3.1 The Sakar and B oyer [1993] classificatory structure for perceptual organisation (2 D only). The first row o f each b ox (above the dotted line) lists som e o f the typical features to be organised. The second row (below the dotted line) lists som e typical output organisations.
The perceptual organisation o f 2D data occurs in foiu* stages that are categorised
according to the feature type. At the signal level, the raw data in the initial grey scale image is
organised: pixels and interest points are arranged into extended regions, edge chains and dot
clusters. This is achieved by edge detection [e.g. Canny 1986] and region segmentation [e.g.,
Pavlidis and Liow 1990]^^. Edge detection organises points which are possible object
boundaries by identifying those exhibiting certain photometric characteristics. Segmentation
techniques group pixels together into regions on the bases o f proximity and similarity.
The delineation of the primitive and the structural levels is based on the
“dimensionality” of the identified features with respect to the domain of organisation.
Dimentionality refers to the number of parameters that are needed to define a feature. At the
A detailed account o f this classification system , along with a review o f the associated algorithms can be found in Sarkar and B oyer [1993]
Chapter 3___________________________________
Symmetry and Machine Vision
primitive level, the features extracted from the signal level are organised into higher level features of dimensionality one (e.g., region boundaries and contour segments). This is achieved
by contour segmentation which finds edge pixels with similar curvature or contrast. These
extracted features are then organised at the structural level into 2D shapes that encode structural
relationships. These shapes, commonly called collated features [Mohan and Nevatia 1992], are
obtained by grouping the features extracted at the primitive level according to the geometric
relationships o f continuity, proximity, closure and symmetry. The resulting collated features
have a dimentionality of two and are curves, points, contours, ribbons and symmetries (pairs of
mutually symmetric curves). It is the organisation that goes on at this level that is generally
referred to by the term “perceptual organisation”. Finally, at the assembly level collated features
are organised into segregated groups, e.g., groups of ribbons are isolated. This level is
unbounded and can continue indefinitely.
3.3 Perceptual Organisation Based Vision Systems
One o f the first general systems to incorporate perceptual organisation (SCERPO - Spatial
Correspondence, Evidential Reasoning and Perceptual Organisation) was developed by Lowe
[1985] for recognising 3D objects in monocular grey scale images. Although symmetry does
not feature in his implementation, other grouping processes including collinearity, parallelism
and proximity of line segment endpoints are central in the organisation of spatial information at
the structural level. These same principles o f grouping also feature in more task specific
applications of perceptual organisation which involve the segmentation o f specific types of
objects with parallel or rectangular components represented in aerial photographs (e.g., buildings
and runways [Huertas and Nevatia 1988; Mohan and Nevatia 1989; Denasi, Quaglia et al.
1992]). Another general approach, developed by McCafferty[ 1990], involves the formulation of
the grouping tasks as an energy minimisation problem that is solved by simulated annealing.
Although McCafferty acknowledges the importance of symmetry, again it is not implemented.
Symmetry does not feature in the examples of computational perceptual organisation
mentioned so far. It has been suggested that symmetry is rarely used because it is much harder
to detect compared to other grouping properties [McCafferty 1990; Cham and Cipolla 1995].
However, it has been recognised that in order to handle a broader range of edge and region
primitives at the structural level it is necessary to utilise the full range o f grouping mechanisms
in order to isolate the diversity of shapes and shape components. A successful implementation
of such an approach is the CANC2 [Mohan and Nevatia 1992] vision system which uses most
grouping principles to produce quality output for high-level analysis, e.g., shape extraction. The
![Table 3.1 The Sakar and Boyer [1993] classificatory structure for perceptual organisation (2D only)](https://thumb-us.123doks.com/thumbv2/123dok_us/8624807.1414515/34.596.102.412.149.425/table-sakar-boyer-classificatory-structure-perceptual-organisation-d.webp)