University of South Carolina
Scholar Commons
Theses and Dissertations
1-1-2013
Effect of Physiological Oxygen Levels On
Osteogenic Differentiation of Adipose-Derived
Stem Cells
Suchit Sahai
University of South Carolina
Follow this and additional works at:https://scholarcommons.sc.edu/etd Part of theBiomedical Commons
This Open Access Dissertation is brought to you by Scholar Commons. It has been accepted for inclusion in Theses and Dissertations by an authorized administrator of Scholar Commons. For more information, please contactdillarda@mailbox.sc.edu.
Recommended Citation
Sahai, S.(2013).Effect of Physiological Oxygen Levels On Osteogenic Differentiation of Adipose-Derived Stem Cells.(Doctoral dissertation).
EFFECT OF PHYSIOLOGICAL OXYGEN LEVELS ON OSTEOGENIC
DIFFERENTIATION OF ADIPOSE-DERIVED STEM CELLS
by Suchit Sahai Bachelor of Technology
ICFAI Institute of Science and Technology, 2007
Submitted in Partial Fulfillment of the Requirements For the Degree of Doctor of Philosophy in
Biomedical Engineering
College of Engineering and Computing University of South Carolina
2013 Accepted by:
Dr. James Blanchette, Advisor Dr. Esmaiel Jabbari, Committee Member
Dr. Peisheng Xu, Committee Member Dr. Melissa Moss, Committee Member Dr. Shekhar Patel, Committee Member
DEDICATION
ACKNOWLEDGEMENTS
I would like to thank to my PhD advisor, Dr. James Blanchette (Jay) for supporting me during these past four and a half years. Jay is a great advisor, humorous, energetic and enthusiastic. His open door policy, unique ways to discuss research topics and valuable insights helped me to dig deeper into science. He’ll be my role model as a scientist, advisor, and teacher. I also have to thank the members of my PhD committee, Dr. Moss, Dr. Jabbari, Dr. Patel, Dr. Xu for their class lectures and helpful advices. A good support system is important to surviving and staying sane in grad school. Matt, Pritesh, Romone, Amanda, Brandon, Rachel and Aiden formed the core of my research time in the Blanchette group. Matt is a person I could always ask for advice or opinions and go for a drink after a long day at work.
ABSTRACT
TABLE OF CONTENTS
DEDICATION... ii
ACKNOWLEDGEMENTS... iii
ABSTRACT... iv
LIST OF TABLES... vii
LIST OF FIGURES... viii
LIST OF ABBREVIATIONS... ix
CHAPTER 1 INTRODUCTION...1
1.1 EFFECT OF LOW OXYGEN ON STEM CELLS...1
1.2 MECHANISM OF CELL RESPONSE...5
1.3 EFFECT OF OXYGEN ON OSTEOGENIC DIFFERENTIATION...13
CHAPTER 2 OBJECTIVES AND EXPERIMENTAL DESIGN...21
CHAPTER 3 TRACKING HYPOXIC SIGNALING IN ENCAPSULATED STEM CELLS...24
3.1 INTRODUCTION...24
3.2 MATERIALS AND METHODS...28
3.3 RESULTS...33
3.4 DISCUSSION...39
CHAPTER 4: OSTEOGENIC DIFFERENTIATION OF ADIPOSE-DERIVED STEM CELLS IS HIF-1 INDEPENDENT ...43
4.2 MATERIALS AND METHODS...45
4.3 RESULTS...51
4.4 DISCUSSION...61
CHAPTER 5: VARIED ISCHEMIC PRECONDITIONING PROTOCOLS TO ENHANCE ENGRAFTMENT AND DIFFERENTIATION OF ADIPOSE DERIVED STEM CELLS ...64
5.1 INTRODUCTION...64
5.2 MATERIALS AND METHODS...66
5.3 RESULTS...72
5.4 DISCUSSION...79
CHAPTER 6 SCIENTIFIC CONTRIBUTIONS OF THIS STUDY...82
LIST OF TABLES
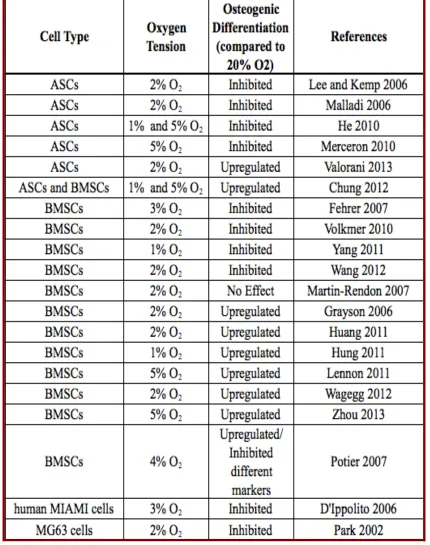
Table 1 Studies examining effect of oxygen on osteogenesis of stem cells ...18
Table 5.1 Comparison of apoptotic markers at 1% oxygen...77
Table 5.2 Comparison of apoptotic markers at 2% oxygen...77
LIST OF FIGURES
Figure 1.1 Stem cell microenvironment...2
Figure 1.2 Mechanism of cell response to hypoxia ...10
Figure 2.1 Experimental Design 1 ...21
Figure 2.2 Experimental Design 2 ...22
Figure 2.3 Experimental Design 3 ...23
Figure 3.1 Immunostaining for HIF-1α...34
Figure 3.2 Hypoxia marker progressions in 2-D and 3-D ...36
Figure 3.3 Quantification of cells positive for marker signal ...37
Figure 3.4 Western Blot of HIF-1α and β-actin...38
Figure 4.1 Effect of HIF-1 on ALP Activity in 2-D and 3-D ...52
Figure 4.2 Effect of HIF-1 on mineral deposition in 2-D and 3-D ...54
Figure 4.3 Effect of HIF-1 on the expression of ON & OPN in 2-D...56
Figure 4.4 Effect of HIF-1 on the expression of ON & OPN in 3-D...57
Figure 4.5 Effect of HIF-1 on VEGF release in 2-D and 3-D ...59
Figure 4.6 Effect of HIF-1 on the viability in 2-D and 2-D...60
Figure 5.1 Overview of IPC...68
Figure 5.2 Flow Cytometric analysis to examine the effect of IPC on stemness ...72
Figure 5.3 Expression of apoptotic markers in the absence of HIF-1 ...73
Figure 5.4 Expression of apoptotic markers in the presence of HIF-1 ...74
LIST OF ABBREVIATIONS
OC ...Osteocalcin ODD...Oxygen Dependent Domain ON... Osteonectin OPN ... Osteopontin P ...Passage p...Probability P/S...Penicillin/Streptomycin PNPP...p-nitrophenyl phosphate pVHL ...von Hippel-Lindau tumor suppressor gene SDS-PAGE ... Sodium Dodecyl Sulfate Polyacrylamide Gel Electrophoresis VEGF ... Vascular Endothelial Growth Factor
CHAPTER 1
I
NTRODUCTION1.1 EFFECT OF LOW OXYGEN ON STEM CELLS 1.1.1 Stem Cells and their Microenvironment
Stem cells produce all tissues in the body through proliferation and
differentiation in response to cues from their microenvironment. Because of their
plasticity, they are particularly sensitive to their immediate environments. In vivo they are
thought to reside in specific niches, which maintain their pluripotent or multipotent
capabilities. Consequently, differentiation along specific lineages is thought to coincide
with their migration out of their specific niche into an environment that provides
appropriate differentiation cues [Watt 2000].
As the field of tissue engineering has matured, new technology has been
employed to regulate the application of mechanical as well as biological factors to
developing tissue constructs. However, one developmentally important stimulus that is
still rarely accounted for during in vitro culture is the oxygen tension. Low oxygen or
hypoxia plays a substantial and critical role in many essential physiological and
developmental pathways.
Human embryonic stem cells that are derived from the inner cell mass of
early stage blastocytes adapt to grow in this low oxygen environment until about the 11th
of oxygen increases from 2.3% to 7.8% O2 [Rodesch 1992]. The oxygen distribution
within the bone marrow has been studied almost exclusively in the context of
hematopoietic stem cells (HSCs) and to a much lesser extent in the context of
mesenchymal stem cells (MSCs). Early direct measurement revealed that bone marrow in
general is hypoxic, where some regions are as low as 1–2% O2 [Cipolleschi 1993, Kofoed
1985]. Results from recent in vivo studies, however, provided direct experimental
evidence that long-term repopulating HSCs in the mouse reside in a hypoxic environment
and hypoxia may in fact be an essential part of the microenvironment that maintains them
in an undifferentiated state [Parmar 2007]. These measurements were further supported
by modeling analysis of in vivo oxygen distribution in bone marrow indicating that HSCs
exist within an extremely hypoxic region within bone marrow [Chow 2001].
Figure 1.1: Stem cell microenvironment.
In addition to bone marrow MSCs, adipose tissue has been identified as a
source of multipotent cells that have the capacity to differentiate towards the adipogenic,
chondrogenic, myogenic and osteogenic lineages [Gronthos 2001, Zuk 2002, Cho 2005,
(ASCs) can be readily obtained from tissue harvested through liposuction or through
abdominoplasty procedures. Despite the high degree of vascularity of adipose tissue
relative to bone marrow, in vivo measurements of oxygen concentrations in mouse
adipose tissues have shown the oxygen concentration to be in the vicinity of 3%, and so
hypoxic cultures may still be beneficial to ASC in vitro proliferation and differentiation
characteristics [Matsumoto 2005, Wang 2005, Zachar 2011]. Thus, physiologically
relevant stem cell responses should be expected to occur as oxygen levels shift within this
range.
1.1.2 Effect of Oxygen on Proliferation and Differentiation of Stem Cells
Low O2 environments have long been used by embryologists to culture
embryos and the blastocytes produced under low O2 have significantly more inner cell
mass compared with those generated under higher O2 [Nakao 1990, Thompson 1990,
Harvey 2004]. The benefits have been demonstrated for rabbit, mouse, sheep, cow, and
human embryos [Thompson 1990, Umaoka 1992, Li 1993, Catt 2000]. Culture conditions
utilizing a physiological oxygen tension of 5% instead of 20% were also found to
improve the establishment of mouse ESCs line by reducing oxidative stress [Wang 2006].
An oxygen tension of 2% resulted in enhanced human ESC clonal recovery and reduced
chromosomal abnormalities without inducing hESCs to adopt a more differentiated
phenotype [Forsyth 2006]. Low oxygen tension studies have been carried out with bone
marrow MSCs from a variety of mammalian species. In general, MSCs exhibited greater
colony-forming potential while proliferating at a higher rate and for an extended duration.
Martin-Rendon 2007]. Fewer investigations have been carried out concerning the effects
of hypoxia on ASCs. Different conditions using oxygen concentration in the range of
1-5% increased the growth rate of stem cells [Lee and Kemp 2005, Wang 2005, Malladi
2006, Xu 2007, Lee 2009, Fink 2011, Rasmussen 2011].
Local oxygen concentrations can also direct cellular differentiation. In
1961, Bassett and Hermann demonstrated that cells isolated from embryonic chick tibial
cortexes differentiate in vitro toward bone when maintained under high (35%) oxygen
concentrations and toward cartilage when maintained under low oxygen (5%)
concentrations [Bassett 1961]. A number of investigations have recently been confirmed
these early observations of oxygen-directed differentiation of cartilage and bone [Murphy
2001, Domm 2002, Saini 2004, Mizuno 2005, Utting 2006, Mizuno 2005, Chen 2006,
D’ippolito 2006, Hirao 2006]. Hypoxia inhibited the differentiation of primary rat
osteoblasts and human bone marrow MSCs to an osteogenic phenotype [D’Ippolito 2006,
Utting 2006]. In contrast, low oxygen conditions have been demonstrated to induce
chondrogenic differentiation when expanded human chondrocytes were pelleted or
embedded in alginate [Domm 2002, Malda 2004, Murphy 2004]. Studies have shown the
strong influence of hypoxia on the differentiation potential of ASCs [Wang 2005, Betre
2006, Lee and Kemp 2006, Malladi 2006, Xu 2006, Khan 2007]. Lee and Kemp showed
that hypoxia affected the potential of human ASCs to differentiate along muscle and
osteogenic lineages [Lee and Kemp 2006]. The effect of hypoxia on the differentiation
potential of ASCs was also reported for murine cells. It was found that murine ASCs
exhibited decreased chondrogenic and osteogenic potential when differentiated at 2% O2
examples of hypoxia both encouraging and discouraging differentiation of various types
of stem cells and influencing the specific lineage of differentiation [Malda 2007, Lin
2008, Ma 2009, Abdollahi 2010]. Hence, much effort has to expend to elucidate the
mechanisms via which cells sense oxygen levels and transduce the signal to elicit a
response.
1.2 MECHANISM OF CELL RESPONSE
Hypoxia Inducible Factors (HIF) family of proteins has been convincingly
demonstrated to mediate majority of the cellular responses under low oxygen
environment [Semenza and Wang 1992, Weiner 1996, Maltepe 1997, Iyer 1998, Wenger
2000, Goda 2003]. HIF is a αβ heterodimeric transcription factor. The HIF family comprises three α subunits: HIF-1α, HIF-2α and HIF-3α that are regulated by cellular
oxygen levels. The HIF-1β subunit (also known as the aryl hydrocarbon receptor nuclear translocator, ARNT) is constitutively expressed in the nucleus in an oxygen-independent
manner [Wang 1993]. Among the HIF family, HIF-1 is very well characterized and has
been shown to play a role in regulating more than 200 genes [Loboda, 2012, Haase
2013]. HIF-2α shares 48% amino acid homology and has similar structure and functional
domains with HIF-1α. Consequently, it is regulated via the same hydroxylase mechanisms described for HIF-1α and, although not all the downstream target genes of HIF-2α been identified, it is believed that it has distinct functions from HIF-1α in vivo
antagonizes hypoxia-responsive element dependent gene expression. [Wenger 2000,
Maynard 2007, Augstein 2011].
1.2.1 HIF-1: Mediator of Hypoxic Response
HIF-1 was identified and isolated by Semenza and Wang, due to its
binding an enhancer region in the 3’-flanking region of the EPO gene in response to
hypoxia [Semenza and Wang 1992]. It has since been shown that HIF-1 also binds the
enhancer region of VEGF (in its 5’-flanking region), GLUT-1, GLUT-3, GAPDH and a
plethora of other genes during hypoxic stress [Semenza 1999]. HIF-1 protein is
upregulated during hypoxia and when hypoxia is simulated by culturing cells in the
presence of cobalt chloride to replace the iron in the heme proteins, and knocking out the
gene for the HIF-1α subunit prevents cells from responding to hypoxic stress. These data
indicate that HIF-1 plays a central role in the mechanism for eliciting cellular responses
to hypoxia.
1.2.2 Mechanism of Cellular Hypoxia Response: HIF-1
Further examination of 256-base-pair region of the erythropoietin gene,
the study delineated the essential 50-nucleotide enhancer sequence, eventually termed the
hypoxia-responsive element (HRE), and identified a nuclear factor which exhibited
hypoxia-dependent binding to the HRE [Semenza 1992]. Presence of a functional HRE
resulted in a seven-fold increase in erythropoietin production in response to hypoxia (1%
oxygen). Maxwell, et al., soon showed that HRE elicited hypoxia-responsive
fetal lung fibroblasts, human skin fibroblasts, human monocyte/macrophage cells,
monkey renal fibroblasts, pig retinal epithelial cells, rat aortic endothelial cells, Chinese
hamster lung fibroblasts, Chinese hamster ovary cells, mouse renal adenocarcinomas, and
mouse erythroleukemias were transiently transfected with a plasmid containing the HRE
enhancer fused to a broadly active promoter and the α1-globin gene as a reporter
[Maxwell 1993]. In 1% oxygen, 11 of the 12 tested lines demonstrated a 3 to 11-fold
induction of α1-globin production, similar to the original observations in hepatomas. This
implied that the same hypoxia-responsive nuclear factor responsible for HRE binding and
erythropoietin upregulation must be present in a range of cell types and may represent a
widespread mechanism for response to hypoxia.
Following studies by Wang and Semenza showed that HIF-1 DNA
binding occurred in response to hypoxia in a number of mammalian cells types not
expressing the erythropoietin gene and that the sequence of the enhancer binding region
was conserved [Wang 1993]. HIF-1 ubiquity was further shown when Weiner, et al.,
demonstrated HIF-1 expression in all human and mouse organs tested, including brain,
kidney, liver, heart, placenta, pancreas, and skeletal muscle [Weiner 1996]. Additionally,
they showed an in vivo upregulation of HIF-1 in rats chambered in 7% oxygen. But
beyond triggering pathways designed to directly increase tissue oxygenation, HIF-1
activity was found to be vital in essential physiological and developmental pathways.
Embryogenesis, for example, is inhibited in embryonic stem cells that are unable to
produce HIF-1, even under normal, physiological oxygen conditions [Maltepe 1997, Iyer
1998]. HIF-1 is also essential for cell cycle arrest in hypoxic cells [Goda 2003]. The
1.2.3 Structure of HIF-1
HIF-1 is a heterodimeric protein composed of α and β subunits. Both subunits have been identified as basic-helix-loop-helix-PER-ARNT-SIM proteins
(bHLH/PAS) [Wang 1995, Kewely 2004]. Factors in this family must dimerize to
become functional and are defined by three major domains: (1) A bHLH domain near the
N-terminus responsible for non-specific dimerization with the basic region being the site
of DNA binding [Murre 1989, Ferré-D’Amaré 1993). (2) A PAS homology domain
(named for three early homologous Drosophila and human proteins in which the
sequence was found, periodic circadian protein (PER), aryl hydrocarbon receptor nuclear
translocator protein (ARNT), and single-minded protein (SIM)) which establishes
dimerization partner specificity and target gene specificity [Pongratz 1998]. (3) A
transactive domain which interacts with transcriptional coactivators to help initiate
transcription [Kewely 2004]. Wang et al., identified HIF-1α as a novel 120 kDa bHLH/PAS polypeptide while HIF-1β was identified as the previously known ARNT
[Wang 1995]. While the β unit is known to interact with a number of other bHLH/PAS proteins, HIF-1 α dimerizes almost exclusively with HIF-1β. In hepatoma cells, levels of
both HIF-1α and HIF-1β RNA and protein were dramatically increased upon exposure to 1% oxygen. RNA levels peaked at 1-2 hours of continuous hypoxia while protein levels
peaked between 4 and 8 hours. Levels of both diminished to basal values within minutes
after cells were returned to 20% oxygen. Additionally, HIF-1α was found to contain large clusters of proline, glutamic acid, serine or threonine (PEST) residues, which are
1.2.4 Regulation of HIF-1
Activation of HIF-1 is oxygen-dependent and is regulated by stability of
the HIF-1α protein subunit. Both HIF-1α and HIF-1β mRNAs are constitutively expressed intracellularly, but HIF-1α protein levels are nearly undetectable in normoxic
cells, even when HIF-1α is overexpressed. In hypoxic cells, high levels HIF-1α are observed, but HIF-1β levels are unaffected. Both DNA binding of HIF-1 and levels of
HIF-1α rapidly decrease upon reintroduction of normoxia [Haung 1996, Nguyen 2013, Prabhakar 2013]. The regulation of HIF-1 is represented schematically in Figure 1.2.
Ratcliffe et al. identified a region between amino acids 530 and 652 in
HIF-1α that conferred oxygen-dependent repression when transferred to a reporter gene system and suggested that the mechanism of regulation may be mediated by proteolytic
degredation [Ratcliffe 1998]. It was shown that in the presence of oxygen, the product of
the von Hippel-Lindau tumor suppressor gene (pVHL), in complex with several other
proteins, interacts directly with this region of HIF-1α (termed the oxygen-dependent
degradation domain (ODD)), marking the protein for proteosomal degradation by the
E3-ubiquitin ligase pathway [Ohh 2000]. Furthermore, a conserved family of
prolyl-4-hydroxylases were found to post-translantionally modify HIF-1 by hydroxylating specific
residues [Bruick 2001, Epstein 2001]. Most notably, HIF prolyl 4-hydroxylase 2 (P4H2)
is responsible for hydroxylating two key proline residues (Pro564 and Pro402) in the
HIF-1α ODD required for binding of pVHL [Ivan 2001, Masson 2001, Berra 2003]. Activity of the HIF prolyl-hydroxylase family of enzymes is dependent on Fe(II) and
Figure 1.2: Mechanism of cell response in hypoxia.
In low oxygen conditions, the hydroxylase is not active, HIF-1α is not
modified, the pVHL complex fails to bind, and HIF-1α is not degraded. Additionally, P4H2 mRNA is oxygen-inducible [Epstein, 2001]. Thus this enzyme appears to be the
key oxygen sensor responsible for setting basal normoxic HIF-1 levels. A secondary
regulatory mechanism was found to work in a similar manner. Under hypoxic conditions,
the C-terminal domain of HIF-1α is able to interact with coactivators, such as p300/CBP,
to initiate transcription of target genes [Ema 1999]. In normoxic conditions, a key
asparagine residue (Asp201) is hydroxylated, preventing binding of p300/CBP and
suppressing HIF-1 activity [Lando 2002]. The factor responsible for asparagine
hydroxylation, deemed factor inhibiting HIF-1 (FIH-1), functions similarly to P4H2, and
mechanisms, both dependent on post-translational protein modification, exist for
oxygen-dependent regulation of HIF-1α.
In summary, HIF-1α is constitutively expressed, but in normoxia the protein levels arekept low by rapid ubiquitination and proteosomal degradation. Activity
of any remaining basal HIF-1α is suppressed by the failure of the p300 co-activator to
bind. In hypoxic conditions, oxygen dependency of both hydroxylases prevents HIF-1α
modification and subsequently inhibits degradation and allows for binding of
co-activators and dimerization.
1.2.5 Kinetics of HIF-1 Response
Hydroxylated HIF-1α is rapidly degraded in vivo, with a half-life of approximately 5 minutes [Huang 1998]. Though the HIF-1α protein is very unstable in
normoxia, HIF-1α mRNA is constitutively expressed and the protein is constantly produced. Additionally, P4H2, the enzyme primarily responsible for hydroxylating
HIF-1α, has an activity dependent upon dioxygen with a Km (Michaelis constant) just above
the concentration of dissolved O2 in air. This high value ensures that even a small
decrease in oxygen is likely to have a significant effect on P4H2 activity and makes
oxygen concentration the limiting determiner of HIF-1α stability [Hirsila 2003]. Thus HIF-1 can be both a highly sensitive and rapidly responsive initiator of hypoxia response.
Even though low oxygen activity of HIF-1 is dependent upon de novo production of
HIF-1α, this can occur rapidly because HIF-1α mRNA is constantly produced [Semenza 1992]. Studying hepatoma cells exposed to 1% oxygen for 0-4 hours, Wang and Semenza
activity at 30 minutes, 50% maximal activity between 1 and 2 hours, and maximal
activity at 4 hours [Wang 1993]. After rapid re-exposure to 20% oxygen, HIF-1 activity
was reduced to 34% within 5 minutes and was eliminated by 15 minutes. The group also
showed that binding of stabilized HIF-1 to DNA occurred rapidly, with 77% binding
within 1 minute and 100% binding within 5 minutes.
1.2.6 Gradation of HIF-1 Response
The sensitivity of P4H2 to changes in oxygen concentration also imparts a
graded responsiveness of HIF-1 to O2. Jiang et al. exposed HeLa cells to oxygen
concentrations ranging from 0 to 20% and measured levels of the HIF-1 subunit proteins
and HIF-1 DNA binding [Jiang 1996]. As expected, the HIF-1α subunit was dramatically responsive to oxygen concentration. Between 20 and 6% oxygen, HIF-1α levels and
DNA binding modestly increased as oxygen concentration decreased. However, below
6% oxygen both HIF-1α and HIF-1 DNA binding increased exponentially to reach maximal values at 0.5% oxygen. Half-maximal responses were observed between 1.5 and
2% oxygen. Thus, the majority of HIF-1 activity takes place over a physiologically
relevant range of oxygen 0-5%, with the largest response at hypoxic levels 0.5-1.5%.
Bracken et al., tested the graded response of HIF-1 in a similar set of
experiments with a variety cell types: HEK293T, HeLa, COS-1, HepG2, CACO-2, and
PC12 cells [Bracken 2006]. In every case, they also found an exponential increase in
HIF-1α protein levels as oxygen was decreased from 5 to less than 1%. However, though HIF-1 activity, as measured by reporter protein production, was also maximal below 1%
differences in maximal reporter protein production levels between cells types, they noted
two categories of response. Some cells gradually increased reporter protein production as
oxygen decreased from 10 to less than 1%. Others required an oxygen concentration of
less than 2% before exhibiting a dramatic increase in reporter protein production, which
much more closely coincides with changes in HIF-1α levels. Therefore, having a system
that can help in tracking HIF-1 activity, would be helpful for the tissue engineering
community to link it to cell behavior or fate.
1.3 EFFECT OF OXYGEN ON OSTEOGENIC DIFFERENTIATION 1.3.1 Clinical Relevance: Critical-size Bone Defects (CSDs)
CSDs are bone defects that do not heal by themselves, as they are large
enough to preclude spontaneous healing. Critical-size bone defects can be either
inherited, occur following trauma, surgical correction of hereditary defects, through
infection, congenital anomalies but can also arise due to operative intervention such as
cyst and tumor resections [Rodriguez-Merchan 2004, Hulth 1989]. In general, CSDs can
be classified based on their morphological characteristics such as length, breadth and
depth of injury. In addition to this the localization of the defect plays an important role in
the treatment of the defect as it leads to decrease of mesenchymal progenitor cells. Apart
from this the decreased vascularity leading to low oxygen concentration at the site plays a
crucial role in the process of bone healing.
CSDs remain a clinically challenged problem in orthopedic surgery.
Currently, an autograft bone surgery is the gold standard method to treat CSDs. But, the
regarding the integration of implanted bone and vascular structures with native tissue and
longer rehabilitation time for patients in hospitals. To overcome these drawbacks, the
need for an alternative has been recognized [Langer and Vacanti 1993]. The concept of
the use of stem cells in therapeutic applications is an appealing one, as stem cells already
have a natural role in tissue repair and regeneration [Green 1977, Laurencin 1999, Blau
2001, Spraddling 2001, Allison 2002, Kneser 2002, Presnell 2002, Preston 2003].
1.3.2 Bone Cells and Expression of Osteogenic Markers
Bone is a vascularised tissue that provides mechanical stability to the
skeleton that is required for locomotion, load bearing and protection of the brain, spinal
cord, heart and lungs. Furthermore it serves as a mineral reservoir for calcium and serves
as an attachment ground for muscles, ligaments and tendons [Nakashima 2003]. There
are two fundamentally different mechanisms of ossification. Firstly, direct ossification of
embryonic connective tissue (intramembranous ossification) and secondly the
replacement of hyaline cartilage by compact bone (endochondral ossification).
Endochondral ossified bones, mainly large hollow bones such as femur, tibia or humerus,
represent most of the adult bones. Bones, such as clavicula or the skull develop by
intramembranous ossification [Bruick and McKnight 2002]. Both types of bone arise
during embryonic development by a complex interaction of diffusion of nutrients, oxygen
gradients and cellular apoptosis [Semenza 1999, Ivan 2001, Zhu 2001].
Bones are composed of different cell types; osteoprogenitor cells,
osteoblasts, osteocytes, and osteoclasts. The osteoprogenitor cells located in periosteum,
osteoblasts before forming bone. Factors with the capacity to induce this differentiation
towards osteoprogenitor cells and further towards osteoblasts include bone
morphogenetic proteins (BMPs), transforming growth factor-β (TGF-β), fibroblast growth factor (FGF), insulin-derived growth factor (IGF), platelet-derived growth factor
(PDGF), and interleukins. The primary function of osteoblasts is production and secretion
of organic and inorganic bone ECM [Mackie 2003]. Osteoblasts are also not terminally
differentiated cells. They have two fates: they become embedded in their own bone
matrix and become osteocytes, or undergo apoptosis [Jilka 1998, Safadi 2003].
Osteoblasts contain active cytoskeletal proteins to maintain their structural
integrity as well as facilitate motility and attachment to surfaces. Their contact
interactions with neighboring osteoblasts and osteocytes at intercellular gap junctions are
achieved by the extensions created by their plasma membranes. They lay down
premineralized bone matrix, osteoid, and subsequently facilitate its mineralization. The
osteoid matrix itself provides a favorable environment for crystallization. The
mineralization process involves supersaturation of extracellular fluids at local zones and
increased osteoblastic alkaline phophatase (ALP) activity, which raises local calcium and
phosphate concentrations [Stains 2005, Iain 2001]. Notably, conditions of high bone
turnover or rapid bone formation lead to increased ALP activity and increased circulatory
ALP levels. Osteoblasts also produce osteocalcin, which binds calcium, further
concentrating local calcium levels [Bielby 2004, Karner 2007].
The most abundant non-collagenous bone ECM protein is osteonectin.
Osteonectin (ON) has multiple Ca2+ and collagen binding sites and has been shown to be
most abundant non-collagenous protein in bone matrix is osteocalcin, which is a
vitamin-K dependent protein exhibiting Ca2+/HAp affinity, and has also been suggested to play a
role in osteoclast migration [Ducy 1996]. Osteopontin (OPN) is a multifunctional
extracellular glycoprotein involved primarily in cell migration, and regulation of mineral
deposition [de Oliveira 2004]. Among all the non-collagenous matrix proteins found in
mineralized tissue, OPN is unique as it preferentially accumulates at mineralized tissue
interfaces and at mineralized tissue/implant interfaces suggesting a role as an interfacial
adhesion molecule, thereby maintaining overall structural integrity of bone and
bone/implant systems [McKee 1996, Pietak 2006, Baht 2008]. ALP, OPN, OC and OPN
are therefore the typical biomarkers used for osteoblast phenotypic behavior when
tracking differentiation of a multipotent cell population.
1.3.3 Effect of Oxygen on Osteogenic Differentiation
Although it remains to be determined what true hypoxic conditions are, it
is now widely accepted that 20% of oxygen as commonly used in cell culture is rather a
state of artificial hyperoxia [Grayson 2007, Fehrer 2007, Malda 2007]. As discussed in
previous sections, low oxygen tensions (non-atmospheric) are considered to be a more
physiological milieu for stem cells and affects stem cell fate [Heppenstall 1975, Watt
2000, Warren 2001, Park 2002, Grayson 2006, Malladi 2006, Fehrer 2007, Potier 2007,
Volkmer 2010]. Several studies have been summarized in Table 1, to provide a more
detailed summary of the findings for the effects of in vitro hypoxia on the stem cells of
interest. It has been reported that hypoxia (2% and 5% O2) enhanced the in vitro and in
2007]. But in another study hypoxia inhibited the in vitro osteogenic potential of MIAMI
cells and induced down-regulation of osteoblastic genes in hMSCs in vitro [D’Ippolito
2006]. Several other articles have provided proof that osteogenic differentiation may be
negatively affected by hypoxia [Park 2002, Salim 2004, Malladi 2006, Utting 2006,
Potier 2007]. The majority of the studies have shown that hypoxia brings about a
decrease in the expression level of key transcription factors and osteogenic marker genes,
such as RUNX 2, OC, OPN and COL 1 [Park 2002, Salim 2004, Utting 2006]. However,
it is very difficult to arrive at a consensus even after collating and analyzing the results of
published studies. Differences in cell isolation methods, experimental parameters, growth
factor concentrations, oxygen tensions, and specific evaluation techniques highlight the
challenges in determining the role of oxygen in stem cell differentiation. Table 1 sums up
the list of some studies examining the effect of hypoxia on osteogenic differentiation of
stem cells.
At the site of fractured bone, a milieu of reduced oxygen triggers bone
healing linking hypoxia to osteogenic differentiation of bone precursor cells [Ke 2006,
Wang 2007, Giannoudis 2007, Riddle 2009, Araldi 2010]. It is thus evident that cells that
are utilized to regenerate bone tissue will face hypoxic conditions, either when used in
the setting of bone tissue engineering or whenever a fracture has occurred [Polykandriotis
1.3.4 Role of HIF-1 Pathway in Bone Formation
Wan and colleagues conducted experiments in osteoblasts of mice that
lacked pVHL and therefore had a constitutive HIF-1α activation and observed that these mice had an increased vascularity and produced more bone in response to distraction
osteogenesis compared to mice that lacked HIF-1α that had an impaired angiogenesis and
bone healing [Wan 2008]. Similarly Wang et al. showed that mice overexpressing HIF 1α
in osteoblasts through the deletion of the VHL expressed high levels of VEGF and
developed extremely dense, heavily vascularised long bones. In contrast they observed in
mice lacking HIF-1α in osteoblasts an opposite skeletal phenotype; in either the long bones were substantially thinner and less vascularised. In mice that lacked both VHL and
HIF-1α the phenotype of the long bone was intermediate between the mice lacking HIF-1α through the deletion of VHL and the mice overexpressing HIF-1α [Wang 2007].
Interestingly Wang et al. were able to show that upon HIF-1α knockdown the mice produced an elevated level of HIF-2α and as both HIF-1α and HIF-2α have overlapping function, HIF-2α might substitute partially for the loss of function of HIF-1α. This
compensatory mechanism might also explain why HIF-1α knockdown mice were still able to develop functional bone [Wang 2007]. Taken together the results of Wang and
Wan depicts HIF-1α pathway as a critical mediator of neoangiogenesis that is required for bone development and regeneration. Their studies collectively imply a possible
1.3.5 Summary
Oxygen is not only a nutrient but also an important signaling molecule
whose concentration can influence the fate of stem cells. The combination of 3-D
scaffolds and cells used to in tissue engineering applications often have limitations of
oxygen diffusion leading to gradient formation. Due to the link between local oxygen
levels and cell behavior, these gradients can cause heterogeneous behavior of cells. Cell
response to reduced oxygen tension is primarily regulated by HIF-1α. A number of
techniques exist to measure the amount of HIF-1α in cells but many require that the cells be lysed or fixed. Also, 1 activity does not always correlate with the amount of
HIF-1 protein or mRNA that compromises techniques measuring such quantities that seek to
predict expression of HIF-regulated genes. Therefore, it is important to have a system
that can track HIF-1 activity in 2-D as well as in 3-D to help understand cell behavior.
CHAPTER 2
O
BJECTIVES ANDE
XPERIMENTALD
ESIGNOBJECTIVE 1: The objective of this study is to evaluate a responsive, fluorescent,
hypoxiadetection system and determine whether HIF activity can be tracked at a cellular
level in both 2D and 3D cultures.
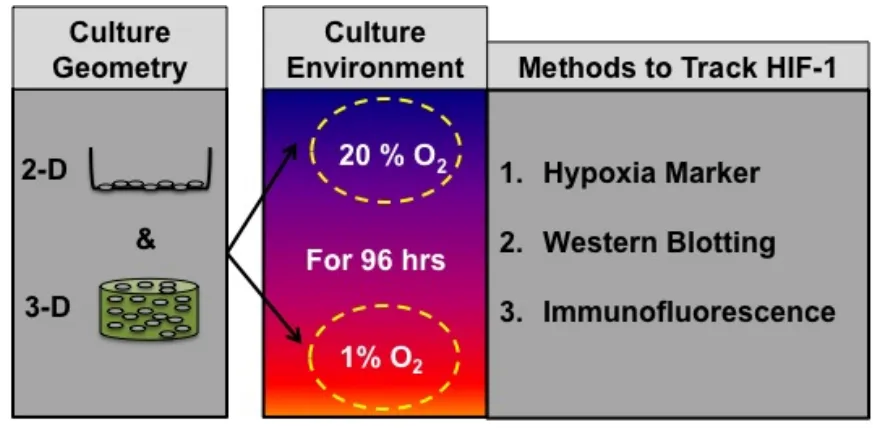
Experimental Design 1: In order to test the hypoxia detection, adipose-derived stem cells
(ASCs) are used, cultured in two-dimensional (2D) and 3D culture conditions and
exposed to 20% or 1% oxygen environments for 96 h. The marker signal for HIF-1 is
tracked at time point’s 4hr, 8hr, 12hr, 24hr, 48hr, 72hr and 96hr. A parallel setup is
prepared to track and quantify HIF-1 through other commonly used techniques such as
Immunofluorescenceand western blotting.
OBJECTIVE 2: To examine the impact of hypoxia on osteogenesis of ASCs in both 2-D
and 3-D culture condition and determine if HIF-1 represents a potential therapeutic target
that would alter this effect.
Experimental Design 2: In order to examine the effect of hypoxia on osteogenesis, ASCs
are cultured in two-dimensional (2D) and 3D culture conditions and exposed to 20%, 2%
and 1% oxygen environments. 1% and 2% oxygen environments are modeled as the
implantation environment in the study. The cells are directed towards osteogenic lineage
using a differentiation media and processed for ALP activity (Days- 7, 14, 21, 28),
Mineralization (Days- 14, 28) and protein detection (Osteonectin and Osteopontin- Day
28). In order to examine the role of HIF-1 in the process of osteogenic differentiation, a
parallel setup is prepared with a HIF-1 inhibitor added to the osteogenic differentiation
media.
OBJECTIVE 3: To examine the impact of varied ischemic preconditioning (IPC) protocols
on ASCsphenotypic change, resistance to apoptosis and osteogenic differentiation.
Experimental Design 3: ASCs are cultured in 4%, 2% and 1% oxygen environments for
96 hours with and without the HIF-1 inhibitor. Every 24 hours, lysates are collected from
each oxygen condition to examine the pro-apoptotic markers (HIF-1, pAKT, Bcl-2) and
anti-apoptotic markers (Bax, active caspase-3). To examine the effect of hypoxia on
phenotypic change, samples are collected at 96 hours to run flow cytometry to examine
the presence stem cell antigen markers (CD 105, CD 45). To examine the effect of IPC
on osteogenesis, 2% oxygen environment is modeled as the implantation site. 3 different
IPC protocols are used step-up IPC (From 1% to 2%), standand IPC (from 2% to 2%) and
step-down IPC (4% to 2%). ALP activity, mineralization and protein expression of ON
and OPN are quantified to measure the degree of osteogenic differentiation.
CHAPTER 3
T
RACKINGH
YPOXICS
IGNALING INE
NCAPSULATEDS
TEMC
ELLS3.1 INTRODUCTION
Molecular oxygen serves as a metabolic substrate and signaling molecule
for cells both in vitro and in vivo. Stems cells reside in a range of different
microenvironments and the local oxygen concentration can help guide their
differentiation. Ma et al., point out that mammalian embryogenesis and development take
place at hypoxic conditions of 1.5-8% O2 and 2.3-5.2% O2, respectively [Ma 2009]. In
the literature, oxygen concentrations less than 5% have been described as hypoxic
conditions [Ren 2006, Fehrer 2007, Ma 2009]. Hypoxia can create a potentially lethal
environment and limit cellular respiration and growth or, alternatively, enhance the
production of specific extracellular matrix components and increase angiogenesis
[Semenza 2000]. A hypoxic environment plays a substantial and critical role in many
essential physiological and developmental pathways. It has been linked to maintenance,
proliferation, survival and differentiation of various types of stem cells and influences the
lineage commitment of multipotent cells [Malda 2007, Lin 2008, Ivanovic 2009,
Abdollahi 2011].
Cell response to reduced oxygen tension is primarily regulated by
hypoxia-inducible factors [Semenza 2002, Semenza 2010]. HIFs are transcription factors
which belong to the bHLH-PAS (basic Helix-Loop-Helix-PER-ARNT-SIM) family.
(aryl hydrocarbon receptor nuclear translocator) is stable regardless of local oxygen
tension, whereas, HIF-1α is only stable under hypoxic conditions. Under normoxia (high
oxygen conditions), HIF-1α is rapidly degraded due to hydroxylation, which promotes
ubiquitination and subsequent proteosomal degradation [Jiang 1996, Semenza 1998,
Semenza 2002, Semenza 2010]. The amount of HIF-1α increases exponentially in cells
as oxygen levels drop from 6% O2 [Jiang 1996]. HIF-1 regulates transcription of genes
which contain HREs in their promoters, introns and/or 3’ enhancers. HIF-1 interacts with
HREs leading to transcription of oxygen-regulated genes like VEGF, erythropoietin,
iNOS, and glycolytic enzymes that enhance cellular adaptation to hypoxia [Sharp 2004,
Hwang 2008, Wang 2007]. This oxygen-sensitive regulation of transcription allows cells
to adapt to changing oxygen tensions or to survive in physiological environments where
the oxygen level is always in the hypoxic range. It has been estimated that 5% or more of
our genes are regulated by HIF-1. VEGF, basic fibroblast growth factor (bFGF),
angiopoietin 2 (Ang-2) and platelet-derived growth factor (PDGF) are examples of
angiogenic molecules whose expression is increased by HIF-1 activity [Forsythe 1996,
Kelly 2003, Ceradin 2004, Manalo 2005, Simon 2008]. Hypoxia and HIF-1 are also
implicated in the recruitment of circulating angiogenic cells, critical in vascular
remodeling [Asahara 1999, Grant 2002, Kinnaird 2004, Kinnaird 2004]. Given the
interest in driving vascularization of tissue engineering constructs, HIF-1 activity is an
important event to monitor for cells in these scaffolds.
Most in vitro cell culture studies are conducted at atmospheric oxygen
levels of approximately 20%, which far exceed the physiological levels. Since oxygen
behavior of stem cells, it is important to account for it while interpreting experiments
[Moore and Lemischka 2006]. The effect of oxygen on adipose-derived stem cells
(ASCs) has been explored in a number of recent studies [Wang 2005, Lee 2006, Bhang
2011]. ASCs are multipotent, mesenchymal stem cells which can be isolated through
lipoaspiration. ASCs have been used to differentiate into chondrogenic, osteogenic,
endothelial, cardiomyogenic, myogenic, adipogenic and potentially neurogenic
phenotypes with HIF-1 activity affecting many of these pathways [Zuk 2001, Wang
2005, Fraser 2006, Lee 2006, Schaffler 2007, Bunnell 2008, Bhang 2011, Liu 2011].
The design of a tissue engineering scaffold can also impact local oxygen
levels for cells within the material. Hydrogels are an attractive choice as a scaffold
material because their high water content facilitates transport of nutrients and waste
products to and from the encapsulated cells. Poly(ethylene glycol) (PEG) hydrogels are
broadly-utilized in the field of tissue engineering and can be easily functionalized to
create custom microenvironments for encapsulated cells [Lin-Gibson 2004, Nuttelman
2004, Ford 2006, Hwang 2006, Benoit 2007, Buxton 2007, Salinas 2007, Stosich 2007,
Weber 2008]. Oxygen supply to cells in 3-D constructs is more complex than in 2-D
cultures as it is influenced by the chemistry of the scaffold material(s), scaffold
dimensions, local oxygen tension, cell type, cell density as well as by the mechanisms of
transport, i.e., diffusion or convection. Studies in 3-D culture revealed that the oxygen
concentration decreases from the periphery toward the center of the scaffolds, which
correlates with cell density and cell viability [Volkmer 2008, Radisic 2006]. The oxygen
concentrations in the media and inside the scaffolds have been measured using
2002, Malda 2004, Cochran 2006, Revsbech 1983, Krihak 1996, Acosta 2009].
Mathematical modeling approaches have been developed accounting for scaffold
geometry and local oxygen tension to predict oxygen gradients inside the scaffolds
[Sengers 2007]. These techniques to measure or predict oxygen concentration offer a
great deal of information to the tissue engineering community. However, it is also
important to know how cells react to their local oxygen concentration to predict changes
in phenotype.
Because of the importance of how cells respond to the local oxygen and
the role of HIF-1 in stem cell behavior, we developed a responsive, fluorescent hypoxia
marker based on a recombinant adenovirus [Skiles 2011]. The sequence of a red
fluorescent protein (Ds Red DR) was placed under the control of a minimal promoter and
HRE trimer. This virus is referred to as HRE Ds Red DR. Expression of the fluorescent
protein should match the expression of other HIF-1-regulated genes. HIF-1 regulates
expression of anti-apoptotic genes and secretion of numerous angiogenic factors. A
system to track the onset of these events will assist tissue engineering efforts using a
range of scaffold materials and culture in many different oxygen conditions. A number of
techniques exist to measure the amount of HIF-1α in cells but many require that the cells
be lysed or fixed. HIF-1 activity does not always correlate with the amount of HIF-1
protein or mRNA which compromises techniques measuring such quantities that seek to
predict expression of HIF-regulated genes.
The objective of this study was to evaluate a responsive, fluorescent,
hypoxia detection system and determine if HIF activity can be tracked at a cellular level
engineering strategies and the influence of HIF signaling on ASC phenotype. The
experiments outlined below were designed to examine the relationship between culture
conditions and hypoxic signaling. A mechanism to continuously monitor HIF activity in
encapsulated cells is a useful tool for the tissue engineering community.
3.2 MATERIALS AND METHODS
3.2.1 Cell culture
Human ASCs isolated from human lipoaspirate tissue were purchased
from Invitrogen at passage 1. Cells were cultured in proprietary MesenPRO RSTM basal
medium supplemented with MesenPRO RSTM Growth Supplement, 1%
penicillin/streptomycin (Mediatech, Manassas, VA) and 2 mM L-glutamine (MP
Biomedicals, Irvine, CA, USA). Culture conditions for passaging were maintained at
95% air and 5% CO2 at 37°C. For experiments, cells between passages 2 and 5 were used
as recommended by the supplier.
3.2.2 Oxygen-controlled culture
Nitrogen-purged, programmable incubators were used to maintain
constant oxygen levels for cellular studies (Napco Series 8000 WJ, Thermo Electron).
Normoxic oxygen studies were maintained at 5% CO2 and 20% oxygen and hypoxic
studies were maintained at 5% CO2 and 1% oxygen conditions. For 1% oxygen
experiments, all media, buffered salt solutions, and fixatives to be used with cells were
kept in vented tubes in the hypoxic incubator for 24 hours prior to use so as to equilibrate
lab have shown this period to be sufficient to equilibrate the dissolved oxygen
concentration [Skiles 2011]. All cell manipulation (media changes and imaging) was
performed as quickly as possible to minimize exposure to atmospheric air. These
procedures were kept under 10 minutes per day. Studies using a dissolved oxygen sensor
tracked the change in dissolved oxygen levels in the media during this time and found
that levels only increased from 0.3 mg/L (concentration equilibrated in 1% oxygen
incubator) to 0.4 mg/L after 10 minutes outside of the incubator. The concentration had
returned to 0.3 mg/L within 10 minutes of placement back in the incubator.
3.2.3 Infection of ASCs and tracking hypoxic signaling
The preparation of the virus was briefly described earlier and is detailed in
previously published studies [Skiles 2011]. As observed in those previous studies, the
virus exhibited 100% infection efficiency with ASCs. For marker studies, ASCs were
seeded into a 12-well tissue culture treated plate with the HRE DsRed DR virus at a
multiplicity of infection of 25. The plates were incubated overnight in static culture at
20% O2 for the cells to attach to the surface and for the infection to take place. Both 2-D
and 3-D samples were fluorescently imaged periodically over 96 hours using a Nikon
Eclipse Ti microscope (Nikon, Tokyo, Japan) and the Nikon NIS-Elements imaging
software with consistent exposure times and fluorescent lamp intensities. Multiple images
(3-4 images for 2-D samples and 5-6 images for 3-D samples) from three independent
3.2.4 Cell encapsulation for 3-D experiments
Poly(ethylene glycol) with an average molecular weight of 10,000 Da
(Sigma-Aldrich, St. Louis, MO) was functionalized by addition of methacrylate end
groups resulting in poly(ethylene glycol) dimethacrylate (PEGDM). ASCs were
trypsinized, counted using a hemocytometer and spun down in a microcentrifuge tube
prior to removal of the media. Cells were then re-suspended in a solution of 10 wt%
PEGDM and 0.025 wt%
2-hydoxy-1-[4-(2-hydroxyethoxy)-phenyl-2-methyl-1-propanone (Irgacure 2959) (Ciba, Tarrytown, NY) which is a photoinitiator in Hank’s
balanced salt solution (HBSS) (Mediatech Inc, Manassas, VA). Each gel in these studies
was designed to contain 400,000 dispersed ASCs so enough cells were added to the
PEGDM to create a concentration of 10,000 cells/µl. After re-suspension of the cells, 40
µl of the PEGDM suspension was added to a 1 ml syringe and exposed to a 365 nm light
source at an intensity of 7 mW cm−2 for 10 min under sterile conditions. The resulting
gels are cylindrical discs measuring 5 mm in diameter and 2 mm in height. The gels were
transferred to a 24 well plate, washed in HBSS and placed in 1.5 ml of media. The plates
were cultured in the varied oxygen conditions on orbital shakers set to continuous
rotation at 100 rpm. This encapsulation procedure has been shown previously to not have
an adverse impact on viability for a range of cell types [Benoit 2007, Weber 2008].
3.2.5 Protein extraction and western blotting for HIF-1α
Total cell lysates were collected from the 2-D and 3-D samples with RIPA
lysis buffer (Thermo Scientific, Rockford, IL) containing a protease and phosphatase
sonicated for 15 min. The mixtures were then centrifuged at 14,000 rpm at 4°C for 15
min. The supernatants were collected and protein concentration was quantified using a
Coomassie Plus Bradford Assay kit (Thermo Scientific, Rockford, IL) according to the
manufacturers’ instructions.
Western blotting was performed by SDS-PAGE with 50 µg of protein
lysate loaded per lane of 4-20% gradient gels followed by transfer to PVDF membranes
(Millipore, Billerica, MA). The membrane was first incubated in 5% dry milk, 1% bovine
serum albumin (BSA) diluted in HBSS for 1 h at room temperature. The membrane was
then washed twice for 10 min each in “wash 1” (0.1% Tween-20, 0.1% dry milk, 0.1%
BSA in HBSS). The membrane was then incubated with rabbit anti-HIF-1α antibody
(1:1000) (Santa Cruz Biotechnology, Santa Cruz, CA) and rabbit anti-b-actin antibody
(1:1000) (Santa Cruz Biotechnology, Santa Cruz, CA) for 2 h at room temperature (RT).
The membrane was then washed three times for 10 min each in “wash 1”. Membranes
were then incubated with peroxidase-conjugated, goat, anti-rabbit IgG (1:5000)
(Rockland Immunochemicals, Gilbertsville, PA) for 2 h at RT. Membranes were then
washed 3 times for 10 minutes each in “wash 2” (0.1% Tween-20 in HBSS). Protein
detection was achieved by 5 min incubation in a chemiluminescence reagent, SuperSignal
West Pico Substrate (Thermo Scientific, Rockford, IL). Bands were then detected using
ChemiDoc™ XRS+ System with Image Lab™ image acquisition and analysis software
(Bio-Rad, Hercules. CA). With densitometry analysis, the expression of proteins was
normalized to β-actin to account for % IOD (intensity optical density) fold difference of
shaker set to continuous rotation at 100 rpm. The statistics shown represent results
obtained from three independent studies.
3.2.6 Immunostaining for HIF-1 activity
100,000 ASCs were plated in flat-bottom 96-well plates for 2-D
experiments. The previously described, ASC-containing PEG gels were used for 3-D
experiments. The samples were maintained in 1% and 20% O2 for a period of 96 hours.
To prepare the cells for staining, samples were fixed after 24h, 48h, 72h and 96h with 4%
paraformaldehyde (Thermo Fisher, Waltham, MA) on ice for 30 min and washed twice
with HBSS. Staining was performed every 24 hours during the 4 day period. Cells were
permeabilized with 0.1% Triton X (EMD Chemicals, Gibbstown, NJ) for 30 min and then
washed successively in 5% bovine serum albumin (EMD) and 5% normal donkey serum
(EMD) for 1 h each. An overnight incubation at 4°C with polyclonal rabbit antibody to
HIF-1α (1: 1000) (Santa Cruz Biotechnology, Santa Cruz, CA) was followed by two, 15
min washes in 1% BSA and a 1 h incubation in 5% normal donkey serum. A
fluorescently-labeled, goat, anti-rabbit secondary antibody (1:1000) (Rockland
Immunochemicals, Gilbertsville, PA) was added for an hour followed by final washes in
1% BSA in HBSS. Samples were fluorescently imaged with the instrumentation and
software previously mentioned. Multiple images (3-4 images for 2-D samples and 5-6
images for 3-D samples) from three independent samples were analyzed to quantify the
3.2.7 Viability of ASCs
Live/Dead® staining kit (Invitrogen) was used to test the viability of the samples.
Fluorescent dyes indicate esterase activity (observed as green signal in live cells) or loss
of nuclear membrane integrity (observed as red signal in dead cells). The 2-D and 3-D
samples were in culture conditions similar to the previous experiments and the staining
was performed in accordance with the manufacturer’s guidelines. Results are given as a
percentage of viable cells based on analysis of three independent studies.
3.2.8 Statistical analysis
Statistical analysis was performed using Graphpad Prism 4.01 (GraphPad
Software Inc., San Diego, CA). Experimental results were expressed as the mean ±
standard deviation. All the collected data were analyzed by two-way ANOVA for
comparisons and p-values < 0.05 were defined as statistically-significant differences.
3.3 RESULTS
3.3.1 HIF-1α immunostaining
The HIF-1α staining (green) was primarily focused in the cytoplasm of
ASCs. In 2-D at 20% O2, no staining was evident during the entire time course. A
representative image after 96 hours of culture is shown in figure 3.1A. In 1% O2, no
signal was observed at 24 and 48 hours. 56±3% and 61±4% cells stained positive for
HIF-1α at 72 and 96 hours respectively. Representative images are shown in figure 3.1 (B
and C). In 3-D, no signal was observed at 24 and 48 hours at both 1% and 20% O2. In 1%
positive respectively. The representative image at 96 hours in 1% O2 is shown in figure
3.1 (D1, D2 (overlay image)). Immunostaining was also observed at 20% O2 in 3-D, with
9±2% and 11±3% cells stained positive for HIF-1α at 72 and 96 hours respectively as in
shown in figure 3.1 (E1, E2 (overlay image)). These results are summarized in figure
3.1F.
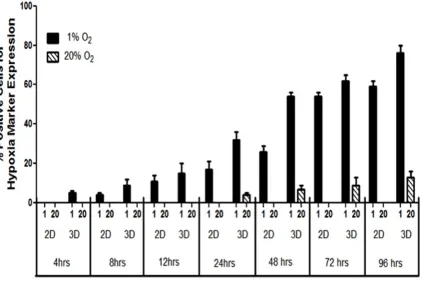
3.3.2 Hypoxia marker signaling
In 2-D at 20% O2, there was no marker signal throughout the study period
of 4 days. At 1% O2, the onset of the signal was seen at 8 hours with 4±1% cells showing
positive red fluorescence signal for HIF-1α activation. Signal progression increased with
11±3%, 17±4%, 26±3%, 54±2% and 59±3% of cells showing positive marker signal at
12, 24, 48, 72 and 96 hours respectively. A representative image for each time point is
shown in Figure 3.2 (A1-A6). In 3-D at 1% O2, we observed the onset of the marker
signal at 4 hours with 5±1% cells expressing positive signal. The prevalence of the signal
increased over time with 9±3%, 15±5%, 32±4%, 54±2%, 62±4% and 76±3% cells
expressing positive marker signal at 8, 12, 24, 48, 72 and 96 hours respectively.
Representative images for each time point are shown in Figure 3.2 (B1-B7). Marker
signal was also observed in 3-D at 20% O2. The onset of the signal was at 24 hours with
4±2% cells showing positive marker signal. The prevalence of the signal increased over
time with 7±2%, 9±4% and 13±3% cells expressing positive marker signal at 48, 72 and
96 hours respectively (Figure 3.2: C1-C4). The above results are summarized in Figure
Figure 3.3: Quantification of cells positive for marker signal. The graph quantifies the percent positive cells expressing hypoxia marker signal in 2D and 3D conditions in both 1% and 20% O2 conditions.
3.3.3 Quantification of HIF-1α protein
Western blotting was performed to quantify the amount of HIF-1α protein
expressed in 2-D and 3-D culture conditions under 1% and 20% O2. Figure 3.4A shows
bands for HIF-1α protein in 1% O2 in both 2-D and 3-D culture conditions.
Quantification of these results using %IOD measurements and normalizing HIF-1α
expression with β-actin expression showed an increase in HIF-1α expression over time.
In 3-D at 1% O2, we saw a %IOD fold difference of 6.01±0.42, 10.31±0.34, 11.31±0.453
and 11.39±0.31 at 24, 48, 72 and 96 hours respectively. In 2-D at 1% O2, we observed a
%IOD fold difference of 1.31±0.21, 2.52±0.34, 6.78±0.23 and 7.11±0.36 at 24, 48, 72
O2 in both 2-D and 3-D. In 2-D, we observed no expression of HIF-1α throughout the
study period. In 3-D the expression pattern was 0.61±0.246, 3.32±0.283, 3.98±0.183 and
4.01±0.15 %IOD fold difference at 24, 48, 72 and 96 hours respectively. The above
results are summarized in Figure 3.4C.
Figure 3.4: Western blot for HIF-1α and β-actin. Results are shown for ASCs cultured in 1% O2 (A) and 20% O2 (B). These results are quantified in (C).
3.3.4 ASC viability
Viability of ASCs in 2-D and 3-D culture at both 1% and 20% O2 was
observed every 24 hours for the time period of 4 days. In 2-D at 20% O2, the % viability
was 99±0.2%, 98±0.6%, 98±0.4% and 98±0.3%, at 24, 48, 72 and 96 hours respectively.
At 1% O2 incubation the % viability was observed at 99±0.4%, 99±.02%, 98±0.5% and
98±0.3% at 24, 48, 72 and 96 hours respectively. For 3-D cultures in 20% O2, 99±0.4,
99±0.3, 98±0.6 and 97±0.4 % viability was observed at 24, 48, 72 and 96 hours
respectively. Finally, for 3-D cultures in 1% O2, 99±0.2, 98±0.4, 97±0.3, 97±0.4 % cell
3.4 DISCUSSION
Immunostaining results in 2-D at 20% O2 did not show any staining for
HIF-1α at any of the time points, which correlates with our marker. At 1% O2, signal
was only observed at 72 and 96 hours which also correlated well with our marker.
Interestingly in 3-D, we observed immunostaining and hypoxia marker signal (Figure
3.2: C1-C4) in both 1% and 20% O2. The results in 20% oxygen show the impact of the
PEG material on oxygen diffusion. The immunostaining in 3-D did not correlate as well
with our marker, as a lower percentage of cells stained positive for HIF-1α (Figure 3.1F
and Figure 3.3) than displayed the fluorescent marker signal under the same conditions.
The discrepancy could be due to limited diffusion of the primary and
secondary antibodies through the scaffold. Crosslinked PEG hydrogels formed from
macromers of mol. wt. 10kDa exhibit a mesh size of 7.78nm [Lin 2011]. The
hydrodynamic radius of our antibodies should be below this size but the pore size is
heterogeneous and diffusion may have been impeded. Limitations in protein diffusion
were not observed in our western blotting experiments. The protein quantity yield of
400,000 cells lysed in 2-D culture was equivalent to that obtained when lysates were
collected from gels containing 400,000 cells following 3-D culture. Quantification of
HIF-1α by western blot displayed higher intensity bands in 3-D than 2-D at 1% O2 at
each of the time points (Figure 3.4A). At 20% O2, there were no bands for HIF-1α in 2-D
at any time points. Some HIF-1α was detected in 3-D cultures (Figure 3.4B). Figure 4C
shows the % IOD fold difference in HIF-1α protein expression. Detection of HIF-1α by
immunocytochemistry should not produce significantly different results from detection
correlation within the scaffold highlights the utility of the HRE Ds Red DR marker as it
did not exhibit the same issues and matched the trend seen with the western blot results.
The cellular response to HIF-1 is not homogeneous across cell types, with
degree of stabilization and upregulated target genes varying between and within tissues
[Bracken 2006, Lendahl 2009]. In this respect, the amount of HIF-1α does not necessarily
correlate with HIF-1 activity. If this was occurring with our ASCs, a difference would be
expected between the signal from the marker and both methods used to detect HIF-1α
quantity instead of just 3-D immunocytochemical results.
Extended exposure to hypoxia can affect the viability of cells. Our results
showed that more than 95 percent of cells were viable at 1% O2 in both 2-D and 3-D
through 4 days of culture, suggesting that the low oxygen environment triggered HIF-1
activity but not a large drop in viability. This could be explained by the low metabolic
activity of ASCs and that stabilization of HIF-1α protects cells against necrosis helping
them to survive under acute or chronic hypoxia [Ginouves 2008].
As stated in the introduction, our goal was to establish whether the HRE
Ds Red DR marker virus could be used to track HIF-1 activity in encapsulated ASCs and
whether expression of the red fluorescent protein correlated with HIF-1α detected by
traditional methods. The marker measures HIF activity rather than the amount of HIF-1α
protein as measured with western blotting and immunocytochemical detection. A lag
was expected between the stabilization of the transcription factor and expression of the
fluorescent protein but it proved to be brief as the fluorescent signal was observed as
early as 4 hr after exposure to hypoxic conditions. Our results show that detection of the
allow the observed signal to correlate with HIF-1α levels. These image capture
conditions did not lead to background signal in cells when no HIF-1α was detected by
other methods. We can monitor HIF activity in the same population of cells over time and
this can be done in a 3-D culture environment without disruption of the scaffold.
The majority of cell culture studies have been performed on 2-D surfaces
such as tissue culture plates/flasks because of the ease, convenience, and high cell
viability of 2-D culture. These traditional 2-D cultures cannot be used to faithfully mimic
the microenvironment of the particular tissue of interest. The combination of
three-dimensional scaffolds and living cells is used to fill defect sites and support the
transplanted cells. The material(s) selected for the scaffold and how it is synthesized
influence the diffusion of oxygen and nutrients to the cells and this is a major limitation
in tissue engineering [Volkmer 2008]. Gradients of oxygen concentration can form within
materials and this will affect cellular differentiation or cell fate decisions [Malladi 2006,
Grayson 2007, Mohyeldin 2010]. This marker system was developed to identify hypoxic
signaling within these environments and to track this response at a cellular level without
the need to disrupt the integrity of the scaffold or cells.
It is clear from previous studies that oxygen concentration and the cell
response to the local oxygen tension are important parameters to track when devising
novel, stem cell-based therapeutic systems. Our marker does not measure the oxygen
concentration, but more importantly helps in the identification of a cellular response at
low oxygen conditions. Several techniques have been applied to measure the spatial
distribution of oxygen within tissues using blood-gas analyzers, dissolved oxygen probes
2007, Acosta 2009]. These systems offer high levels of sensitivity and specificity, but do
not show how the cells respond to their local oxygen environment. The marker system
described here can complement such techniques and offers great potential as a tool to
track biological responses in tissue engineering studies.
Studies have shown that there may be a strong dependence of cellular
metabolic activity and oxygen consumption rate on the scaffolding material and
geometry, presumably due to altered cell-material interactions in the scaffold [Cukierman
2002, Malda 2004]. Therefore in the future, it would be interesting to evaluate the effect
on the prevalence and onset of the marker signal within different scaffold materials for a
range of cell densities. Due to the link between local oxygen levels and cell behavior,
these gradients can cause heterogeneous differentiation of cells within tissue engineering
scaffolds if steps are not taken to address the creation of these gradients. Future studies
will take advantage of the versatility of our responsive hypoxia marker to show dynamic
correlations between cell fate and function with oxygen concentration in engineered
tissues in two-dimensional as well as three-dimensional environments.