Mapping of Solar Resource based on INSAT 3D/3DR Surface Insolation product
Arun S. Suryavanshi1, Alok Taori1,2, A.O. Varghese1, and Biswadip Gharai2
1. Regional Remote Sensing Center-Central, NRSC, Nagpur, Maharashtra- 440023, India
2. National Remote Sensing Centre (NRSC), Hyderabad, Telangana- 500 037, India
Abstract :-
Solar Insolation is the major contributor of earth’s radiation and energy budget. The insolation reaching the surface is a prime input for eco-physiological processes such as evapotranspiration and photosynthesis. Therefore, it is as critical component to assess bio-energy and bio-fuel resources. It is also a crucial input to crop simulation model for yield forecasting and its further applications in solar energy solutions. Although ground observations are better for accuracy purpose, they have challenges of maintenance, regular calibration and upkeeping etc. This call for the continuous spatio-temporal satellite based observations barring the acceptable accuracy. In case of INSAT3D/3DR, Bhattacharya et al. (2015) have derived the surface insolation product which is being used widely. We propose a method of improvement in this product. It is envisaged that a correction applied with the help of ground truth estimates may enhance the utilization of insolation products derived from INSAT3D/3DR datasets. In the present study, surface insolation product derived from INSAT 3D/3DR data at an interval of 30 minutes each (collectively 15 minutes interval) with 4 km spatial resolution was used for duration from May-2017 to Apr-2019 over Nagpur. Ground truth observations for same duration were carried out with CNR4, which were used to correct the INSAT 3D/3DR surface insolation product using the statistical best-fit method. Corrected INSAT 3D/3DR products are found correlating with the ground values well with differences of approximately < 1 W/m2. Best-fit parameters evolved in the present study uses only 2 years of simultaneous ground and satellite data which can be further improved by multi-year data base. We propose better utilization of INSAT 3D/3DR based surface insolation products in the assessment of solar resource mapping over Nagpur (and possibly other regions, such as Bhandara) with the help of best-fit parameters as assessed in the present study.
Keywords: INSAT 3D, INSAT 3DR, Surface insolation, Solar resource
1
1. Introduction
Sunlight is the source of life on earth and its energy is the driving force behind the occurrence of oceanic and atmospheric circulation patterns. The climate variables such as temperature, humidity, pressure, rainfall etc depends upon solar radiation. Solar energy ranges between 0.15 to 120 micrometers and maximum contributed wavelengths are between 0.15 to 4.0 µm consisting the ultraviolet region (0.15 to 0.38), visible region (0.38 to 0.72 which is seen by human) and infrared region (0.72 to 4.0) of the solar spectrum. The amount of solar radiation flux or irradiance in the shortwave (0.3 – 3 micrometer) reaching at ground surface is known as surface insolation. Solar Insolation is the major contributor of earth’s radiation and energy budget. Surface insolation is a prime input for eco-physiological processes such as evapotranspiration and photosynthesis. Therefore, it is as critical component to assess bio-energy and bio-fuel resources. It is also a crucial input to crop simulation model for yield forecasting
and its further applications in solar energy solutions such as solar panel installation etc.
Satellite observations started in the year 1960s with first artificial satellite Sputnik. Broadly there are two types of satellites viz polar satellite and geo-synchronous satellite. Orbit height and onboard sensor decides its applications. Geo-synchronous satellites are synchronized with earth rotation; hence they capture earth and its atmosphere near continuously. Off late, satellite-based measurements have become indispensible in myriad applications areas due to its ability of continues observations of earth and atmosphere (George, 2005). As the ground-based measurements require setup, maintenance and regular sensor calibration and scaling arising due to weather related degrading, satellite measurements offer a cost-effective solution with much desired consistency to cater the regular applications (Boluwaji et. Al. 2016). In this regard, off late, onboard sensors have made the measurement of solar radiation above and on earth in the form irradiance possible for various applications.
Evolution of satellite-based sensors and measurements related to solar radiation was started in early years of 1960s with Television Infrared Observation Satellite (TIROS) mission. Subsequently National Oceanic and Atmospheric Administration (NOAA), Geostationary Operational Environmental Satellites (GOES) and Meteosat missions came up in 1970s. Whereas, Indian National Satellite System (INSAT) and Moderate Resolution Imaging Spectroradiometer (MODIS) missions came during 1990s-2000s (Alonso et. Al., 2014). Various approaches came into existence for solar radiation estimation using either visible or infrared data in 1980s. The Indian National Satellite (INSAT) series started the operation of monitoring weather since 1990s (
Rafiqul, 1994)
. INSAT 3D/3DR missions in 2013 and 2016 are recent development in Indian satellite programs which are capable to deliver various geophysical parameters including surface insolation. INSAT 3D was launched in July, 2013 with an imaging system to fulfill the requirement of geosynchronous mission which was followed by mission of INSAT 3DR in September 2016. VHRR sensor on INSAT 3D/3DR satellite are equipped with six channel imager with spectral bands, viz Visible, SWIR, MIR, TIR1, TIR2 & WV and produces imageries at 30 minutes interval, which in turn is used to generate surface Insolation geophysical product with 4 kms spatial resolution (Bhattacharya et. al.,2013, Vyas et. al., 2016) Collectively both satellite missions are able to deliver data products at 15
minutes interval. INSAT 3D/3DR missions data capture timings are programmed so that we have data product for every 15 minutes interval.
2
scattering, absorption, and reflection. Therefore, it is possible to design methods and algorithms to infer surface solar irradiance from the radiance received by the satellites’ onboard instruments. The first algorithms were developed in the 1980s. These methods have significantly evolved since then and have reached a high degree of maturity and accuracy due to robust radiometric calibration in terms of spectral and geographical representation (polo et. al., 2019).
In general, two approaches, viz., (a) statistical or empirical (Tarpley et.al.,1979, Noia et. al. 1993) and (b) physical or radiative transfer (Tanahash et. al., 2001) schemes are in use to estimate surface insolation using geostationary satellite data having broad visible band and thermal infrared bands.
INSAT mission data processing uses physical model to arrive at surface insolation with two conditions,
clear sky and cloudy sky. The algorithm uses a clear-sky model with spectrally integrated radiative transfer scheme that requires solar zenith angle, elevation, slope, aspect of terrain, aerosol, water vapour and ozone as inputs. While in cloudy-sky model, a separate three-layer scheme was implemented where cloud is assumed to be a plane parallel body sandwiched between upper and
lower cloudless atmospheric layers (Bhattacharya et. al., 2013, 2015)
Every solar energy project requires an accurate and consistent knowledge of the local solar resource. The ground based instrument, namely CNR4 imply the wavelength range between 0.305 to 2.80 μm with field of view of 180°. The measurements made in ideal condition have confidence level upto 95% and produces data at 15 minutes interval (CNR4 manual, 2017). Although ground observations are better for accuracy purpose, they have challenges of maintenance, failures, regular calibration and upkeeping. Although the number and geographical density of ground-based solar radiation sensors are increasing, they can only supply the needed solar resource information in a handful of locations. Limitation of point specific measurement can overcome by synoptic view capture by satellite data. In consequence, most of the projects may rely on solar irradiance time series simulated from satellite imagery. Satellite-derived information can be processed into many forms useful to the solar community, including solar radiation maps, typical meteorological (or representative) years, long-term characterization, and solar plant performance simulations.
Energy resources arising from all forms of fuels are used in the modern world, either for heating, generation of electrical energy, or in other forms of energy by conversion processes. Worldwide pattern of energy consumption shows that 90% energy being consumed is from fossil fuel-based resource such as natural gas, oil, coal etc. Whereas 8-10 % is share for renewable energy resources such as Solar, Wind, Hydro, Geothermal etc. (world energy resources report, 2016, Clerici et. al., 2015) As the fossil fuel keeps depleting with time, and that they pollute the environment leading to climate and air quality degradation, we may not have alternate option other than using renewable energy resources in order to meet the energy requirement in near future. Solar resource is direct usable form of energy available to us freely and it is a clean energy resource.
Indian subcontinent between 60 N to 280 N latitude experiences plentiful sunlight. Hence, we can take a
3
km scale through application of the SUNY satellite to irradiance model with dataset spanning 2002-2008 (P
erez et. al., 2002).
A better validation is possible with the use of simultaneous (same time duration) ground dataset and satellite derived product so that satellite based datasets can be corrected with good approximation.
2. Study area
As a testing phase and the prime objective, Nagpur district, Maharashtra state of India was chosen as study area. Nagpur district is a mix of rural and urban settlements and also having diverse land-use / land covers such as dense forest, scrub forest, agriculture, fallow etc. RRSC-C/NRSC, Nagpur location (21.150 N 79.030 E) is also having ground measurement site with four component compact net
radiometer (CNR4) for solar radiation measurement as a part of the NICES program of NRSC. This site is being used as a representative for entire district in this study work.
Fig. 01. Study Area of Nagpur region where ground truth measurement is also available.
3. Methodology
3.1 Datasets:
4 3.2 Methodology:
The ground based measurement is used as the ground truth and has a role of validation and correction of INSAT 3D/3DR data. A statistical best-fit method is applied here with non-linear regression model. Regression is a technique used to model and analyze the relationships between variables. Regression techniques consist of finding a mathematical relationship between measurements of two variables, y
and x, such that the value of variable y can be predicted from a measurement of the other variable, x (Chatterjee et. al. 2012). In this case input variables are satellite based measurement and in-situ measurement of insolation. Line of best fit is an output of regression analysis which is a quantitative measure of the relationship between one or more independent variables and a resulting dependent variable. This is represented by following equation:-
y= c + mx + nx2 ………(1)
Where, y is satellite data values, x is in-situ observed values and m, n & c are dependent variables i.e. slope and intercept
Relation between INSAT 3D/ 3DR derived solar insolation data (x-axis) against the CNR4 data (y-axis) is shown in Figure 02.
Fig.02 Plot indicating a linear relation between INSAT 3D/3DR and CNR4 data values
5
is found to be 0.85. Therefore, we use first order fit to explain the data and thus a linear regression model is utilized. Below mentioned flow chart depicts procedure of solar resource mapping.
Fig.03 Flow chart exhibiting the suggested method to improve the solar resource maps. AOI means area of interest.
6
4. Results and discussion
4.1 Best fit parameters
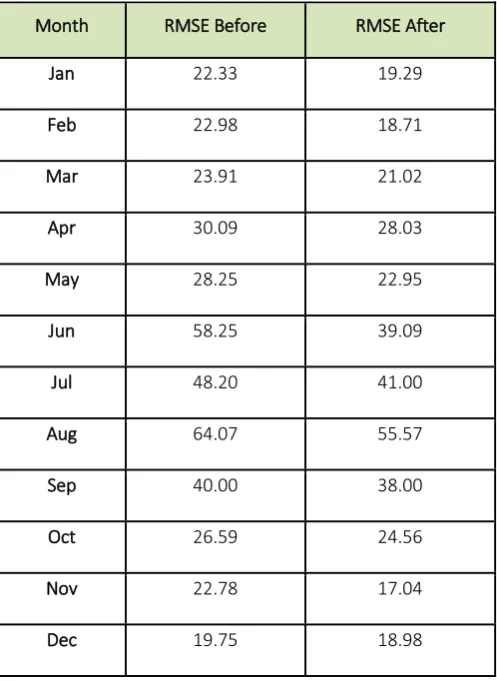
Based on the equation (1) we noted that correlation coefficient for each month shows that satellite measurement and in-situ measurement are in agreement with each other with strong positive correlation. This implies that simple regression model can be applied to arrive at correction parameters as noted in earlier section. Thus, statistical best fit method was implied for each month separately using daywise dataset pertaining to that month. Two sets of day wise average data for each month belonging to May-2017 toApr-2019 were made available for correlation purpose
Month RMSE Before RMSE After
Jan 22.33 19.29
Feb 22.98 18.71
Mar 23.91 21.02
Apr 30.09 28.03
May 28.25 22.95
Jun 58.25 39.09
Jul 48.20 41.00
Aug 64.07 55.57
Sep 40.00 38.00
Oct 26.59 24.56
Nov 22.78 17.04
Dec 19.75 18.98
7
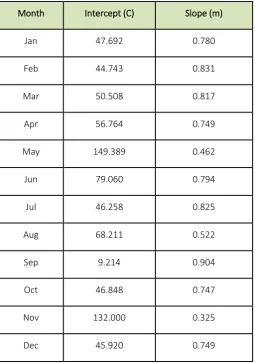
Mean RMSE stands to be ±28 W/m2 on monthly basis (refer table 1) and first order fit parameters i.e.
slope and intercept obtained for each month are listed in table 2.
Month Intercept (C) Slope (m)
Jan 47.692 0.780
Feb 44.743 0.831
Mar 50.508 0.817
Apr 56.764 0.749
May 149.389 0.462
Jun 79.060 0.794
Jul 46.258 0.825
Aug 68.211 0.522
Sep 9.214 0.904
Oct 46.848 0.747
Nov 132.000 0.325
Dec 45.920 0.749
Table 02. Correction parameters (month wise)
4.2 Correction of INSAT 3D/3DR surface Insolation
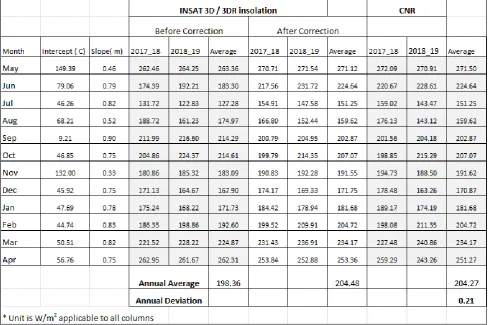
Monthly mean insolation values were obtained from INSAT 3D/3DR surface insolation product for duration May-2017 to April-2019 and corrected using obtained parameters listed in table 02. Simultaneously monthly mean insolation was obtained using CNR4 dataset. Surface insulation is observed different year-to-year and month-to-month. Corrected monthly mean values found to agree with ground based measured values with max deviation of ±10 W/m2 on monthly scale. Whereas annual
scale deviation for full two years dataset found to be 0.21 W/m2 (refer table 3). Therefore this method
8
Table 03. Correction of monthly mean insolation and deviation (May2017 to April 2019)
4.4 Estimation of solar resource and Map generation
Corrected monthly mean insolation for each month was used to estimate yearly solar resource potential over Nagpur district. Monthly mean insolation values averaged for April 2017 - April 2019 duration are shown in fig 04. We note that the mean insolation is varying from minimum 3.6 kWh/m2/day (July/August) to maximum of 6.5 kWh/m2/day (April /May). It is also noted that surface insolation averaged for all season was 4.99, 5.01, 4.94 and 4.93 kWh/m2/dayfor year 2015, 2016, 2017, 2018 respectively (refer to table04). Subsequently, four years dataset was used to generate average solar resource for four years duration. Average estimated solar resource over Nagpur district was 4.97
9
Fig.04 Variability in the monthly mean insolation
Fig.05 Solar Resource Map of Nagpur district
4.5 Consistency Evaluation
10
Fig.06 Solar Resource Map of Bhandara district
Following table gives comparison of Surface insolation between Nagpur and Bhandara districts (Maharashtra). As Bhandara district is in adjacent and locates in higher latitudes than Nagpur district, estimated solar resource found to be in agreement and comparatively more than Nagpur district.
Y
Yeeaarr
I
Innssoollaattiioonn((kkWWhh//mm22//ddaayy))
N
Naaggppuurr BBhhaannddaarraa
2
2001155 44..9999 55..1133
2
2001166 55..0011 55..11
2
2001177 44..9944 55..0011
2
2001188 44..9933 55
A
Avveerraaggee 44..9977 55..0066
11
5. Conclusion:
The INSAT 3D/3DR based surface insolation was described by Bhattacharya et al. (2013) and Vyas et al. (2016). We suggest here a method of further improvement of the product. The product improved is found to agree with ground observation data from four component compact net radiometer (CNR4) after applying linear fit method with deviation of <1 W/m2 at annual scale. Hence solar resource
mapping could be done for Nagpur district, Maharashtra state. The best fit parameters derived using correlation can be further improved by incorporation of 5-6 consequent years of ground observation data inputs, whereas solar resource mapping accuracy will be enhanced by incorporation of decadal input of satellite data. Moreover, this will be a step towards solar resource mapping using indigenous data product. Hence this can provide an input to National Solar Mission (NSM) launched by Govt. of India.
Acknowledgements
We are sincerely thankful to MOSDAC,SAC, Ahmedabad for making data available geophysical product of surface insolation. Authors thank GM, RRSC-Central, CGM- RCs and Director, NRSC for their
12 References:
Alonso Suárez, R., G. Abal, P. Musé, R. Siri, Satellite-derived solar irradiation map for Uruguay, 2013,
ISES Solar World Congress, Energy Procedia, 57, 2014, 1237 – 1246.
Bhattacharya, Bimal K., N. Padmanabhan, Sazid Mahammed, R. Ramakrishnan and J. S. Parihar, Assessing solar energy potential over Indian landmass using diurnal remote sensing observations from Kalpana-1 satellite, 2013, Int. J. of Remote Sensing, 34, 20, 7069-7090, doi: 10.1080/01431161.2013.811311.
Bhattacharya, B. K., et. al., INSAT-3D product algorithm theoretical basis document, 2015, ATBD Document, 335-360. [https://mosdac.gov.in/data/doc/INSAT_3D_ATBD_MAY_2015.pdf]
Boluwaji M. Olomiyesan and Onyedi D. Oyedum, Comparative Study of Ground Measured Satellite-Derived, and Estimated Global Solar Radiation Data in Nigeria, 2016, Journal of Solar Energy, 2016, doi:10.1155/2016/8197389.
Chatterjee, S., Jeffrey S. Simonoff, Handbook of Regression Analysis, 2012, doi:10.1002/9781118532843.
Clerici, A., G. Alimonti, World energy resources, EPJ Web of Conferences, 2015, 98, DOI: 10.1051/epjconf 20159801001.
Joseph George, Fundamental of Remote Sensing, 2005, University Press, ISBN:10: 9788173715358
Linnet, K. Evaluation of regression procedures for methods comparison studies, 1993, Clinical Chemistry, 39, 424-424.
Noia, M., Ratto, C., and Festa, R., Solar irradiance estimation from geostationary satellite data: 1.Statistical models, 1993a, Solar Energy, 51, 449–456.
Noia, M., Ratto, C., and Festa, R., 1993b. Solar irradiance estimation from geostationary satellite data: 2.Physical models, 1993b, Solar Energy, 51, 457–465.
Polo, Jesus, Richard Perez, Solar Radiation Modeling from Satellite Imagery: Fundamentals and Applications, in chapter Green Energy and Technology, 2019, Solar Resources Mapping, Jan, 183-197, DOI: 10.1007/978-3-319-97484-2_6.
Rafiqul Islam, Md., Evolution of methods for Solar Radiation Mapping using Satellite Data, 1994, RERIC International Energy Journal; Vol 16, No. 2, 103-113.
Richard Perez, Ineichen, Pierre, Moore, Kathleen, Kmiecik, M., Chain, C., George, Rejomon, and Vignola, Frank, A new operational satellite-to-irradiance model, 2002, Sol. Energy. 73, 5, 307 - 317.
Tanahashi, S, Kawamura, H, Matsuura, T, Takahashi, T and Yusa, H., A system to distribute satellite incident solar radiation in real-time, 2001, Remote Sensing of Environment. 75. 412-422, doi: 10.1016/S0034-4257(00)00183-8.
Tarpley, J. D., Estimating Incident Solar Radiation at the Surface from Geostationary Satellite Data, 1979,
13