J. Range Manage. 45:391-395, July 1992
Declining forage availability effects on utiliza-
tion and community selection by cattle
MICHAEL A. SMITH, J. DANIEL RODGERS, JERROLD L. DODD, AND QUENTIN D. SKINNER
Authors are associate professors, and professor, respectively, Range Management Department, university of Wyoming. Laramie 82071.
Abstract
Land managers of salt desert shrub and sagebrush steppe vegeta- tion have concerns regarding appropriate stoclring rates in summer for ephemeral stream riparian zones because of elevated levels of use on woody vegetation. We determined utilization levels of for- age species over time as a fixed animal density decreased available forage as a means of approximating the stocking rate suitable for an area and identifying plant species for monitoring. Trend in abundance of important plant species will ultimately determine appropriate stocking rate in a particular management situation.
Forage utilization by cattle during mid-summer for 2 successive years was measured weekly for 3 weeks in streamside (channel and floodplain) and adjacent upland (terrace and saline upland) vege- tation communities along the ephemeral stream. Measures were also made of crude protein and dry matter content of plant species. Plant communities used by cattle were also recorded.
Utilization of streamside and terrace vegetation declined markedly over the 3 weeks, while utilization of forage in saline uplands was lower than in other areas and did not decline over weeks of study. More cattle selected streamside and terrace areas with the most succulent forages than saline uplands with less succulent forages. Woody plants in channel areas, cottonwood (Pop&s deltoides Bartr. ex Marsh.) particularly, were higher in protein, more succu- lent, and more severely grazed than other species. Management of cottonwood probably limits the stocking rate used in these com- munities. Declines in weekly utilization of forages after the first week indicated intake may have been declining. If so, lower levels of utilization may be needed to maintain animal performance. Maintenance of cottonwoods and animal performance considera- tions may dictate a lower stocking rate than achieved in this midsummer study.
Key Words: stocking rate, cottonwood, Populus deltoides, forage quality, riparian zones
Land managers and livestock producers of northcentral Wyom- ing have been concerned about appropriate cattle stocking rates for maintaining woody vegetation along ephemeral drainages. Woody vegetation constitutes the major element of structural diversity and wildlife habitat. The current emphasis on grazing impacts and management of riparian zones (Platts 1979, Roath and Krueger 1982, Kauffman and Krueger 1984) suggests manag- ers ensure that these areas will eventually be improved to an acceptable condition even though ephemeral channel geomorphic processes such as downcutting may not be responsive to vegetation grazing management (Bryan 1925). Research is needed to deter-
Published as journal article JA 1629 of the Wyoming Agricultural Experiment Station
- .- .._...
This work was supported by Wyoming Department of Environmental Quality, Wyoming Water Research Center and Bureau of Land Management.
Manuscript accepted 9 Dec. I99 I.
JOURNAL OF RANGE MANAGEMENT 45(4), July 1992
mine proper stocking rates and grazing systems to reach and maintain improved conditions.
The objective of this study was to determine utilization levels for herbaceous and woody forage species and percent of cattle using each plant community as forage was depleted in an improved ephemeral drainage consisting of 3 plant communities. Forage depletion was achieved in each pasture by maintaining a constant density of cattle over time. Woody vegetation, the species of great- est concern to local managers, was of higher quality relative to other species during this season. Allotment managers often make decisions to move grazing animals by adjusting length of grazing period rather than changing animal numbers. Our null hypotheses were that forage disappearance (utilization) percent would be the same for all species, that frequency of cattle using plant communi- ties would be equal to proportions of communities in the pastures, and utilization of species and proportions of cattle selecting each plant community would not change as time progressed and forage was depleted.
Materials and Methods
Study pastures were located on the North Fork of 15Mile Creek, a large ephemeral drainage in the Bighorn Basin of north- central Wyoming. The Bighorn Basin has an average annual pre- cipitation between 125 and 225 mm with the majority of precipita- tion in late May and early June. Summer thunderstorms are major contributors to flow events in the drainage. Precipitation was about average each year of the study.
The entire area, a BLM allotment, is used for cattle (75% of authorized use) and sheep grazing. Most sheep use occurs in winter and spring. Both cow/ calf and yearling cattle are grazed, primarily in spring or summer-fall.
The research facility on the North Fork tributary is located near the confluence with the main channel. This low gradient area was selected about 30 years earlier for installation of erosion control structures including 3 detention reservoirs and an extensive terrace system to spread floodwaters and trap sediments. The area of structural improvements was fenced and introduced grasses planted within the terrace system. Crested wheatgrass (Agropyron crista- turn (L.) Gaertn.) is the principal seeded species remaining within the terrace system. Many native herbaceous and woody species are more abundant along the stream channel inside than outside the pastures possibly due to increases in the last 30 years. Cottonwood (Populus deltoides Bartr. ex Marsh.) and occasional willows (S&x spp.) dominate areas in and near where standing water is retained following flooding, primarily in reservoirs and terraces. Deterioration of terraces has reduced the extent of many species dependent on periodic flooding. Understory of unflooded wooded and of overflow areas is characterized by several wheatgrasses (Elymus spp.), wildryes (Elymus spp.), foxtail barley (Hordeum jubatum L.) and slimleaf and scurfpea (Psorulea tenuiJloru Pursh).
Channels between detention reservoirs are shallow and well- vegetated compared to other tributaries on the 15-Mile Creek drainage that have not been protected from grazing and have no structural improvements. The fenced area has a more desirable vegetation composition than ephemeral water courses outside the pastures.
The research facility consists of an exlosure of approximately 148 ha that was sub-divided into two 74-ha pastures with S-wire electric fencing. A common water source serviced livestock in both pastures. Plant communities were designated as saline upland, seeded terrace, floodplain, and channel habitats, For all vegetation sampling, the channel and floodplain were combined as a single plant community because of their vegetative similarity. For cattle distribution measurements, channel and floodplain communities were evaluated separately due to the physiographic differences between them. Major saline upland species were prickly pear ( Opuntiu polyacuntha Haw.), Indian ricegrass (Oryzopsis hyme- noides (R. and S.) Ricker ex Piper), bottlebrush squirreltail (Ely- mus elymoides (Raf.) Swezey), sand dropseed (Sporobolus cryp- tandrus (Torrey) Gray), bud sagewort (Artemisiu spinescens Eaton), and Gardner saltbush (Atriplex gurdneri (Moq.) Dietr.). Major species on seeded terraces were introduced wheatgrasses, mostly crested wheatgrass, (Agropyron spp.), foxtail barley, and willow. Major floodplain species were cottonwood, big sagebrush (Artemisia tridentata Nutt. var. tridentata), rubber rabbitbrush (Chrysothamnus nauseosus (Pallas ex Pursh) Britt.), wheatgrasses, and foxtail barley. In the channel, major species were inland salt- grass (Distichlis stricta (Torrey Rydb.), wildryes (Elymus spp.), slimleaf scurfpea, cottonwood, and willow.
Experimental Design and Sampling
Cattle (0.1 AUM/ ha/ year) were grazed in 2 replicate pastures during 2 grazing seasons. In each year, 10 cow/calf pairs were kept in each pasture for 3 weeks (last week in July to mid-August).
Utilization
Forage disappearance was determined by repeatedly (weekly) estimating dry weight standing crop of individually marked plants or of twigs of shrubs and trees of each species having potential
forage value. Two transects of 30 to 100-m length were established prior to grazing in each plant community in each pasture: channel/ - floodplain, seeded terraces, and saline upland. Willow was very limited and found only where standing or shallow subsurface water was present. Each transect where cottonwood or willow occurred contained 20-50 marked plants with 50-125 total marked twigs while each transect in herbaceous and/or low shrub vegetation contained 20-50 marked individuals of each species. Marked twigs of tall willow and cottonwood were within 2 m of the ground. Percent forage disappearance was calculated by dividing the weekly amount of forage disappearance (difference between per plant or twig dry weight biomass estimated at weekly intervals) by initial pregrazing biomass. The sum of weekly utilization was the total for the species for the 3 weeks. No plant growth occurred during the period based on measured absence of change in ungrazed plant biomass. Training consisted of repeatedly estimat- ing off-transect or plant weights, harvesting, and weighing until estimates were within 10% of harvested weight.
Forage Quality
Randomly selected samples of current annual growth from each species were taken at the beginning and end of weekly trials, field weighed, and oven-dried (50’ C) to determine the proportion of dry matter (succulence). Crude protein of these samples was obtained by the Kjeldahl method (AOAC 1970).
Standing Crop Biomass
Annual standing crop biomass of herbaceous plants in all com- munities plus low shrubs in saline upland was determined within treatment pastures in July each year by a double sampling (harvest I/ 3 of quadrats and estimation of weight on all; adjust estimated weights with regression relationship between estimate and harv- ested weights) technique using 0.5-m* quadrats in summer. The sampling was conducted on permanent transects within each plant community. Sampling was intensive enough to determine the standing crop of the dominant species within the combined chan- nel and floodplain and major forage classes within the terrace and upland within 10% of mean values (p_v). 1). Reported data are sums of sampled forage classes.
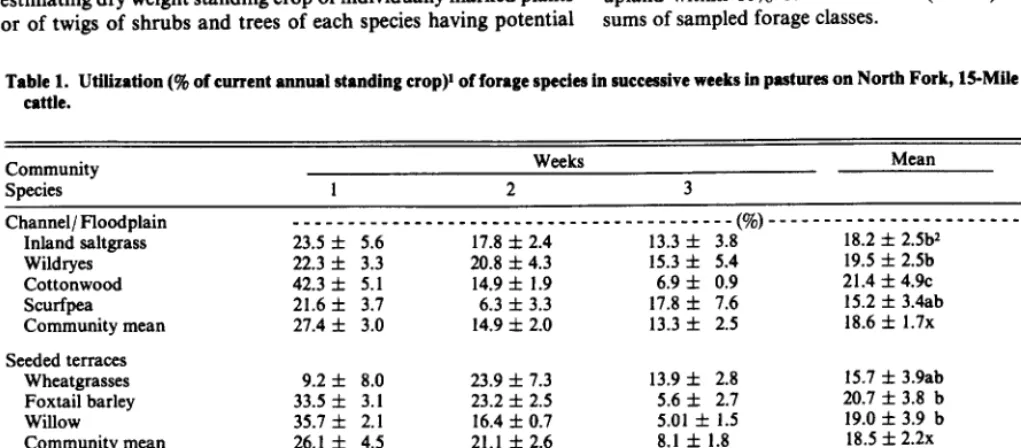
Table 1. Utilization (9% of current annual standing crop)’ of forage species in successive weeks in pastures on North Fork, H-Mile Creek in summer by cattle.
Community Species
Channel/ Floodplain Inland saltgrass Wildryes Cottonwood Scurfpea Community mean
Seeded terraces Wheatgrasses Foxtail barley Willow
Community mean
Saline upland Indian ricegrass Bottlebrush squirreltail Sand dropseed Bud sagewort Gardner saltbush Community mean
All Community Mean
Weeks Mean
1 2 3 Seasonal Use
____________________-__---- _____________(%)____________________________________
23.5 f 5.6 17.8 f 2.4 13.3 f 3.8 18.2 f 2.5b2 55
22.3 f 3.3 29.8 f 4.3 15.3 f 5.4 19.5 f 2.5b 59
42.3 f 5.1 14.9 f 1.9 6.9 f 0.9 21.4 f 4.9~ 64
21.6 f 3.7 6.3 rt 3.3 17.8 f 7.6 15.2 f 3.4ab 46
27.4 f 3.0 14.9 f 2.0 13.3 f 2.5 18.6 f 1.7x 56
9.2 f 8.0 23.9 f 7.3 13.9 f 2.8 15.7 f 3.9ab 47
33.5 f 3.1 23.2 f 2.5 5.6 f 2.7 20.7 f 3.8 b 62
35.7 f 2.1 16.4 f 0.7 5.01 f 1.5 19.0 f 3.9 b 57
26.1 f 4.5 21.1 f 2.6 8.1 f 1.8 18.5 f 2.2x 56
19.7 f 6.1 13.4 f 3.7 10.2 f 6.8 14.4 f 3.2ab 43
25.7 f 22.9 .4 f .4 8.7 f 5.0 11.6 f 7.8ab 35
26.1 f 1.1 18.6 f 8.5 22.4 f 17.9 22.3 f 5.3~ 67
4.1 f 1.7 3.4 f 2.9 13.0 f 5.8 6.8 f 2.4ab 20
5.3 f 2.2 9.4 f 4.0 17.0 f 3.8 10.5 f 2.3a 32
15.1 f 5.3 8.0 f 2.0 13.3 f 2.8 12.1 f 2.1y 36
22.2 f 2.7a 13.8 f 1.5b 12.0 f 1.5b
‘Mean f standard error of mean
communities %Ieans for each species across weeks (mean column) and for weeks (bottom row) followed by the same letter (a,b, or c) wen not different @>0.05). Means for
across weeks (mean column) followed by the same letter (x or y) were different @>O.OS).
Selection of Plant Communities by Cattle
Observations were made of selection for 2 days weekly in each pasture during the grazing trial. All animals within each pasture were observed at 0.5- 1 .O hour intervals during daylight hours and summarized as percent observed in each plant community over 4 daily time segments (0600-0900,090 1 - 1200,120 1 - 1500,150 1 - 1800) by weeks.
Statistical Analysis
Project design was a randomized block. Pastures were blocks and weeks within pastures within years served as experimental units. Analysis of variance (AOV) with repeated measures (years) was used to test effects and interactions of independent variables, block, years, weeks, plant species, and plant communities (not included in the same analysis when plant species was a variable). Dependent variables were plant species disappearance, dry matter content, and crude protein content. Analyzed data for plant species characteristics were arithmetic averages without weighting for spe- cies biomass because sampling was not adequate for reliable esti- mates of weighting for individual species. Trees and large shrubs were not sampled for biomass. Percent of cattle using plant com- munities was tested for differences between blocks, years, and among weeks by AOV. Scheffe’s Multiple Comparison Test (Montgomery 1984) was used to separate significantly different means. T-tests were used to determine if there was a difference between percent of cattle found in a plant community and percent of the community in both pastures. Significance was assumed at SO.05 in all tests.
Results and Discussion
Year and block effects were not significant for any dependent variable. Significant differences within other main effects and the few significant interactions are discussed below.
Forage Disappearance (Utilization)
Mean utilization of forages within communities was lowest for saline upland (Table 1). Total utilization was 56% for both chan- nel/floodplain and seeded terrace communities over the 3 weeks of
grazing at 0.1 AUM/ ha stocking rate. Cumulative utilization levels (Table 1) for individual species when summed over the 3 weeks ranged between 20% and 67% with the 2 extremes occdrring in saline uplands. Cottonwoods and willows, important for maintain- ing habitat structural diversity, received 64% and 57% use, respec- tively, over the 3-week period. Utilization of grasses, the major forage resource, varied from 35% to 67%. Shrubs in saline uplands were least utilized, 20% to 32%.
Utilization levels of individual forage species (Table 1) generally declined over weeks as did overall and community means as for- ages were depleted in initially preferred communities. However, some species did not follow this trend (significant species X week interaction). The exceptions among species were wheatgrasses in seeded terraces, with highest use in week 2; and bottlebrush squir- reltail, sand dropseed, bud sagewort, and Gardner saltbush in saline uplands with highest use in week 3 (Table 1). The exception among communities to the general decline in utilization over weeks (significant community X week interaction) was an increase in mean use of forages in saline upland in week 3 from a lower level in week 2. These interactions are illustrated in Table 1 where overall weekly means decline while means for the species and communities indicated do not.
Utilization levels on specific forage species may indicate poten- tial changes in community species composition (Davis 1982), influ- ence watershed and streambank protection values (Branson et al. 1981, Shumm and Meyer 1979), and affect the ability of grazing animals to consume sufficient forage for adequate performance. Cumulative utilization of forages within each community over the 3 weeks (36 to 56%) was generally less than levels causing concern for long-term system health in most grazed ecosystems. However, higher levels reached on some species, notably cottonwood, require additional attention. Cottonwood provides the major ele- ment of vegetation structural diversity in the area. The 64% use occurred on twigs and sprouts of large trees within reach of cattle. This use occurred in addition to wildlife grazing (that we were unable to measure) before and probably after the study period. Use prunes the bottom of larger trees and terminal buds of seedlings and sprouts. Seedlings and sprouts must be able to grow beyond
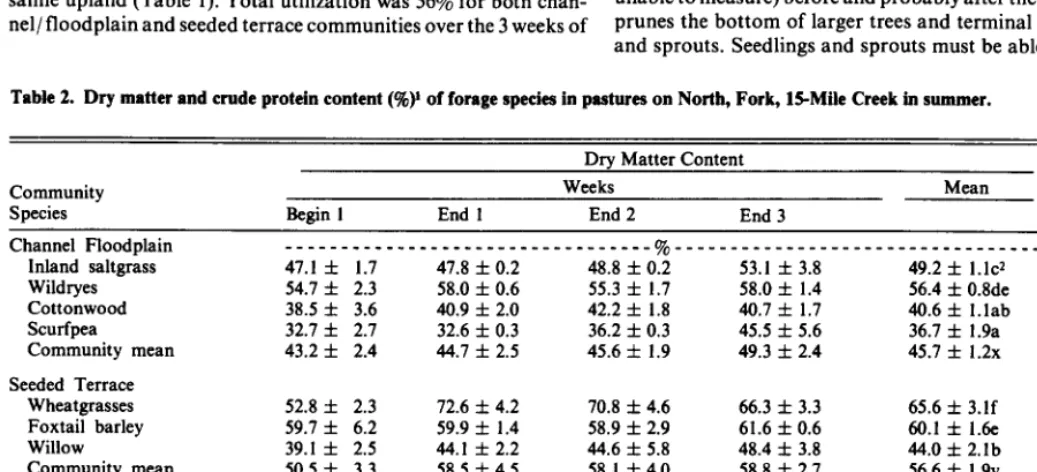
Table 2. Dry matter and crude protein content (%)I of forage species in pastures on North, Fork, H-Mile Creek in summer.
Community
Species Begin I End 1
Dry Matter Content Weeks
End 2 End 3
Mean
Protein
Channel Floodplain __________________________-______%--__________________________________ (%) Inland saltgrass 47.1 f 1.7 47.8 f 0.2 48.8 f 0.2 53.1 f 3.8 49.2 f 1.1~2 5.4 f 0. la Wildryes 54.7 f 2.3 58.0 f 0.6 55.3 f 1.7 58.0 f 1.4 56.4 f 0.8de 5.1 f 0.3a Cottonwood 38.5 f 3.6 40.9 f 2.0 42.2 f 1.8 40.7 f 1.7 40.6 f l.lab 12.3 f 0.5e Scurfpea 32.7 f 2.7 32.6 f 0.3 36.2 f 0.3 45.5 f 5.6 36.7 f 1.9a 10.9 f 0.4d Community mean 43.2 f 2.4 44.7 f 2.5 45.6 f 1.9 49.3 f 2.4 45.7 f 1.2x 8.4 f 0.6x Seeded Terrace
Wheatgrasses Foxtail barley Willow
Community mean
52.8 f 2.3 72.6 f 4.2 70.8 f 4.6 66.3 f 3.3 65.6 f 3.lf 6.8 f 0.6c 59.7 f 6.2 59.9 f 1.4 58.9 f 2.9 61.6 f 0.6 60.1 f 1.6e 5.7 f 0.2ab 39.1 f 2.5 44.1 f 2.2 44.6 f 5.8 48.4 f 3.8 44.0 f 2.lb 7.7 f 0.2bc 50.5 f 3.3 58.5 f 4.5 58.1 f 4.0 58.8 f 2.7 56.6 f 1.9y 6.7 f 0.3x Saline Upland
Indian ricegrass Bottlebrush squirreltail Sand dropseed Bud sagewort Gardner saltbush Community mean All Communities Mean
70.9 f 3.8 73.7 f 1.4 83.9 f 3.4 76.6 f 0.1 76.3 f 1.7g 5.7 f 0. lab 86.0 f 3.7 88.2 f 2.1 91.0 f 2.7 90.7 f 0.6 88.9 f 1.3h 7.0 f 0.2bc 44.5 f 12.6 58.0 f 6.2 54.6 f 1.0 49.8 f 7.6 51.7 f 3.6cd 8.1 f 1.1~ 70.7 f 2.3 75.1 f 0.1 79.2 f 2.5 76.8 f 1.0 75.4 f l.lg 7.0 f 0.3c 56.5 f 0.9 50.2 f 1.5 49.6 f 3.7 54.7 f 2.7 52.7 f 1.3cd 11.8 f 0.5de 68.0 f 3.5 70.2 f 3.4 73.5 f 4.1 71.9 f 3.6 70.9 f 1.82 7.9 f 0.4x 54.6 f 2.2a 58.7 f 2.6ab 60.6 f 2.8b 60.6 f 2.3b
‘Mean f standard error
2Means for each species across weeks (2 right columns) and weeks (dry matter, bottom row) followed by the same letter (a-h) were not different (DO.05). Means for communities across weeks (in 2 right columns) followed by the same letter (x, y, or z) were not different (FPO.05).
Table 3. Pecent ($)a of cattle observed in plant communitia and percent of communities in pastures on North Fork, H-Mile Creek in summer. Average
forage standing crop, dry matter content, and end of grazing period utilization are appended for comparison.
Habitat
Week 1 % cattle Week 2
% cattle
Week 3 % cattle All Weeks % cattle
Channel
6.7. f 0.7a2 22.5. f 2.5b
11.8* f 2.9a
13.7* f 2.3
Flood plain
69.9* f 2.7~ 48.9* f 0.7b
25.2* f 2.Oa
47.9. f 5.6
Seeded Terrace
2.6+ f 0.4a 14.1* f 3.4b
36.8* f 5.01~
17.8* f 4.5
Saline Upland
20.9* f 3.0ab 14.5* f l.la
23.2* f 2.8b
19.5* f 1.6
% Habitat in pastures 2.2 15.2 0.6 82.0
Mean
Standing Crop kg/ha 382’ 730 150
Mean forage
Dry matter % 45.73 56.6 70.9
End of period
Utilization % 55.83 55.5 36.3
*The proportions of cattle observed in habitats were different (PSO.OS, n q 16,2 pastures X 2 years X 4 daily time segments) from proportions expected with random distribution of cattle over habitats.
‘Mean xt standard error.
*Weekly means for % cattle observed (columns) followed by the same letter were not significantly different (DO.05). ‘Channel and floodplain sites combined
grazing animal’s reach in order to replace older trees. Close moni- toring of utilization levels and subsequent growth and survival is warranted. Cottonwood was quickly consumed by cattle as evi- denced by 42% utilization in the first week of grazing alone. Like- wise, in seeded terraces, willows received the majority of their use in Week 1 (36%) and 57% use over the 3 weeks.
Utilization declines in channel/floodplain and seeded terrace after Week 1 were not compensated for by an increased use in saline uplands, probably due to low productivity of these upland sites. The declines in utilization of forages after Week 1 indicate that removal of even 26-27% of available forage in an ecosystem of relatively low productive potential may limit further acceptability of these forages for cattle. Changes in structure and availability of forages due to use have been shown to prevent grazing animals from maintaining intake levels (Chacon and Stobbs 1976). Until forage becomes limiting, animals compensate for declining forage with increases in bite rate or bite size. The weekly changes in utilization strongly suggest that cattle intake may have become limited as early as week 2. Therefore, grazing capacity of this system may be limited more by animal performance considerations (directly related to intake) than plant maintenance unless the use of cottonwood and willow limited regeneration. In short, the level of use on cottonwood in 1 week and general sharp drop in utilization thereafter suggests that if cattle performance is a main concern, moving cattle to other areas after 1 week may be appropriate if they did not move on their own to areas with better forages.
Forage Quality
tion events accumulated in the seeded terraces and channel areas of the study pastures in both years of the study. Water accumulation areas, channel/floodplain and seeded terraces, had more succulent forages than saline uplands and received higher utilization. Cot- tonwood and willow, both dependent on ample subsurface soil moisture, and scurfpea were the most succulent forage species (Table 2). Significant interaction of species and weeks suggest that wheatgrasses and a few other species in seeded terraces became more succulent in week 3 following precipitation although they were still less succulent than other species in the community.
Standing Crop
Current annual standing crop (Table 3) of herbaceous and low shrub vegetation was roughly 382 kg/ ha for channel/floodplain, 730 kg/ ha for seeded terraces, and 150 kg/ ha for saline upland, with saline uplands having relatively high variation between years, coinciding with precipitation variation. Runoff water provided a relatively constant moisture regime for communities other than uplands, thus causing relatively constant forage supplies in the 2 years. The more productive communities received the highest utili- zation of forages.
Habitat Selection
Crude protein and succulence appeared to have had minimal influence on utilization levels of forage species other than cotton- wood. Channel/floodplains and terraces had both higher utiliza- tion and more succulent forages than uplands. Crude protein content for forages (Table 2) did not change over the weeks of study. Mean crude protein of forages among communities indi- cated similar levels in each. Grasses generally had the lowest crude protein of all forage classes, ranging from 5.1% to 8.1% (Table 2). Cottonwood had the highest crude protein content (12.3%) of all species, suggesting a positive relationship with utilization.
Cattle distribution among communities was not random (Table 3) and changed among weeks. Cattle preferentially selected chan- nel, flood plain and seeded terrace communities in all weeks. Saline upland, the largest community in the pastures was already used less frequently than it occurred. The majority of cattle use (79%) occurred in communities comprising only 18% of the study pastures.
Cattle selection of communities changed weekly although the general relationship or ranking of communities was unchanged until week 3 (Table 3) when use of seeded terrace increased greatly. Highest use of channels occurred in week 2. Use in the floodplain steadily declined over the 3 weeks. Cattle numbers in seeded terra- ces increased each week. Cattle use of saline uplands was lowest in week 2, highest in week 3 and intermediate in week 1.
A significant increase in dry matter occurred over the weeks of the study (Table 2) even though convective thunderstorms were common during the grazing period. Runoff water from precipita-
The high level of selection by cattle for the channel/floodplain communities in weeks 1 and 2 may reflect the higher forage availa- bility of this area and greater succulence of forages compared to terraces or saline upland. Over 34% of available forages were found in about 17% of the area, the channel/floodplains. Senft et al.
(1985) and Pinchak et al. (1991) also found greater selection by cattle of communities with higher quantities of forage. Seeded terraces, the most productive per unit area, were only 0.6% of the area and had forages of lower crude protein and lower succulence than channel/floodplains. Even though only a small fraction of total use occurred in this community, it was the most preferred, especially in weeks 2 and 3. Utilization of forages in channel/- floodplain and seeded terraces in Weeks 1 and 2 reduced available forage in these communities. This could have facilitated more selection by cattle (Table 3) and higher utilization (Table 1) in saline uplands in Week 3 and compared to Week 2.
In conclusion, selection of communities by cattle appeared large- ly related to forage abundance. The most frequently used commun- ities generally had higher utilization levels on plants. An apparent decline in forage intake by cattle in week 2 suggested grazing management based on meeting animal needs may be more perti- nent to this environment than management based on utilization levels. Heavier use on cottonwood and willow suggested these species could be a limiting factor during the summer season. Research is needed to determine the effects of utilization on estab- lishment and abundance of these species.
Literature Cited
AOAC. 1975. Official methods of analysis. 12th. Edition. Assoc. Official
Anal. Chem. Washington, D.C.
Branson, F.A., G.F. Gifford, KG. Rennard, and R.F. Hadley. 1981. Rangeland hydrology. Sot. Range Manage. Denver, Colo.
Bryan, K. 1925. Date of channel trenching (arroyo cutting), in the arid
Southwest. Science 12:328-334.
Chacon, E., and T.H. Stohbs. 1976. The influence of progressive defolia-
tion of a grass sward oneating behavior of cattle. Australian J. Agr. Res. 2 1:775-776.
Davis, J.W. 1982. Livestock vs. riparian habitat management-there are
solutions. p. 175-184. In: Peek, J. ed. Wildlife-Livestock Relationships Symp.: Proc. 10. Univ. of Idaho Forest, Wildl., and Range Exp. Sta., Moscow, Ida.
Kauffman, J.B., and W.C. Krueger. 1984. Livestock impacts on riparian
ecosystems and streamside management imp1ication.A review. J. Range Manage. 37:430-437.
Montgomery, D.C. 1984. Design and analysis of experiments, Second
edition. John Wiley and Sons, N.Y.
Pinchak, W.E., M.A. Smith, R.H. Hart, and J.W. Waggoner. 1991. Beef
cattle grazing distribution patterns on foothill range. J. Range Manage. 44~267-275.
Platts, W.S. 1979. Livestock grazing and riparian/stream ecosystems. p. 39-45. In: Proc. Forum-Grazing and Riparian Ecosystems. Trout Unlimited Inc.
Roath, L.R., and W.C. Krueger. 1982. Cattle grazing influence on a moun- tain riparian zone. J. Range Manage. 35:100-104.
Schumm, S.A., and D.G. Meyer. 1979. Morphology of alluvial rivers of the
Great Plains. p. 9-15. In: Riparian and Wetland Habitats of the Great Plains: Proc. 31st Annu. Meeting, Great Plains Agr. Count. Pub. 91.
Senft, R.L., L.R. Rittenhouse, and R.G. Woodmansee. 1985. Factors
influencing patterns of cattle grazing behavior on shortgrass steppe. J. Range Manage. 38:82-87.