ABSTRACT
YU, XIAO. Understanding and Debugging Complex Software Systems: A Data-Driven Per-spective. (Under the direction of Guoliang Jin.)
As the complexity of software systems has been growing rapidly over recent years, the
assurance of reliability and performance is facing more and more challenges. One notable
challenge lies in the understanding and debugging of complex systems that consist of
many interconnected and interdependent subsystems and components. Such internal
dependencies with the growing system scale create difficulties for both humans and tools.
This dissertation focuses on addressing this challenge by new techniques that build
var-ious models from runtime data generated by live systems. The resulting models provide
enhanced understanding for system development and management.
This dissertation presents three techniques that target at three different but common
types of systems: operating systems, cloud infrastructures, and request-based applications.
These systems are the major parts of a typical modern software stack. All the three
tech-niques are driven by runtime data that contain useful information for system understanding
and debugging, but they differ in analysis purposes and targeted problems.
One of these techniques shows how modeling and mining millions of stack traces can
help developers spot and diagnose performance problems in real-world Windows
installa-tions. This technique can greatly complement the existing testing techniques, which may
fail to capture problems that do not appear in the in-house environment. With real-world data, we show that many performance problems are created and amplified by dependencies
and interactions between kernel components.
In addition to mining offline data, it is equally important to detect failures and
per-formance problems in real time, especially for systems requiring high availability. So we
present CLOUDSEER, a technique that performs online monitoring and problem detection over unstructured, distributed, and interleaved logs generated by cloud infrastructures.
CLOUDSEERbuilds workflow models from existing logs, and uses such models to check live logs for potential execution problems in the form of structured workflow. Such workflow
information can facilitate the understanding and resolving of the reported problems. Finally, we present a technique called DATAFLOWTUNNELING for request-based ap-plications that rely on modern frameworks. These apap-plications face analysis challenges
meth-ods. DATAFLOWTUNNELINGinfers the hidden data-dependency specifications by a combi-nation of program analysis, tracing, and mining. By our customized tracing, we are able
to get useful runtime data that are not directly available to overcome analysis challenges.
The inferred specifications enable future work to implement inter-request analysis, which
works in the scope across request-handler methods. We expect inter-request analysis to
© Copyright 2018 by Xiao Yu
Understanding and Debugging Complex Software Systems: A Data-Driven Perspective
by Xiao Yu
A dissertation submitted to the Graduate Faculty of North Carolina State University
in partial fulfillment of the requirements for the Degree of
Doctor of Philosophy
Computer Science
Raleigh, North Carolina
2018
APPROVED BY:
Rainer Frank Mueller Xiaohui Gu
Xipeng Shen Guoliang Jin
BIOGRAPHY
Xiao Yu was born in Shanghai, China. He grew up with a strong interest in technologies,
leading him to become interested in computer programming. While studying for a
Bache-lor’s degree in Software Engineering at East China Normal University, he briefly worked
with Dr. Geguang Pu on a research project. This experience inspired and motivated Xiao to
pursue a career in research. In 2008, he started his graduate study under the direction of Dr.
Geguang Pu, and finally earned a Master’s degree in 2011.
During his graduate study at East China Normal University, Xiao was mainly working
on automated test generation. He participated in the development of CAUT, a tool using
dynamic symbolic execution to automatically generate test data for C programs, and
pub-lished multiple publications in improving effectiveness and efficiency of test generation.
In 2011, Xiao entered the Ph.D. program in Computer Science at North Carolina State
University. During his Ph.D. study, he interned at multiple industrial research laboratories,
including Microsoft Research Asia and NEC Laboratories America, to broaden his research
topics. These experiences stimulated his interest in data-driven techniques for
understand-ing and debuggunderstand-ing software reliability and performance problems, and formed the basis of this dissertation. Along this research direction, he developed novel ideas and techniques
to leverage logs and traces to enhance performance debugging, system monitoring, and
program analysis. He also published multiple publications in flagship conferences, and
was granted a U.S. patent.
To open his eyes to and get more involved in the research community, Xiao visited
the U.S. Food and Drug Administration and University of Illinois at Urbana-Champaign
during his Ph.D. study. In addition, he once served as a reviewer for the journal of Empirical
ACKNOWLEDGEMENTS
I would like to thank my advisor Dr. Guoliang Jin for his continuous and generous support
during my Ph.D. study. This dissertation would not be a success without his guidance and
the research freedom that he provided. I would also like to express my appreciation to my
previous advisor Dr. Tao Xie, who helped me build a solid foundation during early years of
my Ph.D. study. In addition to my two advisors, I would like to express my special thanks
to the two directors of graduate program: Dr. Douglas Reeves and Dr. George Rouskas for their strong support during my advisor transition.
I am very grateful to my internship mentors: Shi Han from Microsoft Research Asia, and
Dr. Pallavi Joshi, Dr. Jianwu Xu, and Dr. Hui Zhang from NEC Laboratories America. They
provided me valuable guidance and great experiences in industrial research. The real-world
research problems unveiled by them led to milestones in my Ph.D. study.
To my advisory committee members Dr. Rainer Frank Mueller, Dr. Xiaohui Gu, and Dr.
Xipeng Shen, I would like to thank them for their valuable feedback on this dissertation as
well as suggestions for my future research. And I would like to express my special thank to
Dr. Xiaohui Gu, who provided me a strong recommendation letter for my job hunting. Finally, I would like to acknowledge all my lab mates and co-workers for their support. I
cannot forget the memorable experience with Sihan Li and Wei Yang in the first three years
of our Ph.D. study. We took the same flight from Shanghai to Raleigh, and joined Dr. Tao
Xie’s research group together. Although our journey parted later, we still supported each
other in many ways. I would also like to thank Xusheng Xiao, who set a great example for
TABLE OF CONTENTS
LIST OF TABLES . . . vii
LIST OF FIGURES. . . viii
PUBLICATIONS . . . ix
Chapter 1 Introduction. . . 1
1.1 Overview of Proposed Techniques . . . 4
1.1.1 Understanding Performance Problems Related to Device Drivers . . 4
1.1.2 CLOUDSEER: Monitoring Cloud Infrastructures via Logs . . . 5
1.1.3 DATAFLOWTUNNELING: Mining Inter-request Data Dependencies for Request-based Applications . . . 6
1.2 Problem Dimensions . . . 7
1.3 Related Work . . . 9
1.4 Contributions . . . 9
Chapter 2 Comprehending Performance from Real-World Execution Traces: A Device-Driver Case . . . 11
2.1 Introduction . . . 11
2.2 Background and Motivating Examples . . . 14
2.2.1 Execution Traces . . . 14
2.2.2 A Real-World Case . . . 16
2.2.3 How Our Approach Facilitates Performance Analysis . . . 18
2.3 Impact Analysis . . . 19
2.3.1 Data Abstraction . . . 19
2.3.2 Impact Measurement . . . 20
2.4 Causality Analysis . . . 21
2.4.1 Data Abstraction and Pattern Representation . . . 22
2.4.2 Pattern Discovery . . . 24
2.5 Empirical Results and Evaluation on Device Drivers . . . 28
2.5.1 Results of Impact Analysis on Device Drivers . . . 28
2.5.2 Evaluation of Causality Analysis . . . 29
2.6 Related Work . . . 35
2.6.1 Performance Analysis . . . 35
2.6.2 Quality Assurance for Device Drivers . . . 37
Chapter 3 CLOUDSEER: Monitoring Cloud Infrastructures via Interleaved Logs . 38 3.1 Introduction . . . 38
3.2 Overview . . . 42
3.2.2 Logging Characteristics . . . 43
3.2.3 Demonstration of CloudSeer . . . 44
3.3 Modeling Task-Based Log Sequences . . . 47
3.3.1 Preprocessing . . . 47
3.3.2 Mining Temporal Dependencies . . . 48
3.3.3 Constructing Automata . . . 49
3.4 Checking Interleaved Log Sequences . . . 49
3.4.1 Basic Case: Individual Sequences . . . 50
3.4.2 Checking Interleaved Sequences . . . 52
3.4.3 Problem Detection . . . 54
3.5 Evaluation . . . 55
3.5.1 Test Bed . . . 56
3.5.2 Workload Generator . . . 57
3.5.3 Experiment Design . . . 57
3.5.4 Checking Accuracy . . . 59
3.5.5 Efficiency . . . 60
3.5.6 Capability of Problem Detection . . . 62
3.6 Related Work . . . 63
3.6.1 Mining Workflow Models from Logs . . . 64
3.6.2 Log Analysis for Distributed Systems . . . 64
3.6.3 Log-based Failure Diagnosis . . . 65
3.6.4 Distributed Tracing Frameworks . . . 65
Chapter 4 DATAFLOWTUNNELING: Mining Inter-request Data Dependencies for Request-based Applications . . . 66
4.1 Introduction . . . 66
4.2 Background and Motivation . . . 69
4.2.1 Background . . . 69
4.2.2 Motivating Example . . . 70
4.3 Dataflow Tunneling . . . 73
4.3.1 Identifying Input and Output Sites . . . 75
4.3.2 Instrumentation and Tracing . . . 76
4.3.3 Specification Mining . . . 80
4.4 Evaluation . . . 84
4.4.1 Subjects . . . 84
4.4.2 Experiment Design . . . 85
4.4.3 Specification Accuracy . . . 86
4.4.4 Tracing Overhead . . . 87
4.4.5 Characterization . . . 88
4.4.6 Application: Tuning Cache Policies . . . 89
4.5.1 Analysis of Web Applications . . . 91
4.5.2 Program Specification Mining and Its Applications . . . 91
4.5.3 Dynamic Taint Tracking . . . 92
Chapter 5 Conclusion and Future Work. . . 93
5.1 Future Work . . . 94
5.1.1 End-to-end Modeling of Cross-component Flows . . . 94
5.1.2 Reproducing Problematic System Behaviors . . . 95
5.1.3 Applications of Inter-request Analysis on Web Applications . . . 95
LIST OF TABLES
Table 1.1 Problem dimensions of the proposed techniques. . . 7
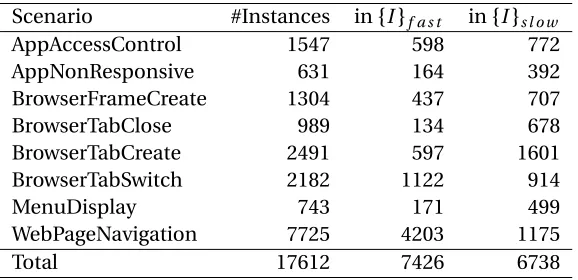
Table 2.1 Selected scenarios for the evaluation of causality analysis. . . 30
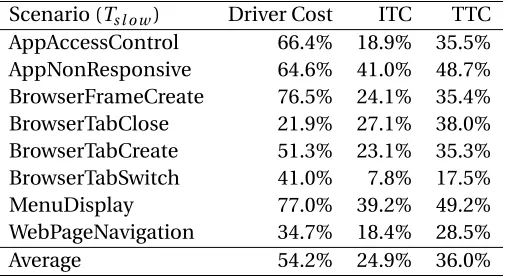
Table 2.2 Impactful-time and total-time coverages of discovered patterns on the total driver time. . . 31
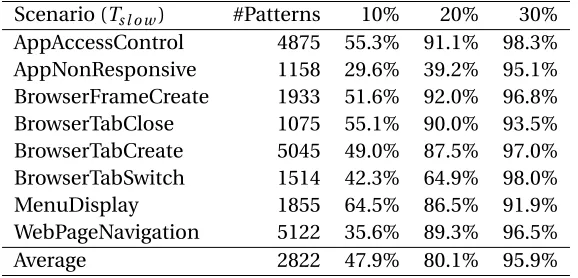
Table 2.3 Coverages by top 10%, 20%, and 30% of the ranked patterns. . . 33
Table 2.4 Drivers involved in top-10 patterns of each scenario categorized by driver types. . . 33
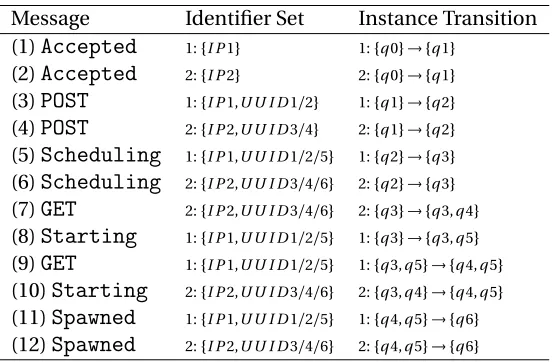
Table 3.1 Demonstration of CLOUDSEER’s checking process. . . 46
Table 3.2 VM tasks for experiments. . . 56
Table 3.3 Experiments for accuracy and efficiency. . . 58
Table 3.4 Execution points for failure injection. . . 58
Table 3.5 Experiment results for accuracy. . . 59
Table 3.6 Experiment results for efficiency. . . 61
Table 3.7 Experiment results for problem detection. . . 61
LIST OF FIGURES
Figure 2.1 An illustration of cost propagation due to lock contentions and
hier-archical dependencies among device drivers. . . 16
Figure 2.2 An illustration of an Aggregated Wait Graph for device drivers. . . 22
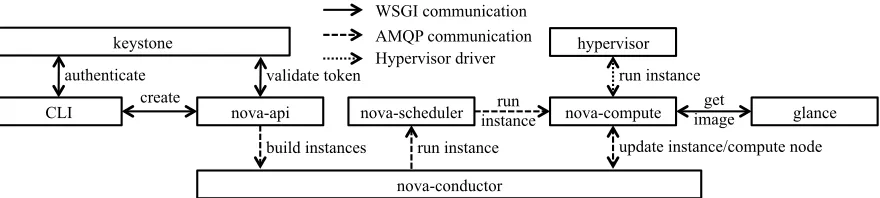
Figure 3.1 Inter-service interactions when booting a VM. . . 42
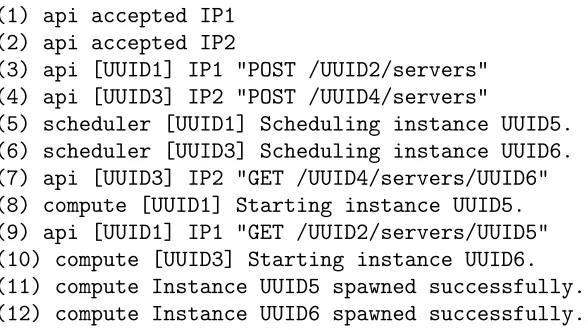
Figure 3.2 Simplified log sequences for booting VMs in OpenStack. . . 44
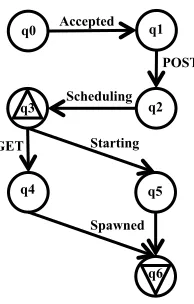
Figure 3.3 The automaton for booting a VM. . . 45
Figure 3.4 Removing message dependencies from task automata. . . 55
Figure 3.5 Message ordering: normal and reordering cases. . . 62
Figure 4.1 The abstract request-based execution model. . . 69
Figure 4.2 An excerpt of three related request-handler methods and their view templates from OpenMRS. Only method parameters related to our discussion are shown. . . 71
PUBLICATIONS
This dissertation is based on the following publications from my Ph.D. research:
• Xiao Yu, Shi Han, Dongmei Zhang, and Tao Xie.
Comprehending Performance from Real-World Execution Traces: A Device-Driver Case.
ACM ASPLOS 2014[136].
The major part of this work was completed during my internship at Software Analytics
Group of Microsoft Research.
• Xiao Yu, Pallavi Joshi, Jianwu Xu, Guoliang Jin, Hui Zhang, and Guofei Jiang.
CloudSeer: Workflow Monitoring of Cloud Infrastructures via Interleaved Logs.
ACM ASPLOS 2016[138].
The major part of this work was completed during my internship at Autonomic
Management Department of NEC Laboratories America.
• Xiao Yu and Guoliang Jin.
Dataflow Tunneling: Mining Inter-request Data Dependencies for Request-based Applications.
CHAPTER
1
INTRODUCTION
Software systems have never been as complex as they are today. Such complexity is driven
by the increasing user requirements, and it is in part reflected by numerous integrated
and stacked subsystems and components, which range from those in low-level operating systems to high-level applications. A large data center can run numerous servers, in which
operating systems host the whole software infrastructure; some infrastructure software
supports individual applications; and specialized applications serve end-user requests.
Within each of these elements, there are also many individual components designed for
more specialized functions. Despite the physical size of hardware, a small smart phone can
also have a similar structure including multilevel subsystems and components, and they
work collaboratively to serve functionality impacting our daily life.
While dividing a system into subsystems and components provides great flexibility and
scalability for the increasing user requirements, it also brings challenges to the assurance of reliability and performance throughout system development, operation, and maintenance.
Generally speaking, a growing system has to integrate more and more components, which
inter-action between components would not only introduce failures and performance problems,
but also escalate the problems through interactions to other components. Such escalation
is prevalent and can be disastrous in real-world systems. For example, multiple notorious
incidents in Amazon Web Services (AWS)[110, 111]simply started from some ordinary network problems, but these problems later triggered latent software bugs that caused
severe consequences affecting millions of users. Such incidents clearly exhibit how a small
and seemingly unharmful problem in one single component can trigger a disastrous total
system failure in real-world complex systems.
Developers have long been seeking and applying various techniques to ensure system
reliability and performance. In the development stage, in-house testing is the front line of catching problematic components, but it does not always succeed. In the real-world
scenarios, test cases may be insufficient to cover all possible component behaviors and
interactions under diverse operation environments. And since complex systems are usually
extensible, some third-party components may not even be available in the in-house testing
environment. Program analysis is another in-house means, but it does not scale well to large
systems with sophisticated software architectures. In such systems, component
depen-dencies are usually determined and established at runtime, which would cause program
analysis to generate imprecise results.
As problems would inevitably happen in production runs, developers hope to capture them on their occurrences, and further debug and fix their underlying causes in the
opera-tion stage. That is the last line of defense against unreliability and poor performance. To
effectively capture such problems, developers rely on certain runtime data collection
mech-anisms, which are commonly tracing and logging. The collected data provide a limited view
for developers to observe system behaviors in the real-world scenarios. Then the question
becomes how developers can effectively analyze such data. In complex systems, logs and
traces can be in a very large size, and they usually contain very noisy information, both
relevant and irrelevant to problems to be analyzed. As a result, developers still need proper
tools and techniques to navigate through pieces of collected information to understand the occurred problems and their root causes. And it still remains an open question that
how such data and findings would further complement and benefit the development stage
in building more reliable and performant systems other than just being the last defense.
Under the aforementioned status quo, this dissertation attempts to address a
How to leverage runtime data to understand and debug complex software systems?
Our attempt leads a direction that spans multiple research areas including software
en-gineering, software systems, and data science with two main focuses: problem-driven
exploration of runtime data, and usability of discovered insights. As we will present in later
chapters of this dissertation, our proposed techniques are all driven by specific reliability
and/or performance problems as well as analysis challenges in various systems, including operating systems, cloud infrastructures, and request-based applications. They constitute
the modern software ecosystem, and are inevitably facing various problems caused by their
specific system characteristics. Driven by these problems and their related characteristics, our techniques can provide useful insights for developers or tools. Such insights may go
beyond just catching individual failures or performance problems. For example, DATAFLOW TUNNELING, our most recent technique targeting at request-based applications, infers data dependencies across hard-to-analysis application components. The inferred dependencies
aim at enhancing program analysis tools to perform more analyses and find different kinds
of problems. DATAFLOWTUNNELINGhas gained very positive feedback from its reviewing process. One reviewer even called it “a very fundamental advance in the topic of analysis of web applications.”
All techniques in this dissertation attempt to address a common research challenge, which is the modeling of data in applying data-driven methods. Runtime data, specifically
logs and traces, could be very noisy, containing both relevant and irrelevant information of
interest. A representative example is system-wide execution traces collected by modern
tracing frameworks, such as Event Tracing for Windows (ETW)[42]. It produces tracing events in multiple system layers, from user-mode applications to the system kernel. As a
result, the potential investigation scope for reliability or performance problems could be
hard to determine, calling for effective modeling techniques to assist.
Sometimes too much information does not mean useful information. As the log and
trace generation process incurs performance overhead, it always involves balanced deci-sions between acceptable overhead and collected information that preserves enough details
of system behaviors. Logging is a typical example of such balanced decisions. Although
logs with great details can be very useful in debugging live systems, a verbose logging level
is rarely used as it would degrade system performance. Consequently, the information
in logs may be incomplete or not explicit enough for debugging purposes. Some existing
additional information for debugging.
This dissertation presents various models that provide a proper scope and extract
useful information over noisy runtime data. To analyze performance problems related to
calling and waiting dependencies between operating system components, we propose a
graph-based data abstraction over millions of callstack traces. For cloud systems involving
distributed components being executed collaboratively, we propose a workflow model over
logs to facilitate the understanding of system executions. For components with implicit
dependencies in request-based applications, we propose a tracing technique to model
object accesses across components for further analysis of data dependencies.
1.1
Overview of Proposed Techniques
We present a high-level overview of all the proposed techniques, which will be discussed
in details in later chapters. This overview discusses specific problems, challenges, and
highlights in each technique.
1.1.1
Understanding Performance Problems Related to Device Drivers
An operating system can be regarded as a software ecosystem, in which multiplecom-ponents interact with each other. The operating system performance can therefore be
affected by problematic components and their interactions with others. And it is difficult to diagnose performance problems involving component interactions. Such difficulties are
mainly reflected by subtle triggering conditions and root causes hidden deeply from places
where problems manifest.
Addressing performance problems related to component interactions depends on two
key questions: (1) what problematic components and their runtime behaviors are in the real
world; and (2) to what extent and how they would affect the overall system performance. In
practice, execution traces from real-world systems provide rich information to answer these
questions, because they capture usage scenarios with diverse components and interactions
that are not seen during in-house testing. However, these traces contain millions of discrete
tracing events, rendering inspection without automated techniques ineffective.
With execution traces collected from 339 hours of real-world usage of Windows, our
findings indicate that Windows device drivers constitute a non-trivial part in the overall
synchronizations: (1) a driver can invoke other drivers in the same driver stack through
the kernel, and (2) a driver can block other drivers by synchronizations. The combination
of these interactions can propagate and amplify performance problems across multiple
components and processes. Based on these findings, we propose two general automated
analyses to answer the key questions: (1) impact analysis measuring what drivers and
to what extent they impact the overall system performance, and (2) causality analysis
identifying interaction patterns of high-impact drivers that are likely to cause perceived
performance problems. On the collected traces, the impact analysis revleas that device
drivers constitute 36.4% on waiting time and 1.6% on running time, and 26.0% of the
driver waiting time is due to the amplification of interactions. The causality analysis further discovers some real-world cases of high-impact drivers with their long interaction paths
that lead to significant performance problems.
1.1.2
CLOUDSEER: Monitoring Cloud Infrastructures via Logs
Cloud infrastructures provide a rich set of management tasks, whose executions involve
interactions and collaborations among multiple distributed components. Monitoring such
task executions is crucial for cloud providers to promptly identify and fix problems that
compromise cloud availability. When a reliability problem occurs, such as performance
degradation, it is particularly useful to know what task execution is affected and what
component may be the source of the problem.
Monitoring logs centralized from different components is a common practice. This pro-cess is lightweight and non-intrusive, and does not introduce extra complexity or overhead
to the system under monitoring. However, even when centralized, logs are still unstructured
and highly interleaved due to the distributed and multi-tenant nature of such systems,
limiting log monitoring to specific types of log messages, but not associating them with
task executions. So this question naturally raises: is it possible to monitor how individual
tasks are being executed by attributing individual log messages to their corresponding task
executions?
By investigating logs in OpenStack, a popular open-source cloud-infrastructure system,
we identify both opportunities and challenges for log monitoring: (1) log timestamps can determine the order of distributed components executing the same task, but asynchronous
executions also introduce non-deterministic message orders; (2) some resource identifiers
identifier is shared by all messages in the same execution. Based on these observations,
we propose CLOUDSEER, a log-based monitoring approach to monitor workflows of task executions. CLOUDSEERfeatures: (1) a modeling technique, which abstracts log messages and their possible orders into an automaton model for each task, and (2) an efficient
checking algorithm, which uses the modeled automata and partially shared identifiers to
accurately attribute interleaved log messages to their corresponding task executions, and
reports state divergences as potential failures. The experiments on OpenStack show that
the approach can correctly and efficiently associate at least 92.08% of the task executions
with their log messages, and can achieve a precision of 83.08% and a recall of 90.00% on
the injected problems.
1.1.3
DATAFLOW
TUNNELING: Mining Inter-request Data Dependencies
for Request-based Applications
Request-based applications serve as the front end of server applications, such as web sites
and RESTful APIs. These applications adopt the request-based execution model, which
typically consists of a set of request-handler methods invoked upon user requests by an
application framework. In this model, highly modular and stateless methods make the analysis and understanding of the application as whole difficult. Such difficulties often lead
to repetitive and uncoordinated application behaviors across requests, further affecting
application’s reliability, performance, and security. For example, methods handling two
related requests may repeatedly create identical data objects without the knowledge of
request-input dependencies. To avoid such problems from happening, it is crucial for
developers to understand what data dependencies may exist between related
request-handler methods.
Conventional interprocedural analysis is ineffective to infer and analyze such data
de-pendencies, because they along with method calling relationships are implicitly established by the complex framework and request sequences. In addition, components involved in
propagating data from request input to output are usually written in different languages,
e.g., request-handler methods in ordinary object-oriented languages, while view templates
rendering request output in markup languages.
To solve these analysis challenges, we propose DATAFLOWTUNNELING, a dynamic proach to capture indirect data dependencies between request-handler methods. This
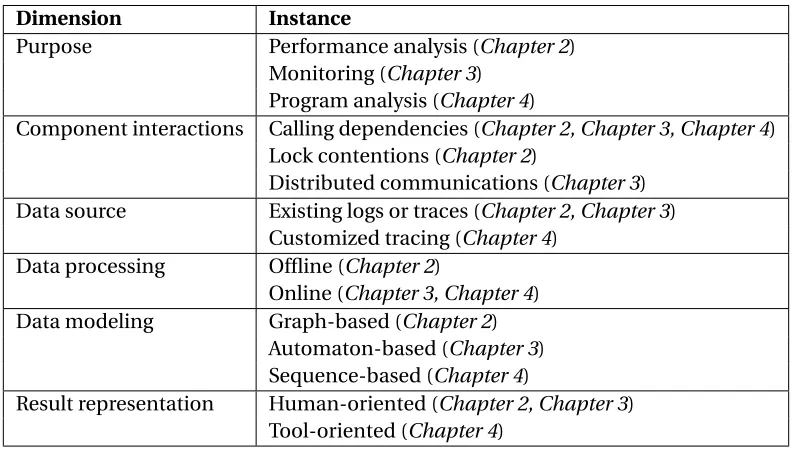
Table 1.1Problem dimensions of the proposed techniques.
Dimension Instance
Purpose Performance analysis (Chapter 2)
Monitoring (Chapter 3) Program analysis (Chapter 4)
Component interactions Calling dependencies (Chapter 2, Chapter 3, Chapter 4)
Lock contentions (Chapter 2)
Distributed communications (Chapter 3)
Data source Existing logs or traces (Chapter 2, Chapter 3)
Customized tracing (Chapter 4)
Data processing Offline (Chapter 2)
Online (Chapter 3, Chapter 4)
Data modeling Graph-based (Chapter 2)
Automaton-based (Chapter 3)
Sequence-based (Chapter 4)
Result representation Human-oriented (Chapter 2, Chapter 3)
Tool-oriented (Chapter 4)
framework behaviors without instrumenting the framework code, and a mining technique
to reconstruct data dependencies. Our evaluation shows that the reconstructed dependen-cies are over 80% accurate and useful in understanding the behaviors of request-handler
methods in the inter-request scope, such as tuning object caching policies. We envision
this approach as a foundation for future full-fledged analysis tools.
1.2
Problem Dimensions
Along with the overview of proposed techniques, we summarize and present in Table 1.1
critical dimensions that we need to consider in applying data-driven techniques for software
systems. These dimensions are related to the purposes of applying data-driven analysis, characteristics of systems, how data are handled, and how results are represented. For
instance, this dissertation covers three different purposes that can benefit from data-driven
analysis.
In other dimensions, component interactions are the one directly related to system
behaviors, and it is correlated to the dimension of data modeling. Although our techniques
true differences in the technique design. Types of interactions can affect what runtime
data could be and how they should be modeled and analyzed, i.e., the dimension of data
modeling. For example, calling dependencies can usually be reflected by stack traces, which
can be modeled as simple sequence patterns. However, the co-existence of lock contentions
or distributed communications in complex systems may result in nondeterministic logging
or tracing entries, which calls for sophisticated modeling, such as the graph-based or the
automaton-based model.
On the data source, complex software systems usually produce various kinds of logs
and traces, but we need to consider whether such data are sufficiently useful for our
spe-cific analysis purposes. This dissertation describes techniques for both cases. In our first technique for device drivers, we use execution traces that have been practically used in
per-formance analysis. In CLOUDSEER, we repurpose existing end-to-end logs from distributed components for online monitoring. And in DATAFLOWTUNNELING, we design a customized tracing mechanism for request-based applications in which no available runtime data can
fit our purpose.
With proper data, we must determine how our analysis algorithms would work to
process data: in an offline manner or online. This choice is closely related to the purpose
dimension. While offline analysis is widely applicable to gain insights for development
and debugging activities such as performance analysis, we must design techniques that can process incoming data online for scenarios like monitoring. It is notable that we also
design DATAFLOWTUNNELINGto be able to infer data dependencies online to avoid storing concrete user data.
The ultimate goal of data-driven analysis is to get useful and actionable results from
data. Then the way of representing the results is another consideration to make. We aim
at two types of representations: human-oriented and tool-oriented. A human-oriented
representation helps developers understand system behaviors and related reliability or
performance problems. We design a function-signature based representation to explain
how calling dependencies and lock contentions would cause performance problems. We also design an automaton-based representation to pinpoint the component involved in a
failed execution workflow for developers to investigate. On the other hand, a tool-oriented
representation aims at enhancing tool capability in analyzing complex system components.
1.3
Related Work
While the discussion of related work for each technique is in their respective chapter, we
highlight in this section some related techniques that are subsequently developed by others
after the publications of ours. We consider that they are partly inspired by our techniques and take one step forward from ours.
SyncProf[134, 135]is an end-to-end technique that detects, localizes, and optimizes synchronization bottlenecks. Similar to our technique in Chapter 2, SyncProf uses a
graph-based model to abstract wait relations between threads, measure performance impact of
synchronization bottlenecks, and identify potential root causes. As our technique only
focuses on detecting such bottlenecks, SyncProf takes one step forward to automatically
optimize them by a set of lock-related rules. Such subsequent optimization clearly shows
the usefulness of data-driven analysis in analyzing complex systems.
Some newly published log-based techniques, such as structural event detection by Wu
et al.[130], anomaly diagnosis by Jiaet al.[55], and DeepLog[40], all adapt the idea of workflow-based monitoring used in CLOUDSEERto detect anomalies in complex systems. DeepLog[40]adapts the cutting-edge deep learning techniques to build workflow models and monitor logs with a higher accuracy. Wuet al.[130]presents an advanced learning tech-nique to detect structured workflows in noisy logs from open systems. Such open-system
logs would render temporal relations adopted by CLOUDSEERinaccurate in describing workflows. As machine learning techniques keep flourishing in recent years, we will see
more improvement opportunities for our proposed techniques.
1.4
Contributions
We describe our main contributions and the organization of this dissertation as follows.
In Chapter 2, we describe a trace-based performance analysis technique that works on
millions of executions traces from real-world Windows installations. That chapter presents
not only the technique, but also empirical evidence on how device drivers in the Windows
kernel would cause significant performance problems, as well as findings and insights from
real-world scenarios.
cloud infrastructures. CLOUDSEERbuilds workflow models from logs, and uses such models to check live logs for potential execution problems in the form of structured workflow.
Such workflow information can facilitate the understanding and resolving of the reported
problems.
In Chapter 4, we describe DATAFLOWTUNNELING, a technique for request-based appli-cations that rely on modern frameworks. DATAFLOWTUNNELINGinfers the hidden data-dependency specifications by a combination of program analysis, tracing, and mining. The
inferred specifications enable future work to implement inter-request analysis, which works
in the scope across request-handler methods, and may help developers gain application
insights from a holistic view.
Finally, in Chapter 5, we conclude our experience of applying data-driven analysis in
various software systems, and discuss some future directions that make a step further
CHAPTER
2
COMPREHENDING PERFORMANCE
FROM REAL-WORLD EXECUTION
TRACES: A DEVICE-DRIVER CASE
2.1
Introduction
Real-world execution traces collected by mature infrastructures, such as the Event Tracing for Windows (ETW)[42]and DTrace[39]for Unix-like systems, offer tracing events with timestampes and callstacks for both user-mode applications and system layers. Such traces
can record performance problems that are likely perceived at deployment sites and usually
triggered by complex runtime environments and real-world usage scenarios. By
analyz-ing large-scale and diverse execution traces collected from deployment-site computers,
performance analysts and developers can gain useful knowledge for system design and
optimization.
problems can be rooted subtly and deeply into system layers or other components far
from the place where delays are initially observed. Performance analysts have to spend
great efforts to confirm the existence of subtle problems, and to figure out how they were
caused and spread. Given many real-world execution traces where bad performance may be
amortized over various underlying problems, such performance-analysis activities become
harder or even infeasible.
Based on our observation in real-world traces, we identify and generalize the concept of
cost propagationin systems consisting of interacting components as an important under-lying mechanism that introduces the subtleness of performance problems. In particular,
the term “cost propagation” refers to a phenomenon that the cost of executing a com-ponent is propagated and accumulated to the execution of another comcom-ponent through
cross-component interactions.
There are different kinds of interactions causing cost propagation. Call dependency
is a well-known kind, which accumulates costs from callees to callers. Lock contention is
a subtle kind, which allows a delay to be propagated to all other components waiting for
the same lock. In complex software ecosystems (e.g., Windows systems), different kinds
of interactions can be combined together to create performance bottlenecks involving
multiple victims. For example, there can be a very long propagation path or multiple
propagation paths consisting of both call dependencies and contentions on different locks. The cost propagation brings challenges to performance analysis of complex systems.
Existing techniques, such as call-graph profiling[47]and lock-contention analysis[115], face two major limitations. First, these techniques cover a single aspect of underlying
in-teractions only, which is either call dependency or lock contention. Their combinatorial
effects are not generally considered or addressed. Second, these techniques usually work
on a single program with a limited investigation scope, but cannot explain performance
problems with complex cause-and-effect chains that are transparent to the program, but
are grounded in the underlying system. To better reveal and explain these problems, a large
number of system-level execution traces can be leveraged from real-world deployment sites. Handling these traces requires effective abstractions that can capture essential
infor-mation, and classify similar and distinct runtime behaviors towards providing concise and
actionable results.
To address these challenges, we propose a new approach consisting of two steps: impact
from execution traces, and measures performance impacts with respect to cost propagation
on Wait Graphs. Performance analysts can narrow down the investigation scope by choosing
highly suspicious components to measure, and decide whether the causality analysis is
needed based on the significance of performance impacts.
The causality analysis discovers behavioral patterns of highly suspicious and
high-impact components that are likely to cause perceived performance problems. To capture
the essence of problematic behaviors with respect to cost propagation, we design the
Signature Set Tuple(Section 2.4.1) as a pattern representation that presents abstracted and generalized behaviors to performance analysts. A Signature Set Tuple generalizes
interacting behaviors among components in the form of signature sets (a set of function signatures extracted from callstacks). Such abstraction and generalization facilitate the
comprehension of performance problems by narrowing down the investigation scope as
well as preserving highly suspicious behaviors that may appear similarly in different traces.
The causality analysis is grounded in the technique of contrast data mining [16]to address challenges in discovering problematic behaviors. Such challenges are two-fold: bad
performance can be amortized over multiple problematic behaviors, and there is no easy
oracle for identifying problematic behaviors, especially for the expensive but necessary ones.
Our technique exploits the fact that a large number of execution traces may contain various
runtime behaviors with both good and bad performance. In particular, our technique defines two contrast classes over execution traces as a fast class and a slow class based
on thresholds of execution time (usually specified by developers as the expectations on
performance). The fast class contains expected runtime behaviors, whereas the slow class
contains problems to be identified. Our technique applies two criteria to identify contrast
patterns: (1) a pattern appears in the slow class but not in the fast class; (2) a pattern appears
in both classes, but the pattern in the slow class shows a significant amount of execution
time compared with the pattern in the fast class. The identified contrast patterns can reflect
underlying key factors that discriminate the performance contrasts.
In this work, we choose device drivers in Windows operating systems as a representative to demonstrate our approach and study performance problems. Device drivers constitute a
majority part (about 70%) in the Linux code base[96], as well as in the Windows kernel[64]. Performance analysts in Microsoft product teams have noticed that a non-trivial number of
response delays in user-mode applications were likely caused by device drivers. Therefore,
performance.
We notice that two key characteristics in device drivers can cause cost propagation.
First, locks are widely used in device drivers to synchronize shared resources over the
system kernel. Second, device drivers are organized in a hierarchical architecture (a.k.a
driver stack) in which drivers can interact with each other via system services, e.g., the
IoCallDriver
routine in Windows. The form of hierarchical dependencies connecting multiple contention points of different locks can propagate a delay to all affected driversand corresponding user-mode applications to create remarkable performance problems.
Main Contributions.In this work, we make main contributions from two aspects. On performance analysis, we propose a practical two-step approach with effective data and pattern abstractions to measure performance impacts manifested through cost
propaga-tion, and discover behavioral patterns closely related to performance problems via contrast
data mining. The effectiveness of the pattern discovery is examined and confirmed by our
automated evaluation, driver developers, and performance analysts.
By applying the impact analysis on 19,500 real-world execution traces (339 hours of
duration in total, collected from Windows machines), we show the empirical evidence
of performance impacts posed by device drivers. Our findings show that device drivers
constitute 36.4% on waiting time and 1.6% on running time in overall Windows performance,
within which cost propagation causes 26.0% on waiting time. Moreover, by applying the causality analysis on some typical application scenarios, we show concrete examples of
performance problems related to device drivers. These findings suggest that identifying and
minimizing potential cost propagation in device drivers should be an important direction
for designing a high-performance system, especially for the cases involving driver/driver interactions, which complement the discussion by Kadavet al. [64].
2.2
Background and Motivating Examples
2.2.1
Execution Traces
Execution traces are the data source of our trace-based performance analysis. To simplify the
data representation while preserving essential information, we use an abstracted schema
Trace Stream. A trace streamT S is a sequence of tracing eventse0e1e2. . .eL−1. Each
evente falls into one of the following four types: (1) arunningevent represents CPU usage sampled in a constant interval, e.g., 1 millisecond in ETW and DTrace; (2) await event occurs when a thread enters the waiting state due to blocking operations, e.g., a thread tries
to acquire a lock being held by others; (3) anunwaitevent occurs when a running thread signals another thread in the waiting state to continue execution, e.g., a thread releases a
lock or sends a message; (4) ahardware serviceevent is recorded with a start timestamp and duration in the period of a hardware operation.
Each event e is also related to a set of fields, which are callstack (denoted as e.S), timestamp (e.T), cost as time duration (e.C), the related thread ID (e.T I D), and the ID of the other thread to be unwaited (e.W T I D). These fields are sufficient for capturing and characterizing essential runtime behaviors under performance analysis from a
cost-propagation perspective.
Scenario.Performance analysts usually start performance analysis with a scenario, e.g.,
BrowserTabCreatefor creating a browser tab, to explore what run slow in that scenario. During a period of time, a system could have multiple ongoing scenarios simultaneously,
since a user can browse websites while the system is performing other operations.
Perfor-mance analysts have a set of predefined scenarios that are used to capture scenario-related
execution traces.
Scenario Instance.A trace stream can contain events for multiple scenarios that were being performed by the system during the tracing period. Among these events, an event
sequence representing the execution of a single scenario is called ascenario instance. A sce-nario instance typically starts and ends with the events from a single initiating thread, which
initiates the execution of a particular scenario. For example, a browser UI thread that reacts
to a user’s request of creating a new browser tab is an initiating thread forBrowserTabCreate. Formally, a scenario instanceIof a scenarioSis a tuple〈T S,S,T I D,t0,t1〉, indicating that
the execution of the scenarioSstarting from a thread (with the identifierTID) within the time period betweent0andt1is recorded in a trace streamTS.
Some events may overlap across multiple instances in the same trace stream. Such
over-lap indicates that other threads are suspended by the thread that triggers those overover-lapped
events, so it is a typical manifestation of cost propagation. Such observation is the key to our
... fv.sys!QueryFileTable Browser!TabCreate kernel!OpenFile ... kernel!AcquireLock Browser UI thread TB,UI
... fv.sys!QueryFileTable Browser!Worker kernel!CreateFile ... kernel!AcquireLock ... Browser!Main ... fv.sys!QueryFileTable Browser!Worker kernel!CreateFile ... ... fs.sys!AcquireMDU kernel!RequireResource ... AV!Worker kernel!OpenFile ... fs.sys!AcquireMDU kernel!RequireResource ... CM!Worker kernel!OpenFile ... fs.sys!AcquireMDU ... se.sys!ReadDecrypt Browser worker thread
TB,W0
(FileTable lock holder) Browser worker thread
TB,W1
AntiVirus worker thread TA,W0
(MDU lock holder) Configuration Manager
worker thread TC,W0
System worker thread TS,W0
... kernel!Worker
fs.sys!Read Contention region of
FileTable lock (4)
Dependency from fv.sys to fs.sys via function call
(1)Dependency from fs.sys to se.sys via system-service call
kernel!WaitForObject (3)
(5) (6)
(2) Contention region of
MDU lock
Disk service time and Decryption CPU time (1)se.sys propagates the disk time and its decryption CPU time to fs.sys via system-service call return
(2)TC,W0 propagates its delay and accumulates its CPU time via releasing the MDU lock to TA,W0
(3)TA,W0 propagates its delay and accumulates its CPU time via releasing the MDU lock to TB,W1
(4)fs.sys propagates its delay to fv.sys via function call return
(5)TB,W1 propagates its delay and accumulates its CPU time via releasing the FileTable lock to TB,W0
(6)TB,W0 propagates its delay and accumulates its CPU time via releasing the FileTable lock to TB,UI
Then TB,UI continues its execution until the finish of the browser tab creation
Figure 2.1An illustration of cost propagation due to lock contentions and hierarchical
dependen-cies among device drivers.
2.2.2
A Real-World Case
We use a real-world case to show how cost propagation in device drivers is involved in
producing a performance problem. Due to confidentiality, we anonymize the names of
device drivers and relevant resources in this example.
An execution instance of the scenarioBrowserTabCreatecost over 800 milliseconds to complete. From the user’s perspective, the web browser fully displayed a new tab in over
800 milliseconds after the user had clicked “create a new tab.” Such delay is perceivable on
the user interface.
This problem involves three device drivers having lock contentions and hierarchical
dependencies. First, File Virtualization filter driverfv.sysuses locks to synchronize queries on the entries of an internalFile Table that maps some “virtual” files to their physical locations on the file system. Second, File System driverfs.sysacquires locks onMeta Data Units (MDUs) that contain file metadata when there are requests on reading or writing a file. Third, Storage Encryption driverse.sysperforms computation-intensive encryption and decryption when data are being read and written on storage media. The three device
drivers form a hierarchy in which the top-most driverfv.sysinvokesfs.sys, whereasfs.sys
invokesse.sys. To ease the illustration, we omit those less relevant drivers that may exist in the hierarchy on a real machine.
Figure 2.1 is a thread-level snapshot restructured from the trace stream to show the
ongoing operations. There were six threads executing the three device drivers during this
period. We denote these threads by the notationTX,Y, which means the threadY of the
processX. The dotted arrows in the figure represent the directions of cost propagation among threads.
Lock Contentions on the File Table.When the user clicked “create a new tab” on the browser, the browser UI threadTB,U I started to access some “virtual” files. SoTB,U I executed
fv.systo query theFile Table. However, two other worker threadsTB,W0 andTB,W1 were
performing file operations in the background, and happened to executefv.sysat the same time. As a consequence, the three threads were contending a lock on some entries in the
File Table, thereby forming a region of lock contentions infv.sys(shown as the upper dashed box in Figure 2.1). Among these three threads,TB,W1first got the lock, so the other two
threads had to wait.
Hierarchical Dependency Between fv.sys and fs.sys.TB,W1proceeded to executefs.sys
by a function call initiated fromfv.sys, thereby creating a hierarchical dependency between the two device drivers (shown as the arrow (4) in Figure 2.1). Thus, the continuation of
executingfv.sysdepended on the return offs.sys.
Lock Contentions on Meta Data Units (MDUs).During the period thatTB,W1was
run-ning, two threadsTA,W0andTC,W0from two other applications (i.e., the AntiVirus and the
Configuration Manager applications in Figure 2.1) were contending a lock onMDUs in
fs.sys. Coincidentally,TB,W1joined to contend the same lock. Therefore,TB,W1,TA,W0, and TC,W0created another region of lock contentions infs.sys, shown as the lower dashed box
in Figure 2.1.TC,W0first got the lock, and proceeded.
Hierarchical Dependency Between fs.sys and se.sys.TC,W0established a hierarchical
dependency betweenfs.sysandse.sysby a system-service call that reads data from disk (shown as the arrow (1) in Figure 2.1). The system threadTS,W0was scheduled to serve the
read request by fetching data from disk and executingse.systo decrypt. To accomplish the task,TS,W0cost hundreds of milliseconds.
Summary: Manifestation of Cost Propagation.The three device drivers together cre-ated a bottleneck that consisted of two regions of lock contentions, and two hierarchical
dependencies over the six threads (i.e., three browser threads, one AntiVirus thread, one
Configuration-Manager thread, and one system thread). A delay occurring inTS,W0was
propagated and accumulated through the path shown as the arrows from (1) to (6) in
clicking a button on the browser to create a new tab. In addition, the other two applications
in this case were also affected by such performance impact. Reducing the granularity of
locks is a general principle to alleviate such problem.
2.2.3
How Our Approach Facilitates Performance Analysis
The preceding example shows the subtleness caused by cost propagation in real-world
performance problems. In practice, a performance analyst has to start with the browser
UI thread to examine many executed functions in many traces, since the costs may vary
in different executions. Such work is usually tedious. Even if the analyst finds out that
fv.sys!QueryFileTablecould incur high execution cost in lock contentions among different browser threads under some circumstances, the analyst still needs to realize the relations
across three drivers and many threads that constituted the whole performance. Realizing such relations is the key to future performance tuning.
By employing impact analysis, the analyst can first realize to which extent the
perfor-mance of scenarioBrowserTabCreatewas affected by cost propagation. The analyst may conduct impact analysis on different scopes to realize performance impacts of different
components. The results serve as the preliminary evidence pointing to some potentially
hidden problems. Then the analyst can apply causality analysis on high-impact
compo-nents, for instance, device drivers in this case. The causality analysis can suggest a list of
contrast patterns sorted by their performance impacts. We pick the following one to explain
in detail. The pattern is in the form of Signature Set Tuple, which is formally defined in Section 2.4.1.
w a i t s i g n a t u r e s:{f v.s y s!Q u e r y F i l e T a b l e,f s.s y s!Ac q u i r e M D U}
u n w a i t s i g n a t u r e s:{f v.s y s!Q u e r y F i l e T a b l e,f s.s y s!Ac q u i r e M D U}
r u n n i n g s i g n a t u r e s:{s e.s y s!R e a d D e c r y p t,D i s kS e r v i c e}
This pattern describes that the cost of the running signaturesse.sys!ReadDecryptand
Disk Servicecan be propagated through the two unwait signaturesfv.sys!QueryFileTable
andfs.sys!AcquireMDU to the wait signatures, while functions represented by the wait signatures are invoked by the browser threads. The causality analysis can discover this
pattern because in normal cases either such pattern does not appear, or it has much lower
The discovered pattern can help an analyst from two aspects. First, it guides the analyst
to realize the concrete performance incident by investigating a specific trace stream. The
preceding example is actually restructured with the help of the discovered pattern. Second,
the pattern as a generalized representation is a clue for similar cases. The analyst may
prioritize the search of the three driver signatures in other cases to facilitate future analysis.
2.3
Impact Analysis
The goal of impact analysis is to scope and measure performance impacts for some chosen components, such as all device drivers. The impact analysis takes two inputs: (1) the
in-stances of various scenarios over trace streams; (2) the component name(s) that are used
to filter tracing events for the chosen components to be measured.
The impact analysis outputs three metric values: (1) the running percentageIAr u n; (2)
the wait percentageIAw a i t; (3)IAo p t, the percentage of waiting time introduced by cost
propagation.
The three metrics suggest three performance aspects of the chosen components. A
largeIAw a i t indicates that the execution of the components is frequently blocked by others,
whereas a largeIAr u nreflects a computation-intensive characteristic.IAo p t suggests how
much extra cost is introduced by waiting on others. It can also serve as an upper bound for
the optimization potential.
2.3.1
Data Abstraction
The impact analysis measures the running time and the waiting time for the chosen
com-ponents, respectively. To serve this purpose, we use the Wait Graph structure from
Stack-Mine[49]to model scenario instances. A Wait Graph encodeswaitandunwaitevents into wait chains, withrunningevents as well. So it enables an easy way to measure both running and waiting time for impact analysis; otherwise, we would need to simultaneously keep
track of eachwaitevent to its correspondingunwaitevent.
Definition 1 A Wait Graph is a graph W G =〈V,E〉. V is a set of nodes V ={e}, where e is a tracing event. E is a set of directed edges E ={ei→ej}. For each edge ei→ej, ei must be
a wait event, indicating that the thread triggering ei keeps suspended before ej occurs and
The Wait Graph of a scenario instance is basically constructed by (1) pairing each wait
event with its correspondingunwaitevent to restore wait chains among threads, (2) edging events as graph nodes based on the restored wait chains, and (3) restoring the duration of
waitevents from the timestamps on pairedwait/unwaitevents. StackMine[49]contains an algorithm description for constructing a Wait Graph. We construct Wait Graphs based
on that algorithm for our impact analysis and causality analysis with characteristics of
Windows systems.
2.3.2
Impact Measurement
2.3.2.1 Basic MetricsFor every scenario instance, the impact analysis constructs a corresponding Wait Graph. To
evaluate the values forIAr u n,IAw a i t, andIAo p t, the impact analysis introduces the following
metrics that are calculated from all constructed Wait Graphs.
The total durationDs c n defines the aggregated execution time of all scenario instances
in the input trace streams. Given the Wait Graph for each scenario instance, the impact
analysis evaluatesDs c n by adding up the time periods of top-level tracing events in the Wait
Graph instance by instance.
The total wait durationDw a i t defines the aggregated wait time cost by the chosen
components in waiting for others. To determine which components should be counted, the
impact analysis uses the names of the chosen components to filter the topmost signatures
on the callstacks of tracing events. The impact analysis uses a breadth-first search on the
Wait Graphs, and adds up the time periods of only top-levelwait events of the chosen components to avoid counting child events that constitute the time cost already counted
from their parent events.
The total running durationDr u n defines the aggregated running time cost by the
cho-sen components. Similar toDw a i t, the impact analysis evaluatesDr u nby counting duration
of therunning events that contain signatures of the chosen components. Note that (1) some portions of periods inDr u n are overlapped withDw a i t because therunningevents
are mostly the leaf nodes of some wait events; (2) Dr u n is an approximate value since
ETW samplesrunning events every millisecond and thus those running costs are at the millisecond granularity.
wait events of the chosen components over all scenario instances. Awaitevent may be involved in multiple Wait Graphs for multiple scenario instances, indicating that (1) the
enclosing instances are captured in a common or close period of time from the same
deployment site, and (2) the event has performance impact on multiple instances. The
impact analysis measuresDw a i t d i s t by excluding the duration of duplicate events across
different Wait Graphs fromDw a i t.
2.3.2.2 Output-Metric Derivation
The impact analysis derives the values of output metricsIAr u n,IAw a i t, andIAo p t from the
preceding metrics. In particular,IAr u n=Dr u n/Ds c nrepresents the performance impact of
running time, andIAw a i t =Dw a i t/Ds c nrepresents the performance impact of wait time.
For deriving the severity of cost propagation across different scenario instances, there is
IAo p t = (Dw a i t −Dw a i t d i s t)/Ds c n.IAo p t comes from the observation that any performance
impact involving the chosen components can affect multiple different scenario instances.
Namely,Dw a i t/Dw a i t d i s t >1, which describes that theDw a i t d i s t of duration actually causes
Dw a i t long wait among multiple scenario instances. The cost propagation is the underlying
reason causing such performance impact. For instance, in the motivating example (Sec-tion 2.2.2), the delay initiated byTS,W0actually affected not onlyBrowserTabCreate, but also
other scenario instances corresponding to two other applications along the propagation
path. If we suppose the optimal caseDo p t
s c n as removing cost propagation between irrelevant
scenarios, the extra percentage of cost introduced by cost propagation to the entire system
would be 1−Do p t
s c n /Ds c n= (Dw a i t−Dw a i t d i s t)/Ds c n. This value is also an upper bound for
the optimization of cost propagation. However, the actual optimization depends on the
root causes of performance problems and other factors.
2.4
Causality Analysis
If the results from impact analysis indicate that the chosen components are of high impact,
performance analysts can use causality analysis to discover runtime behaviors that may
cause the observed performance impacts.
fv.sys!QueryFileTableàfv.sys!QueryFileTable
fs.sys!AcquireMDUà
fs.sys!AcquireMDU
T0
T1
T2 T3
Disk
Aggregated running in the same signature function
Aggregated wait with the same pair of waitàunwait signatures Duration of an application scenario
T0,T1,…,T4 : Threads
Aggregated hardware service
A wait-for link due to dependency or lock contention
se.sys!Workerà
hardware service se.sys!Decrypt
Figure 2.2An illustration of an Aggregated Wait Graph for device drivers.
between normal and problematic behaviors affecting performance, but we do know the difference on performance measurements. Contrast data mining can thus serve as a link
from effect to cause. Namely, it allows us to discover behaviors that may cause the observed
difference on measurements.
2.4.1
Data Abstraction and Pattern Representation
To adapt contrast data mining in performance analysis, we introduce the Signature Set
Tuple as the pattern representation, and derive the Aggregated Wait Graph as the data
abstraction from Wait Graphs. So the contrast data mining can discover contrast patterns
in the form of Signature Set Tuple among different Aggregated Wait Graphs that are of
distinguishable performance measurements.
2.4.1.1 Aggregated Wait Graph
An Aggregated Wait Graph is essentially the abstraction and aggregation of runtime
be-haviors in a set of Wait Graphs belonging to the same scenario, based on the fact that
runtime behaviors in the same scenario represent the similar tasks under investigation. The
definition of an Aggregated Wait Graph is as follows, in which the termsignaturespecially denotes the topmost signature related to the chosen components on the callstacke.Sof a tracing evente, if there exists such signature on the callstack.
the following statuses: running, waiting, or hardware service. E is a set of directed edges E = {vi →vj}, in which each edge must start from a waiting node, indicating that the
pointed node performs its operation within the waiting cost of the starting node.
In addition, we attach some extra properties to the nodes in an Aggregated Wait Graph to ease our analysis.
Definition 3 In an Aggregated Wait Graph, each running node has a signature v.r; each hardware-service node has a dummy signature v.h; and each waiting node has two signatures: a wait signature v.w and its paired unwait signature v.u. Each node has a performance metric v.C as its duration of execution time, and has an occurrence counter v.N indicating the number of the same nodes from the source Wait Graphs.
Figure 2.2 shows a partial Aggregated Wait Graph for the motivating example in
Sec-tion 2.2.2. The region highlighted with a dashed box shows an aggregated path that repre-sents a group of paths of similar cost propagation from multiple scenario instances. The
aggregated path captures cost propagation from a hardware service via these.sysdriver and then thefs.sysdriver, finally tofv.sys.
2.4.1.2 Signature Set Tuple
Causality analysis presents mined patterns in the form of Signature Set Tuple. A Signature
Set Tuple generalizes runtime interactions related to cost propagation into three signature sets: a signature set, an unsignature set, and a running-signature set. The
wait-signature set contains wait-signatures that reside inwaitevents; namely, such signatures can cause the caller thread to be suspended. The unwait-signature set contains signatures
fromunwaitevents, which signal suspended threads to continue. The running-signature set contains signatures recorded inrunning events, or a dummy signature representing
hardware serviceevents. We extract Signature Set Tuples from path segments on Aggregated Wait Graphs. The definitions of the path segment and Signature Set Tuple are as follows.
Definition 5 A Signature Set Tuple P from a path segment S is P(S):=〈S
v.w,S
v.u,S v.r〉, where v ∈S . The performance metric of P(S) is defined as the metric of the path segment, i.e., P(S).C :=S.C , as well as the occurrence counter P(S).N :=S.N .
We design such Signature Set Tuple based on two key rationales. First, the three signature sets appropriately generalize the phenomenon that the cost of some time-consuming
operations (represented by the running-signature set) propagates to other parts in the
system via interactions in the direction from functions represented by the unwait-signature
set to those of the wait-signature set, regardless of the particular kinds of interactions.
Second, signature sets can accommodate variations of the cost-propagation sequences.
Consider a case of device drivers, in which two drivers contend a resource held by the third
driver. Such case creates two possible execution sequences in reality, depending on which
driver acquires the resource first. A pattern in the Signature Set Tuple can represent both
possibilities.
2.4.2
Pattern Discovery
Given a set of instances of a particular scenario, and two performance thresholdsTf a s t and
Ts l o w as inputs, the causality analysis adapts contrast data mining, and works in three steps:
(1) classifying contrast classes, (2) constructing data abstractions, and (3) mining contrast
patterns.
2.4.2.1 Classifying Contrast Classes
The causality analysis first classifies these instances into two contrast classes{I}f a s t and
{I}s l o w by comparing their recorded execution time against performance thresholdsTf a s t
andTs l o w. In practice, developers need to explicitly specify the two thresholds for each
application scenario as a part of performance specification. Specifically,Tf a s t is the upper
bound reflecting normal performance, andTs l o w is the lower bound of performance
degra-dation. For example, theBrowserTabCreatescenario of a web browser should be completed within 300ms, and should not exceed 500ms, which typically makes users feel slow. In this
case,Tf a s t =300m s andTs l o w =500m s, so the two classes would beless-than-300msas the
fast class andmore-than-500msas the slow class. The contrasts between the two classes are highly suspicious to be the constitution of performance problems. Typically we have