ABSTRACT
SUNG, JOO-KYUNG. Understanding Winter Visitation to Yellowstone National Park Using Revealed and Stated Preference Modeling. (Under the direction of Daniel J. Phaneuf.)
This research provides information needed to help resolve winter management issues
at Yellowstone National Park (YNP) and also addresses methodological issues in non-market
valuation. The first essay examines the effect of the temporary plan on heterogeneous
snowmobile riders and guide service providers both theoretically and empirically. I find
theoretically that this policy benefits guided tour providers by increasing their producer
surplus and rents. Snowmobile riders are worse off because snowmobile entries are
restricted and the price of a snowmobile trip increases. I estimate the demand for
snowmobile entries into YNP using a variation of the method for a recreation RUM model. I
find that the estimate of avoiders’ consumer surplus loss from the restriction on snowmobile
access is $290,000 for a winter season.
The second and third essays estimate winter visitors’ preferences and welfare impact
of snowmobile policy changes at YNP using choice experiment data. The two essays,
however, incorporate different pieces of data to model preferences and examine the values of
additional information collected in the choice experiment questions. The extra information
provides interesting insights on visitors’ behavior. I find that the detailed information makes
Understanding Winter Visitation to Yellowstone National Park
Using Revealed and Stated Preference Modeling
by
Joo-Kyung Sung
A dissertation submitted to the Graduate Faculty of North Carolina State University
In partial fulfillment of the Requirements for the Degree of
Doctor of Philosophy
Economics
Raleigh, North Carolina
2008
Approved by:
_______________________________ ______________________________ Daniel J. Phaneuf Roger H. von Haefen
Committee Chair
DEDICATION
To Mom and Dad
BIOGRAPHY
Joo-Kyung Sung was born in South Korea on July 28th, 1979. After graduating from
Berlin-Potsdam International School in 1999, Joo-Kyung came to the U.S. for college
education. She attended Southeast Missouri State University, where she received her
Bachelor of Science degree in Economics in 2002. She then moved to Raleigh, North
Carolina to pursue Ph.D. in Economics. Joo-Kyung married SungJae Yoo on May 26th, 2007
in Seoul, Korea and they are expecting a baby boy in April, 2008.
ACKNOWLEDGMENTS
First, I would like to thank my advisor, Dr. Daniel Phaneuf for his thorough guidance,
support and encouragement. I am especially thankful to him for bearing with me while I was
going through major changes. He is the best advisor who taught me how to become a good
researcher, teacher, and colleague. I am also thankful to my official and unofficial
committee members: Dr. Walter Thurman, Dr. Raymond Palmquist, Dr. Roger von Haefen,
and Dr. Carol Mansfield for their valuable suggestions.
Second, I thank my parents and brother for their unconditional love, prayer, and
support. They always believed in me and encouraged me to get this far. I am also grateful to
my family-in-law for their understanding and support. My husband helped me to go through
the last stage of the dissertation with his love, patience and sense of humor. I love you very
much and it was the best decision I have made in my life to get married to you! My graduate
school experience was enjoyable and memorable because of my wonderful classmates,
friends, and church members. Especially, I would like to thank Rotua and Nasim for their
friendship.
Last, but definitely not least, I thank my Lord for blessing me with these wonderful
people and enriching my life. I am excited to see how you will lead my life next.
TABLE OF CONTENTS
LIST OF TABLES... ix
LIST OF FIGURES ... xii
1. INTRODUCTION ...1
1.1. Policy Issues...2
1.2. Case Study: Yellowstone National Park (YNP) ...4
1.3. History of Winter Use...5
1.4. Objectives of Dissertation...7
2. SURVEY AND DATA...9
2.1. Recent Trip Behavior...11
2.2. Revealed Preference Questions...13
2.3. Choice Experiment Questions...14
2.4. Stated Behavior Questions...15
3. THE ALLOCATION OF SNOWMOBILE ENTRANCE RIGHTS AND GUIDE SERVICES IN YNP ...25
3.1. Introduction...25
3.2. A Theoretical Model ...29
3.2.1 The Derived Demand for YNP Entries...29
3.2.2 Heterogeneous Preferences for Guided Tours ...29
3.2.3 Welfare Effects of Policy Change: Who Loses and Who Gains?...30
3.3. Data ...33
3.4. Model Estimation...33
3.5. Results...38
3.6. Conclusion ...39
4. ARE THERE ANY ADVANTAGES IN COLLECTING DETAILED INFORMATION IN CHOICE EXPERIMENTS? ...50
4.1. Introduction...50
4.2. Objectives ...51
4.3. Literature Review...52
4.4. Data ...58
4.5. Model Estimation...60
4.5.1. Methods...60
4.5.2. Results...64
4.6. Welfare Analysis...68
4.6.1. Methods...68
4.6.2. Results...71
4.7 Conclusion ...76
5. A DISCRETE-COUNT MODEL OF YELLOWSTONE VISITORS’
PREFERENCES ...97
5.1. Introduction...97
5.2. Literature Review...98
5.3. Data ...102
5.4. Model Estimation...104
5.4.1. Motivation...104
5.4.2. Model Setup ...106
5.4.3. Methods...109
5.4.4. Results...113
5.5. Welfare Analysis...116
5.5.1. Methods...117
5.5.2. Results...118
5.6. Conclusion ...119
REFERENCES ...131
APPENDICES ...136
Appendix A. A Typical Day on a Visitor’s Recent Trip ...137
Appendix B. Visitors’ Snowmobile Trips in the Previous Year – “Experienced Snowmobile Riders” Version ...138
Appendix C. Visitors’ Winter Recreation Trips in the Previous Year – “All Others” Version...140
Appendix D. A Sample Choice Experiment Question...142
Appendix E. A Sample Stated Behavior Question ...143
LIST OF TABLES
Chapter 2
Table 2.1 Information on Visitors’ Recent Trip ...16
Table 2.2 A Typical Day of the Most Recent Trip to GYA Parks...17
Table 2.3 Things Respondents Would Like to Change About Their Recent Trip...19
Table 2.4 Information on Visitors’ Overall Trips during 02-03 Winter Season...19
Table 2.5 Top Ten Most Visited Sites to Experienced Snowmobile Riders...20
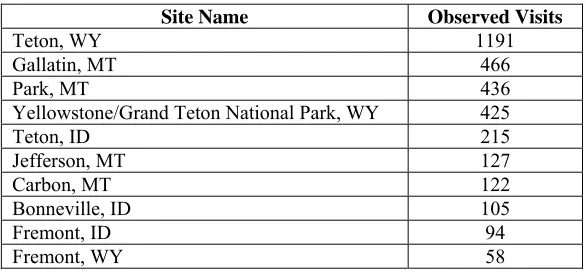
Table 2.6 Top Ten Most Visited Sites to All Others ...20
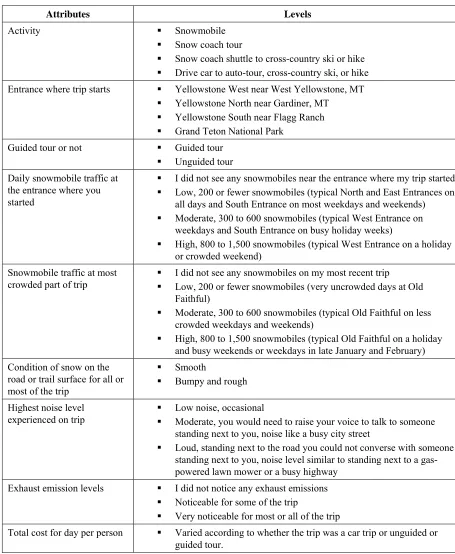
Table 2.7 Attributes and Levels for Choice Experiment Design ...21
Table 2.8 Percentages of Alternatives Chosen by Respondents ...22
Table 2.9 Respondents’ Opt-Out Behavior...22
Table 2.10 Effects of Different Management Plans on the Recent Trips ...23
Table 2.11 Effects of Different Management Plans on the Total Visits ...24
Chapter 3 Table 3.1 Daily Snowmobile Entry Limits in Yellowstone National Park...41
Table 3.2 Frequencies of Each Entrance Usages ...41
Table 3.3 The RUM Results with a Full Sample ...42
Table 3.4 The RUM Results with a Restricted Sample ...43
Table 3.5 Willingness to Pay and Price Elasticities for Access to YNP...44
Table 3.6 Consumer Surplus Losses from Site Closure and Entry Restriction ...44
Chapter 4 Table 4.1 Percentages of Alternatives Chosen by Respondents ...78
Table 4.2 Details about Respondents’ Opt-Out Behavior...78
Table 4.3 Medians of the Park Ambient Condition ...78
Table 4.4 Self-Reported Park Ambient Condition...79
Table 4.5 Conditional Logit Results with a Single Opt-Out Option...80
Table 4.6 Conditional Logit Results with Detailed Opt-Out Options...81
Table 4.7 Mixed Logit Results with Detailed Opt-Out Options (1) ...82
Table 4.8 Mixed Logit Results with Detailed Opt-Out Options (2) ...84
Table 4.9 Mixed Logit Results with a Single Opt-Out Option ...86
Table 4.10 Choice Alternatives under Baseline Conditions – A Single Opt-Out Option...88
Table 4.11 Choice Alternatives under Baseline Conditions – Detailed Opt-Out Options....89
Table 4.12 Self-Reported Park Conditions and Welfare Scenarios ...90
Table 4.13 Assumed Park Conditions and Welfare Scenarios...91
Table 4.14 Per Choice Occasion Welfare Effect using Self-Reported Baseline Conditions ...92
Table 4.15 Ranking of Proposed Policies’ Effects with Self-Reported Baseline Conditions ...92
Table 4.16 Per Choice Occasion Welfare Effect using Assumed Baseline Conditions – A
Single Opt-Out Option...93
Table 4.17 Per Choice Occasion Welfare Effect using Assumed Baseline Conditions – Detailed Opt-Out Options ...94
Table 4.18 Ranking of Proposed Policies’ Effects with Assumed Baseline Conditions ...95
Table 4.19 Ranking Comparisons between Self-Reported and Assumed Baseline Conditions ...96
Chapter 5 Table 5.1 Number of Days Respondents Would Spend on Their Chosen Trip ...122
Table 5.2 Percentages of Number of Days Reported by Respondents ...122
Table 5.3 Results for Discrete-Count, Simple Model...123
Table 5.4 Results for Discrete-Only, Simple Model...124
Table 5.5 Results for Discrete-Count, User-Type Specific Model ...125
Table 5.6 Results for Discrete-Only, User-Type Specific Model...127
Table 5.7 Per Choice Occasion Welfare Effect using Discrete-Count, Simple Model ....129
Table 5.8 Per Choice Occasion Welfare Effect using Discrete-Count, User-Type Specific Model ...129
Table 5.9 Ranking of Proposed Policies Effects – Discrete-Count, Simple Model...130
Table 5.10 Ranking of Proposed Policies Effects – Discrete-Count, User-Type Specific Model ...130
LIST OF FIGURES
Chapter 3
Figure 3.1 Derived Demand for YNP Entries ...45
Figure 3.2 Preferences for Guided Tour Lovers, Avoiders, and Neutrals...45
Figure 3.3 Guide Lovers and Avoiders Markets ...46
Figure 3.4 A Limit on the Number of Snowmobiles in the Park with Guided Tour Requirement...47
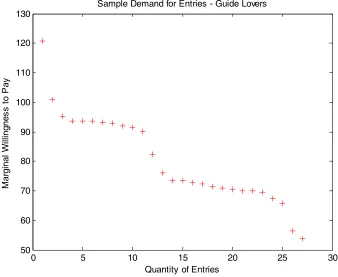
Figure 3.5 The Sample Demand for Entries for Guided Tour Lovers ...48
Figure 3.6 The Sample Demand for Entries for Guided Tour Avoiders...48
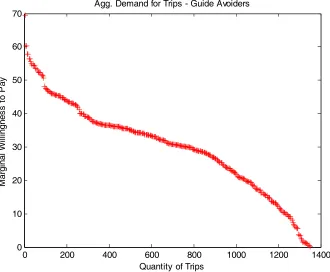
Figure 3.7 The Aggregate Demand for Trips for Guide Avoiders on the Weekend...49
Figure 3.8 The Aggregate Demand for Trips for Guide Avoiders on a Weekday ...49
1
CHAPTER 1
INTRODUCTION
To preserve natural wonders of the U.S. such as Yosemite Valley, the geysers of
Yellowstone, the Giant Sequoia trees, and Mount Rainier, the federal government designated
these areas as national parks, starting with Yellowstone in 1872. National parks not only
preserve cultural and historical heritage and wilderness but also provide a variety of
recreation opportunities. Visitors to national parks can enjoy many kinds of activities
including wildlife viewing, learning, hiking, camping, picnicking, cross-country skiing,
mountain climbing, swimming, white-water rafting, and snowmobiling. Most activities are
non-consumptive and are enhanced by wilderness and healthy wildlife populations. These
activities are, however, congestible: one person’s activities crowd other peoples’ activities
and therefore reduce the benefits received from their own activities (Turner, 2000).
Some activities, especially those involving motorized vehicles, impose externalities
on other visitors. ‘Flight’-seeing by aircraft, personal watercraft (often called jet-skis) in
rivers and lakes, snowmobiles and motor bikes in some parks create noise, water, and air
pollution. For example, visitors to Grand Canyon National Park can take an air tour to view
the scenery. These flights generate noise and disturb other visitors on the ground. Jet skis,
which are allowed in many national parks, recreation areas, and seashore water bodies, not
only generate noise but also discharge small amounts of gasoline and oil directly into the
water. Another example is snowmobiles, which are allowed in 28 national park managed
non-2
motorized activities such as wildlife viewing and cross-country skiing. Snowmobiles also
have an effect on wildlife migration and can threaten wildlife populations in the parks. For
example, snowmobile noise and trail grooming push bison out of the parks, where they can
become a nuisance to surrounding agriculture. Because there is a risk to livestock outside of
the park from the transmission of brucellosis from bison, the Montana Department of
Livestockhaze bison back inside park boundaries. They also capture, test for exposure to
brucellosis, and ship animals to slaughter if they test positive.
These examples suggest there are multiple and occasionally competing uses of public
lands in general and national parks in particular. Two types of conflicts have arisen from
these competing uses: tension between the wilderness preservation and visitor use missions
of the parks, and tensions between different types of park visitors.
1.1. POLICY
ISSUES
In 1987 Congress asked the Federal Aviation Administration (FAA) to regulate flights over
the Grand Canyon National Park. Unfortunately, the FAA has been unable to get the
National Park Service (NPS) and air tour operators to agree on a workable plan. The NPS,
however, did ban jet skis from most national park water bodies and placed restrictions on
their use at national recreation areas and seashores where they are allowed. Once motorized
recreation is allowed, the business and customer constituencies make it difficult to phase out
the activity unless it directly threatens human health or the environment as in the jet ski case.
It seems that it would be easier to prevent establishment of motorized activity from the start.
3
delegation worked with the FAA and others to put in place a ban on tour planes and
helicopters over the park to prevent establishment of such a tour industry (Loomis, 2002).
There exist multiple competing uses of park resources among the visitors and the
conflicts between them can become serious. How can these competing activities be managed
efficiently in a national park? The current situations in Grand Canyon and Yellowstone
National Parks demonstrate that it is difficult to find compromise solution to these conflicts.
Turner (2000) developed a model for managing multiple activities in a national park using
the theory of club goods1. He assumes that the benevolent social planner maximizes
society’s welfare, accounting for both visitors’ and non-visitors’ preferences, to find the
socially efficient allocation of park resources. He illustrates that since different activities
lead to different direct and external (the increase in congestion and impact on wilderness)
costs, they should be regulated individually. One way to regulate activities individually is
with tolls that differ by activities. Tolls should be higher for activities with high direct and
external costs. Turner shows that once the efficient toll on each activity is imposed, there is
no need for an entrance fee and that for an activity to be prohibited in the park there should
be private substitutes available outside the park. However, in order to apply his theory in
practice, a considerable amount of information is required. Park managers need the
following information in order to reach an efficient decision.
Effects of an activity on congestion of the same activity
Effects of an activity on congestion of the other activities
Effects of wilderness protection on congestion of each activity
Effects of park size on congestion of each activity
Effects of each activity on wilderness
Effects of park size on wilderness
1 A club good is a good that is excludable, nonrival and congestible such as recreation activities in national
4
Value of effects on direct park costs of each activity
Value of effects on direct park costs of park size
Value of effects on visitor enjoyment of congestion of each activity
Value of effects on visitor enjoyment of wilderness
Value of effects on visitor enjoyment of park size
Value to public at large of wilderness
1.2.
CASE STUDY: YELLOWSTONE NATIONAL PARK
This research focuses on Yellowstone National Park (YNP) as an example of multiple and
competing uses of public land. YNP was established in 1872 and welcomes over 3 million
visitors on average per year. YNP is home to thousands of active thermal features, including
the famous Old Faithful Geyser. It is also known for the spectacular Grand Canyon of the
Yellowstone. Yellowstone provides wilderness and an open refuge for wildlife, including
grizzly bear, elk, American bison, moose and wolf. In addition to YNP, the Greater
Yellowstone Area (GYA) includes the Great Teton National Park (GTNP) and the John D.
Rockefeller, Jr., Memorial Parkway. The GYA parks are ideal for various recreational
activities such as snowmobiling, cross-country skiing, downhill skiing, hiking, and wildlife
viewing. The vast majority of visitors come to YNP during summer season, and about
140,000 people visit in winter. Over 60% of winter season visitors ride snowmobiles, and an
average of 765 snowmobiles entered YNP each day prior to the 2003-04 season. During the
busiest holiday weekends, as many as 1,500 machines enter the park each day (Mansfield et
al., forthcoming).
The multiple and partially competing uses of the parks have resulted in conflicts
between visitors. Supporters of snowmobiles claim that snowmobiles provide not only
5
the park’s winter scenery. A visitor to YNP called snowmobiles a "great way to be able to
see the landscape" (USA Today, February 16, 2006). Snowmobiling is also important for
snowmobile manufacturers and a handful of Yellowstone gateway communities (The
Economist, July 7, 2001). However, snowmobiles have contributed to crowding, noise,
bumpy roads, and exhaust fumes in the park, which impose costs on visitors who would like
to enjoy other activities such as wildlife viewing and cross-country skiing. Snowmobiles
also disturb the wilderness ambience, threaten the wildlife population in the park, and impose
potential health and safety risks. A number of park employees have complained that
snowmobiles, which smell like “raw gasoline and fermented manure” and make a loud noise
like “a forest of chain saws”, made them ill and caused them to wear masks (TheWashington
Post Magazine, 2002). Since the snowmobile conflict at YNP involves various stakeholders
such as snowmobile enthusiasts, traditional recreationists, environmentalists, local businesses,
snowmobile industry, and politicians, the debates over snowmobiles have been controversial
and confusing.
1.3. HISTORY OF WINTER USE
Over the past 15 years several proposals and counter-proposals have been suggested as
potential management plans for winter visitation to solve the conflict surrounding the use of
snowmobiles in the GYA parks. The Winter Use Plan in 1990 allowed access to the GYA
parks by recreational snowmobile riders. In 1997, the Fund for Animals initiated a lawsuit
against the National Park Service (NPS), alleging the failure of NPS to conduct adequate
analysis under the National Environmental Policy Act (NEPA), to consider the impact of
6
on wildlife and other park resources. This lawsuit was settled, and the NPS was required to
conduct an Environmental Impact Statement (EIS). The EIS resulted in a Record of Decision
(ROD) which was signed on November 22, 2000. This new rule, published in the Code of
Federal Regulations on January 22, 2001, outlined a plan to phase out snowmobiles in the
parks. On December 6, 2000, the International Snowmobile Manufacturers Association filed
a lawsuit asking for the ROD to be set aside. The lawsuit was settled on June 29, 2001 with
requiring NPS to conduct a Supplemental Environmental Impact Statement (SEIS).
In March 2002, NPS published a proposed rule in the Federal Register to generally
delay for one year the phase-out of snowmobiles in the parks under the January 2001
snowmobile regulations. This “delay rule” was finalized in November 2002, and it allowed
additional time to complete the SEIS. This rule allowed continued snowmobile use through
the end of 2003-04 winter season with no other restrictions. On December 11, 2003, the NPS
published a new final rule which required strict daily limit on the number of snowmobile, but
on December 16, 2003, a judge in Washington DC ordered the NPS to implement the
January 2001 rule which bans snowmobiles from the parks. In February 2004, a Wyoming
federal judge re-opened and restated his original ruling that the 2001 NPS rule to phase-out
snowmobiles was invalid. He also ordered NPS to allow more snowmobiles into the parks.
This created confusion among YNP gateway communities, park staff, and snowmobile riders.
Thus, NPS developed a temporary winter use plan, which was finalized in November 2004.
This plan imposed daily limits on snowmobiles in YNP and GTNP and required all
snowmobiles be part of a commercially guided group. Under this plan, snowmobiles are also
7
considering new final regulations to replace the temporary winter use plan. This sequence of
lawsuits, court decisions, and agreements to this point is summarized below.
A 1997 lawsuit by the Fund for Animals against the National Park Service (NPS) for NEPA violations which forced NPS to conduct an environmental impact statement (EIS) on the impact of snowmobiles in the parks.
Announcement in 2000 of rules outlining a phase-out of snowmobiles
A lawsuit in December 2000 by the International Snowmobile Manufacturers Association asking that the phase-out rules be nullified.
Establishment in December 2003 of rules limiting the daily numbers of snowmobiles that can enter the GYA parks, followed by federal court actions challenging this rule in favor of both more and less restrictive access policies.
Development of a temporary winter use plan imposing daily limits on snowmobiles and requiring all snowmobiles to be in a commercially guided group and to meet the best available technology
1.4. OBJECTIVES OF DISSERTATION
My dissertation has two broad objectives. One is to provide information needed to help
resolve winter management issues at YNP. An efficient solution to this conflict requires a
thorough understanding of the costs and benefits to different types of park visitors of changes
in management plans. Various market valuation methods can be used to examine
non-market values for park visits and attributes of the park. Among these I will focus on two
methods: travel cost models for valuing park days at baseline conditions; and choice
experiment models for understanding the importance of park attributes in visitors’ decisions
and values for park visits.
The second objective is to address methodological issues in non-market valuation. I
will use several recent econometric and data combining innovations to improve inference
from the two non-market valuation methods. In particular, I will adopt Murdock’s (2006)
8
choice experiment models with a richer specification of the opt-out option, and provide an
improved approach to welfare analysis using respondents’ subjective assessment of the
current trip as individual-specific baseline utility. Lastly, I will adopt a discrete-continuous
framework to estimate both the choice of trip type and its length in days using Bayesian
procedures.
The 2002-03 winter survey data, which will be described in the next chapter, provides
the base information needed to pursue these two objectives. My research will contribute to
the policy debate involving YNP by providing additional information about how visitors will
react to the alternative winter plans and also complement the existing non-market valuation
methodology.
The rest of this dissertation is structured as follows. The next chapter describes the
survey and the resulting data. Chapter 3 examines the effect of the temporary plan on
heterogeneous snowmobile riders and guide service providers both theoretically and
empirically using a modified Random Utility Maximization Model (RUM) method. Chapter
4 and 5 estimate winter visitors’ preferences and welfare impact of snowmobile policy
changes at YNP using choice experiment data. The two chapters, however, incorporate
different pieces of data to model visitors’ preferences and examine the values of additional
9
CHAPTER 2
SURVEY AND DATA
Researchers at RTI International, with support and funding from NPS staff, surveyed visitors
to Yellowstone and Grand Teton National Parks during the 2002-2003 winter season. The
survey was designed to enable a benefit-cost analysis of the alternative winter management
plans under consideration by NPS. The alternatives this survey considered are
a ban on snowmobiles,
a cap on the number of snowmobiles allowed in each day and a requirement that snowmobiles be on a guided tour, and
a cap on the number of snowmobiles allowed in each day but no requirement for guided tours.
Visitors to YNP were sampled throughout the season at all four entrances (East, West, North
and South) open during the winter. The sampling goal was to create a probability-based
sample that could be weighted to reflect the true population of winter visitors to YNP. The
survey took place in two phases. First, visitors were intercepted in the park according to the
sampling rate and asked three short screening questions as follows.
1. On this trip, are you staying away from home overnight? ___ Yes, I am staying away from home overnight on this trip ___ No, I am here on a day trip
2. Are you snowmobiling in the park during this trip [if visitor is in a wheeled vehicle]? ___ Yes
___ No
3. If you are riding a snowmobile on this trip, is this trip the first time you have ridden a snowmobile? ___ Yes, this trip is my first time on a snowmobile
___ No, I have ridden a snowmobile before
10
The main survey was then mailed to the visitors who provided their name and address. There
were four versions of the main survey:
Local, experienced snowmobile rider
Non-local, experienced snowmobile rider
Local, all others
Non-local, all others
The answer to the screening questions determined which of four versions of the survey was
sent to the respondents. Locals include visitors who were on a day trip, and non-locals are
those who were on an overnight trip. An experienced snowmobile rider is a person riding a
snowmobile in the park the day he was intercepted who is not a first-time rider. All others
include people not riding a snowmobile in the park or first-time snowmobile riders. The
survey contains four sets of questions: questions about the visitor’s recent trip including
activities, the area he visited, and expenditures; questions about previous year’s winter
recreation (2001–2002); stated preference choice experiment and stated behavior questions;
and demographic questions.
Overall, 92 percent of the visitors approached in YNP provided their contact
information, and 80 percent of the mailed surveys were returned. The total number of
respondents is 1,552. The sample can be divided into four groups depending on the survey
version they filled out: locals (23.39%); non-locals (76.61%); experienced snowmobile riders
(40.46%); and all others (59.54%). Respondents can also be grouped into snowmobile riders
(56.88%) and non-snowmobile riders (43.12%), where riders include both experienced and
11
2.1. RECENT
TRIP
BEHAVIOR
About 30 percent of the respondents stated that they visited the parks on a day trip, and the
other 70 percent were multi-day trip takers2. There are more one-day trip takers among all
others (35.5%) than among experienced snowmobile riders (20.6%). Also, non-snowmobile
riders (41.22%) took more single day trips than snowmobile riders (20.46%). Table 2.1
describes information on individuals’ recent trips to the GYA parks and the surrounding
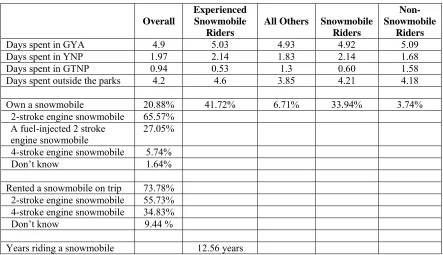
areas. The average length of a multiple day trip was almost 5 days. Visitors spent most of
their days outside the GYA parks, with about 2 days spent inside YNP. About 20 percent of
the sample owns a snowmobile, and 65 percent of the snowmobile owners own the 2-stroke
engine snowmobiles. Only 5 percent owns a 4-stroke engine snowmobile, which produces
less noise and air pollution.
The most popular primary activity of snowmobile riders’ recent trip was, not
surprisingly, snowmobiling. However, only 10 percent of riders indicated their recent
snowmobiling experience involved a commercially guided tour. Non-riders’ most popular
primary activity was cross-country skiing (39%). Snowcoach tour of park sights (16%),
driving tour of park sights in a car (12%), and downhill skiing (11%) followed cross-country
skiing as primary activities.
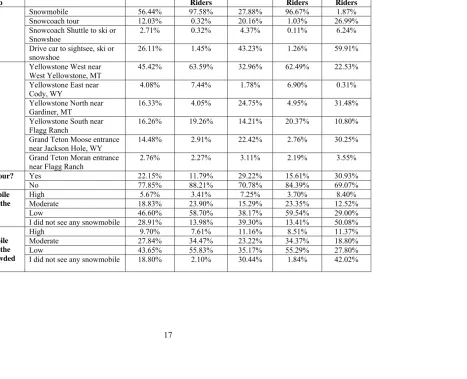
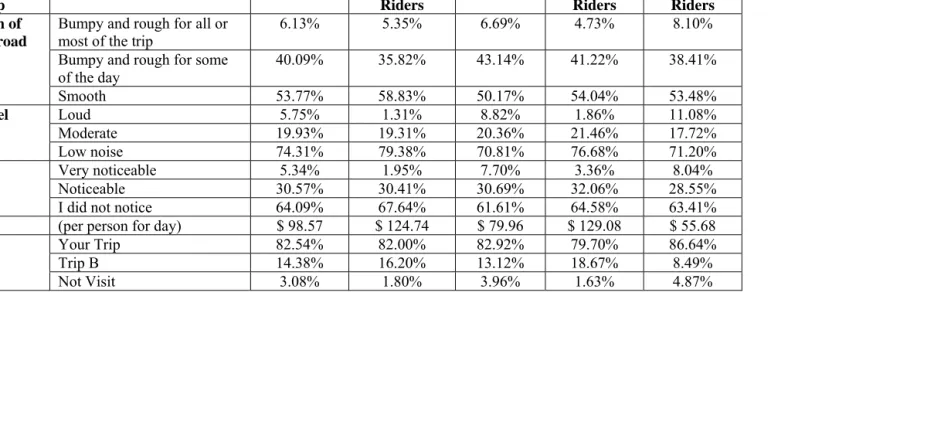
The survey asked visitors to describe a typical day on their recent visit using nine
attributes that describe the parks’ condition (appendix A). Table 2.2 presents the attributes
and levels of attributes used and summary statistics of respondents’ answers. Once
2 Respondents were asked to indicate whether they were on a day trip or a multiple-day trip. This “trip length”
12
respondents described their most recent trip using these attributes and levels, they were
offered an alternative trip consisting of fixed levels of the attributes and the option of not
visiting. Then, they were asked whether they would prefer the trip they just took, the
alternative trip, or whether they would stay home. The alternative trip’s characteristics are as
follows:
Activity - snowmobile;
Entrance - Yellowstone West entrance,
Tour - unguided,
Snowmobile traffic at the entrance - low
Snowmobile moderate level of snowmobile traffic at the most crowed area - moderate,
Snow condition - smooth,
Noise level - moderate,
Level of exhaust emissions - noticeable, and
Cost per person for day - $100.
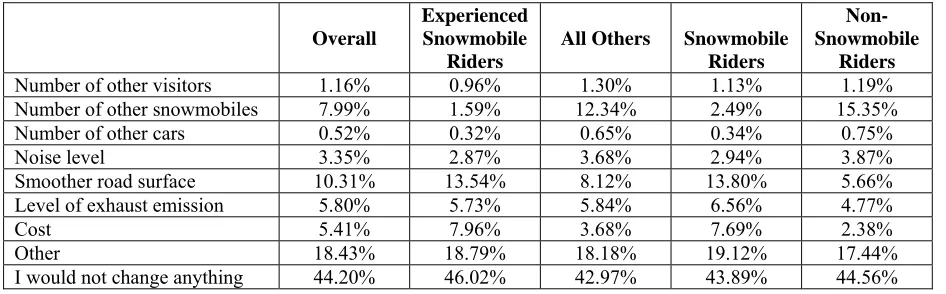
The survey also asked respondents what they would change about a feature of their
recent trip if they could (table 2.3). About 44 percent of the respondents reported that they
would not change anything about their recent trip. However, 14 percent of snowmobile
riders would like to have a smoother road surface, and 15 percent of non-riders wanted to see
fewer snowmobiles in the parks. Both groups would like to change the level of exhaust
emissions. This suggests that snowmobiles impose externalities not only on non-snowmobile
riders but also on other riders.
The survey asked about the number of trips to GYA parks respondents took so far
during 2002-2003 winter season and about any additional trips they plan to take during the
rest of that season. Table 2.4 summarizes this information. Both experienced snowmobile
riders and all others anticipated they would visit and stay in the GYA parks for about 6.5
days, but experienced riders allocated that time more to days in YNP and all others more to
13
2.2. REVEALED
PREFERECE QUESTIONS
The experienced snowmobile version of the survey listed 52 snowmobile sites in Idaho,
Montana, and Wyoming with a map showing these locations (appendix B). These 52 sites
represent the set of snowmobile riding alternatives that would be available to potential YNP
and GTNP visitors. Survey respondents were asked to provide information on the number of
trips they made during the 2001-2002 winter season to the sites included in the choice set.
There are 628 people who answered the experienced snowmobile version of the
questionnaire, and 307 of them indicated that they visited at least one of the snowmobile sites
in the choice set during the previous winter season. Table 2.5 provides a summary of the
visits to the 10 most frequently visited sites. The most visited site is YNP with 304 observed
visits, and overall experienced snowmobile riders took an average of 6.53 trips per year.
The “all others” version of the survey asked respondents about their winter trips for
cross-country skiing, snowshoeing, hiking, and camping in winter 2001-2002 (appendix C).
They were given a map with 36 counties surrounding YNP and GTNP and asked to list
counties they visited and the number of trips they made in these counties during the last
winter season. There were 924 people who filled out the “all others” version, and only 262
of them indicated they visited at least one county among the choice set during the previous
winter season. They took an average of 13.46 trips per year, and the median is seven trips
per year. Teton County in WY is most frequently visited by all others, and YNP and GTNP
14
2.3. CHOICE EXPERIMENT QUESTIONS
The choice experiment questions, also referred as the conjoint questions, asked respondents
to choose between two hypothetical and experimentally designed trips, where the trips were
described by attributes related to activity and park conditions (appendix D). If one of the
hypothetical trips was chosen, respondents were asked to indicate the number of days they
would spend on the chosen trip. The nine attributes presented in table 2.7 were used to
describe the trip and park conditions, but only seven of them varied in any given pair of trips
to reduce respondents’ cognitive burden. There were six choice questions per respondent.
Respondents were also given the option of not visiting (the opt-out option). If the opt-out
option was selected, she was asked a follow-up question about what she would most likely do
instead. The choices were:
Stay at home: I would not travel to the GYA
Travel to the GYA to snowmobile outside the parks
Travel to the GYA to cross-country ski outside the parks
Travel to the GYA to downhill ski at Big Sky or one of the ski areas near Jackson Hole
Other
Table 2.8 shows the percentages of each choice chosen by respondents. About a half
of the respondents chose the not-visit option, and snowmobile riders, especially experienced
snowmobile riders are the more likely to opt out (60.44%). Among the snowmobile riders
who chose the opt-out option, about 40 percent answered they would visit other sites in the
GYA to continue snowmobiling. For non-snowmobile riders, cross-country skiing (58.59%)
was the most likely activity to do when they opted out. “Stay-at-home” was a popular option
15
2.4. STATED BEHAVIOR QUESTIONS
There are three sets of stated behavior questions for alternative management proposals
(appendix E). Each respondent was presented with a single management plan and asked how
this proposal would impact his current trip and also trips over the entire season. The
attributes that described winter use plans here correspond to the stated choice experiment
questions. For the question that asked about the effect of a policy change, i.e. banning
snowmobiles, on respondents’ current trip, the following four options were given:
My visit would not have been different
I would have stayed fewer days Æ how many fewer days? _______
I would have stayed more days Æ how many more days? _______
I would not have visited the park
To obtain information on the impacts of different management plans on visits over the entire
season, respondents were presented with the following four options:
No change in total visits
I would visit less often Æ I would take _______ fewer annual trips
I would visit more often Æ I would take _______ more annual trips
I would not visit Yellowstone and Grand Teton National Parks.
Impacts of the different management plans on the recent trip and on the total visits are
presented in tables 2.10 and 2.11, respectively. The largest change comes from the proposal
of banning snowmobiles and the smallest change comes from just capping the numbers of
snowmobiles. Under the ban, 85 percent of experienced snowmobile riders say they would
not visit the park whereas 16 percent of all others say they would increase the number of
16 Table 2.1: Information on Visitors’ Recent Trip
Overall
Experienced Snowmobile
Riders
All Others Snowmobile Riders
Non- Snowmobile
Riders
Days spent in GYA 4.9 5.03 4.93 4.92 5.09 Days spent in YNP 1.97 2.14 1.83 2.14 1.68 Days spent in GTNP 0.94 0.53 1.3 0.60 1.58 Days spent outside the parks 4.2 4.6 3.85 4.21 4.18 Own a snowmobile 20.88% 41.72% 6.71% 33.94% 3.74% 2-stroke engine snowmobile 65.57%
A fuel-injected 2 stroke
engine snowmobile 27.05% 4-stroke engine snowmobile 5.74%
Don’t know 1.64% Rented a snowmobile on trip 73.78% 2-stroke engine snowmobile 55.73% 4-stroke engine snowmobile 34.83% Don’t know 9.44 %
17
Table 2.2: A Typical Day of the Most Recent Trip to GYA Parks
Features of Trip
Respondent’s Trip Overall
Experienced Snowmobile
Riders
All Others Snowmobile Riders
Non- Snowmobile
Riders
Snowmobile 56.44% 97.58% 27.88% 96.67% 1.87%
Snowcoach tour 12.03% 0.32% 20.16% 1.03% 26.99%
Snowcoach Shuttle to ski or
Snowshoe 2.71% 0.32% 4.37% 0.11% 6.24%
Activity
Drive car to sightsee, ski or
snowshoe 26.11% 1.45% 43.23% 1.26% 59.91%
Yellowstone West near West Yellowstone, MT
45.42% 63.59% 32.96% 62.49% 22.53%
Yellowstone East near
Cody, WY 4.08% 7.44% 1.78% 6.90% 0.31%
Yellowstone North near
Gardiner, MT 16.33% 4.05% 24.75% 4.95% 31.48%
Yellowstone South near
Flagg Ranch 16.26% 19.26% 14.21% 20.37% 10.80%
Grand Teton Moose entrance near Jackson Hole, WY
14.48% 2.91% 22.42% 2.76% 30.25%
Entrance
Grand Teton Moran entrance
near Flagg Ranch 2.76% 2.27% 3.11% 2.19% 3.55%
Yes 22.15% 11.79% 29.22% 15.61% 30.93%
Guided tour?
No 77.85% 88.21% 70.78% 84.39% 69.07%
High 5.67% 3.41% 7.25% 3.70% 8.40%
Moderate 18.83% 23.90% 15.29% 23.35% 12.52%
Low 46.60% 58.70% 38.17% 59.54% 29.00%
Snowmobile traffic at the entrance
I did not see any snowmobile 28.91% 13.98% 39.30% 13.41% 50.08%
High 9.70% 7.61% 11.16% 8.51% 11.37%
Moderate 27.84% 34.47% 23.22% 34.37% 18.80%
Low 43.65% 55.83% 35.17% 55.29% 27.80%
Level of snowmobile traffic at the most crowded area
18
Table 2.2 (continued)
Features of Trip
Respondent’s Trip Overall
Experienced Snowmobile
Riders
All Others Snowmobile Riders
Non- Snowmobile
Riders
Bumpy and rough for all or
most of the trip 6.13% 5.35% 6.69% 4.73% 8.10%
Bumpy and rough for some
of the day 40.09% 35.82% 43.14% 41.22% 38.41%
Condition of snow on road surface
Smooth 53.77% 58.83% 50.17% 54.04% 53.48%
Loud 5.75% 1.31% 8.82% 1.86% 11.08%
Moderate 19.93% 19.31% 20.36% 21.46% 17.72%
Noise level
Low noise 74.31% 79.38% 70.81% 76.68% 71.20%
Very noticeable 5.34% 1.95% 7.70% 3.36% 8.04%
Noticeable 30.57% 30.41% 30.69% 32.06% 28.55%
Level of exhaust
emission I did not notice 64.09% 67.64% 61.61% 64.58% 63.41%
Cost (per person for day) $ 98.57 $ 124.74 $ 79.96 $ 129.08 $ 55.68
Your Trip 82.54% 82.00% 82.92% 79.70% 86.64%
Trip B 14.38% 16.20% 13.12% 18.67% 8.49%
Choice
19
Table 2.3: Things Respondents Would Like to Change about Their Recent Trip
Overall
Experienced Snowmobile
Riders
All Others Snowmobile Riders
Non- Snowmobile
Riders
Number of other visitors 1.16% 0.96% 1.30% 1.13% 1.19% Number of other snowmobiles 7.99% 1.59% 12.34% 2.49% 15.35% Number of other cars 0.52% 0.32% 0.65% 0.34% 0.75% Noise level 3.35% 2.87% 3.68% 2.94% 3.87% Smoother road surface 10.31% 13.54% 8.12% 13.80% 5.66% Level of exhaust emission 5.80% 5.73% 5.84% 6.56% 4.77%
Cost 5.41% 7.96% 3.68% 7.69% 2.38% Other 18.43% 18.79% 18.18% 19.12% 17.44% I would not change anything 44.20% 46.02% 42.97% 43.89% 44.56%
Table 2.4: Information on Visitors’ Overall Trips during 02-03 Winter Season
Overall
Experienced Snowmobile
Riders
All Others Snowmobile Riders
Non- Snowmobile
Riders
Number of days in GYA so far 5.63 5.73 5.55 5.39 5.98 Additional days to GYA 0.89 0.79 0.97 0.68 1.22 Anticipated total number
of days in GYA 6.52 6.52 6.52 6.07 7.20
Number of days in YNP 2.05 2.29 1.88 2.21 1.81 Additional days to YNP 0.63 0.35 0.82 0.34 0.98 Anticipated total number
of days in YNP
2.68 2.64 2.7 2.55 2.79
Number of days in GTNP 1.44 0.64 1.98 0.68 2.46 Additional days in GTNP 0.92 0.28 1.35 0.32 1.69 Anticipated total number
20
Table 2.5: Top Ten Most Visited Sites to Experienced Snowmobile Riders
Site Name Observed Visits
Yellowstone/Grand Teton National Parks, WY 304 West Yellowstone, MT 298 Continental Divide Togwotee, WY 210 Big Springs Area Trails, ID 156 Bozeman/Big Sky, MT 98 Ashton Area Trail, ID 96 Continental Divide Gros Ventre, WY 74 Bear Tooth, WY 58 Wyoming Range Afton, WY 55 Snowy Range, WY 54
Table 2.6: Top Ten Most Visited Sites to All Others
Site Name Observed Visits
Teton, WY 1191
Gallatin, MT 466
Park, MT 436
Yellowstone/Grand Teton National Park, WY 425
Teton, ID 215
Jefferson, MT 127
Carbon, MT 122
Bonneville, ID 105
Fremont, ID 94
21
Table 2.7: Attributes and Levels for Choice Experiment Design
Attributes Levels
Activity Snowmobile
Snow coach tour
Snow coach shuttle to cross-country ski or hike
Drive car to auto-tour, cross-country ski, or hike Entrance where trip starts Yellowstone West near West Yellowstone, MT
Yellowstone North near Gardiner, MT
Yellowstone South near Flagg Ranch
Grand Teton National Park Guided tour or not Guided tour
Unguided tour Daily snowmobile traffic at
the entrance where you started
I did not see any snowmobiles near the entrance where my trip started
Low, 200 or fewer snowmobiles (typical North and East Entrances on all days and South Entrance on most weekdays and weekends)
Moderate, 300 to 600 snowmobiles (typical West Entrance on weekdays and South Entrance on busy holiday weeks)
High, 800 to 1,500 snowmobiles (typical West Entrance on a holiday or crowded weekend)
Snowmobile traffic at most crowded part of trip
I did not see any snowmobiles on my most recent trip
Low, 200 or fewer snowmobiles (very uncrowded days at Old Faithful)
Moderate, 300 to 600 snowmobiles (typical Old Faithful on less crowded weekdays and weekends)
High, 800 to 1,500 snowmobiles (typical Old Faithful on a holiday and busy weekends or weekdays in late January and February) Condition of snow on the
road or trail surface for all or most of the trip
Smooth
Bumpy and rough Highest noise level
experienced on trip
Low noise, occasional
Moderate, you would need to raise your voice to talk to someone standing next to you, noise like a busy city street
Loud, standing next to the road you could not converse with someone standing next to you, noise level similar to standing next to a gas-powered lawn mower or a busy highway
Exhaust emission levels I did not notice any exhaust emissions
Noticeable for some of the trip
Very noticeable for most or all of the trip
22
Table 2.8: Percentages of Alternatives Chosen by Respondents
Choice Overall
Experienced Snowmobile
Riders
All Others Snowmobile Riders
Non- Snowmobile
Riders
TRIP A 25.26% 20.36% 28.62% 22.18% 29.38% TRIP B 20.78% 19.20% 21.86% 19.78% 22.11% Not Visit 53.97% 60.44% 49.52% 58.04% 48.51%
Table 2.9: Respondents’ Opt-Out Behavior
Opt-Out Choice
Overall
Experienced Snowmobile
Riders
All Others Snowmobile Riders
Non- Snowmobile
Riders
Stay Home 31.03% 39.70% 23.23% 38.80% 16.67% Snowmobile
in GYA 27.30% 42.32% 13.80% 40.16% 3.54%
Cross-Country Ski
in GYA 21.81% 1.87% 39.73% 1.91% 58.59% Downhill Ski
23
Table 2.10: Effects of Different Management Plans on the Recent Trips
Cap on Number of Snowmobiles
Cap on Number of Snowmobiles and
Guided Tour
Ban on snowmobiles
Overall population
Visit unchanged 76.60% 56.12% 40.54% Decrease days 1.33% 3.29% 2.68%
Average decrease in days 0.43 1.18 1.46
Increase days 4.79% 5.67% 11.89%
Average increase in days 1.64 1.85 3.62
Not visit 17.29% 34.92% 44.89%
Experienced Snowmobile Riders
Visit unchanged 63.82% 44.09% 10.32% Decrease days 1.97% 4.79% 3.87%
Average decrease in days 0.38 1.14 3.1
Increase days 1.32% 1.60% 0.65%
Average increase in days 1.81 0.69 0.17
Not visit 32.89% 49.52% 85.16%
All Others
Visit unchanged 85.27% 72.22% 51.13% Decrease days 0.89% 1.28% 2.26%
Average decrease in days 0.50 1.29 0.56
Increase days 7.14% 11.11% 15.84%
Average increase in days 1.95 2.39 3.92
Not visit 6.70% 15.38% 30.77%
Snowmobile Riders
Visit unchanged 67.62 45.41 11.42 Decrease days 1.90 4.59 4.84
Average decrease in days 0.56 1.13 2.10
Increase days 2.86 2.43 1.73
Average increase in days 1.33 0.88 0.69
Not visit 27.62 47.57 82.01
Non-Snowmobile Riders
Visit unchanged 87.95 78.29 67.86 Decrease days 0.60 0.57 0.65
Average decrease in days 0.2 1.4 0.11
Increase days 7.23 12.57 21.43
Average increase in days 2.54 4.22 1.88
24
Table 2.11: Effects of Different Management Plans on Total Visits
Cap on Number of Snowmobiles
Cap on Number of Snowmobiles and
Guided Tour
Ban on snowmobiles
Overall population
Visit unchanged 68.92% 51.93% 36.95% Decrease days 3.78% 6.79% 8.31%
Average decrease in days 0.63 1.08 1.07
Increase days 9.73% 7.52% 16.78 %
Average increase in days 1.40 1.65 2.89
Not visit 17.57% 33.76% 37.97%
Experienced Snowmobile Riders
Visit unchanged 74.89% 65.38% 45.45% Decrease days 3.65% 5.56% 7.27%
Average decrease in days 0.75 1.62 1.17
Increase days 13.70% 14.96% 21.82%
Average increase in days 1.6 2.23 3.08
Not visit 7.76% 14.10% 25.45%
All Others
Visit unchanged 60.26% 41.80% 12% Decrease days 3.97% 7.72% 11.33%
Average decrease in days 0.55 0.79 0.85
Increase days 3.97% 1.93% 2%
Average increase in days 0.8 0.31 0.43
Not visit 31.79% 48.55% 74.67 %
Snowmobile Riders
Visit unchanged 64.90 42.93 13.43 Decrease days 4.33 7.88 11.66
Average decrease in days 0.55 0.85 1
Increase days 3.85 2.72 2.83
Average increase in days 0.91 0.69 1.38
Not visit 26.92 46.47 72.08
Non-Snowmobile Riders
Visit unchanged 74.07 70.29 58.63 Decrease days 3.09 4.57 5.21
Average decrease in days 0.75 1.7 1.19
Increase days 17.28 17.71 29.64
Average increase in days 1.59 2.21 3.18
25
CHAPTER 3
THE ALLOCATION OF SNOWMOBILE ENTRANCE
RIGHTS AND GUIDE SERVICES IN YNP
3.1. INTRODUCTION
Yellowstone National Park (YNP) is an ideal place for various recreational activities such as
snowmobiling, cross-country skiing, snow-shoeing, hiking, and wildlife viewing. The vast
majority of visitors come to YNP during the summer season, and about 140,000 people visit
in the winter. Over 60 percent of winter visitors ride snowmobiles, and an average of 765
snowmobiles entered YNP each winter day prior to the 2003-2004 season. During the
busiest holiday weekends, as many as 1,500 machines enter the park each day (Mansfield et
al., forthcoming). Because snowmobiles contribute to crowding, noise, bumpy roads, and
exhaust fumes in the park, which impose costs on visitors who would like to enjoy preserved
nature, there have been conflicts between visitors.
Beginning with the 2004-2005 winter season, snowmobile policies in YNP have been
guided by a Temporary Winter Use Plan, which allows 720 snowmobiles per day in the park:
400 through the West Entrance, 220 through the South Entrance, 40 through the East
Entrance, 30 through the North Entrance, and 30 at Old Faithful. The plan also requires all
snowmobilers to be part of a guided trip and all snowmobiles to meet the best available
technology (BAT) requirement. One can imagine several possible rationing mechanisms for
distributing the daily allowed 720 snowmobile permits to YNP visitors. They include:
26
grandfathering. For each of these allocation mechanisms, permits could either be
transferable after allocation or not.
Under the current management plan, all of the daily permitted snowmobile entries are
allocated to commercial guides and visitors must contact one of the guiding companies to
obtain an access to the park, implying that guiding companies have the potential to earn rents
due to entry restrictions. Guiding companies must acquire permits from the NPS to provide
guided tours in YNP, and these are issued through a competitive bidding process. The NPS
issued a prospectus for proposals for the operation of snowmobile guiding service at the park
in July 20033. The prospectus identifies five principal and one secondary selection factor
that the potential bidders must (or may) address for their offer to be responsive to the
prospectus. They include:
1. Describe your environmental plan for the protection, conservation, and preservation of resources of the park’s natural resources.
2. Describe your safety plan and the rate schedule.
3. Describe your past performance and expertise in providing the same or similar services.
4. Include detailed information about your company’s financial status.
5. State the franchise fee you offer as a percentage of the gross yearly revenue 6. Secondary selection factor: describe environmental management programs and
activities that will protect the park’s resources further.
Those questions are fairly simple, but they require months of research and writing
(Swanson, Augusts 2006). Some guiding companies pay tens of thousands dollars to have
full financial audits done in order to show the NPS a clean bill of financial health (Loomis,
September 2006). Hundreds of pages of environmental and safety protocols are written up.
Those proposals are sent to the NPS and are evaluated by a team of NPS staff. For each
3 The 2003 NPS rule was designed to allow 950 snowmobiles per day (80% commercially guided; 20%
27
selection factor, the NPS assigns a score that reflects the merits of the proposal under that
selection factor in comparison to the other proposals received. The NPS will select the
proposal with the highest total point score as the best proposal. Pre-existing concessioners
that had performed satisfactorily during the term of their concession contract were
determined to be preferred offerors, and if they submitted a responsive offer they had the
right to match a better offer. Based on personal communication with NPS staff, there were
35 companies that bid for authorization in response to the 2003 prospectus.
The 2003 NPS rule was overturned by the courts in December 2003, and the
prospectus was thrown out. The park has been operated under a temporary winter use plan
since then, and the existing snowmobile guides were authorized to continue providing tours
in the park. All authorized companies are currently paying three percent of their gross yearly
revenue as the franchise fee, which is the minimum annual franchise fee. When the NPS
finally has a long-term winter use plan, a prospectus similar to that developed in 2003 will be
issued, and guiding companies must prepare and submit their proposals again in order to
continue doing their business.
During the 2005-2006 winter season there were eight guiding companies serving the
West entrance, 12 in the South entrance, one in the North entrance, and one in the East
entrance. Snowmobile entry permits were allocated to each park entrance based on historic
use. For example, 400 snowmobile entries were allocated to the West Entrance, and the eight
authorized operators were each allocated 50 snowmobiles per day. If a concessioner chooses
28
sell a portion of their allocation to another authorized concessioner4. Table 3.1 shows the
numbers of snowmobiles allocated to guiding companies at each entrance. It can be noted
that the West entrance has the largest allocation of snowmobiles because it is historically the
main entrance for snowmobiles. The 2002-2003 winter visitor survey data confirms that the
West entrance is the most popular to snowmobile riders (see table 3.2). Rates for guide
services are not set by the NPS but are based on comparison with like services provided by
the private sector. Before the Temporary Plan, the guide service fee ranged roughly from
$17 to $25 per person. In the 2005-2006 winter season, the overall guide fee increased and
ranged from $25 to $50 per person.
In this chapter, I develop theoretical models of the demand for snowmobile trips to
YNP and for guide services and analyze the welfare effects of the Temporary Winter Use
Plan on heterogeneous snowmobile riders and guiding companies. I also estimate the
aggregate demand for snowmobile trips using 2002-2003 winter visitor survey data, which
contains information on the number of trips respondents made to YNP and other snowmobile
sites during the previous year (2001-2002). The estimated demand curve is used to assess the
overall effect of the policy change on YNP snowmobile riders.
4 A west Entrance concessioner's daily allocation is 50 snowmobiles. On a given day, for example, this
29
3.2. A THEORETICAL MODEL
3.2.1. The Derived Demand for YNP Entries
Assume that a guided snowmobile trip to YNP is produced by two inputs, using
fixed-proportions: one entry (E) and one unit of guide service (G) constitute a trip (T). According
to NPS regulations, a snowmobile rider must first arrive at one of the entrances of YNP and
have a guide to enter the park and ride a snowmobile. A guided tour includes ten people,
implying that one-tenth of a single guide’s service is needed for each visitor. For simplicity,
I will assume that a YNP snowmobile trip is made up of one entry and one guide service: T =
min (E, G). Following Friedman’s handles, blades and knives analysis (Friedman, 1976), in
equilibrium, the price of an YNP trip (PT) will equal the sum of prices of an entry (PE) and a
guide service (PG). This condition becomes a derived demand for entries when one takes as
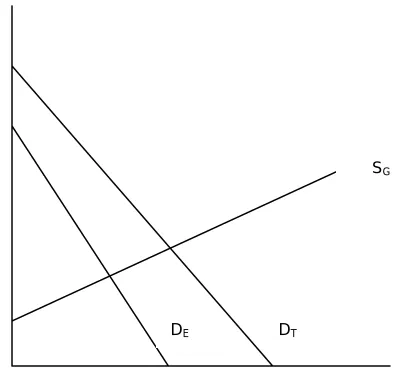
given the supply of guide services and the demand for YNP trips. Figure 3.1 shows the
derived demand for YNP entries, DE, as the vertical difference between the demand for trips,
DT, and the supply of guide services, SG. The demand for trips is itself a derived demand
with transportation costs vertically deducted from a raw demand curve.
3.2.2. Heterogeneous Preferences for Guided Tours
Snowmobile riders have heterogeneous preferences towards guide services, and these can be
divided into three categories: guided tour lovers, guided tour avoiders, and guided tour
neutrals. Guided tour lovers are people who prefer to have professional guides when they
take a snowmobile trip in Yellowstone. This type of visitor is likely to be an inexperienced
rider or one visiting YNP for the first time. Experienced guides are knowledgeable about
30
thoroughly. Guided tour avoiders are those who would prefer to take independent
snowmobile trips. These visitors are likely to be experienced riders who are familiar with
YNP and enjoy speed. If a guided tour neither adds nor detracts utility from snowmobile
riders, this kind of visitors can be categorized as a neutral.
Figure 3.2 illustrates the preferences over guide services and park entries for guided
tour lovers, avoiders, and neutrals. The utility of guided tour lovers increases as guide
services and entries increase, which means that both commodities are “good” and more is
preferred to less. For guided tour avoiders, guide services are a “bad” in which less is
preferred to more. The utility decreases for guided tour avoiders when guide service
increases. If a guided tour is a neutral commodity, consumers are indifferent to the level of
guide services, but prefer more entries to fewer.
3.2.3. Welfare Effects of Policy Change: Who Loses and Who Gains?
Prior to the 2004-2005 winter season, there was no limit on the number of snowmobile
entries into YNP and no guided tour requirement. During this time, guided tour lovers took
snowmobile trips to Yellowstone with commercial guides while avoiders and neutrals5 took
independent snowmobile trips without guides. According to the 2002-2003 winter survey,
about 10 percent of riders took guided tours prior to when they were required to do so.
Figure 3.3 illustrates two demand curves for snowmobile trips (DGT and DWOGT) and an
aggregate demand curve (DE) for entries, which is the horizontal sum of the first two demand
curves. In the guide avoider market segment, which includes both guided tour neutrals and
avoiders, the demand for entries is equal to the demand for trips because they do not take
31
guided snowmobile tour. In the guide lover market segment, the demand for entries is the
derived demand illustrated in figure 3.1.
Without any restrictions on the number of snowmobile entries, there will be QG0 of
snowmobiles entering with guides and QWOG0 of snowmobiles without guides. From the
2002-2003 winter visitor survey, approximately 10 percent of visitors took a guided tour,
which means that on an average day about 76 snowmobiles entered the park with guides (QG0
= 76). The total number of snowmobiles is, then, Q 0 (= QG0+ QWOG0)when there are no
regulations. Riders pay the zero price for entries in both markets and pay P0G if they choose
to have a guide. Consumer surplus for guide lovers is the area below the demand for trips
and above the price riders must pay for a trip, P0T, and the producer surplus of guide service
providers is the area above the supply curve and below the price of guide services, P0G.
Consumer surplus for independent snowmobile riders is the whole area below the demand for
trips (DWOGT).
I will examine consequences of a policy change, which occurred in the 2004-2005
winter season when the NPS set a limit of the number of snowmobiles and imposed a guided
tour requirement. Under this policy, all snowmobiles must be guided by commercial guides.
Among the three kinds of snowmobile riders, guide avoiders are now least likely to visit
YNP, shifting the demand for trips to the left in the guide avoider market segment as it is
presented in figure 3.4.
Demands for snowmobile trips for avoiders with and without the guide requirement
are DWG'
T and DWOGT , respectively. Another way of interpreting this consequence is that
guide avoiders’ willingness to pay for YNP trips decreases when the guided tour requirement
32
market are likely to go to other snowmobile trails where there is no guided tour requirement.
The aggregate demand for snowmobile trips with guides is the sum of demands for trips from
two different markets (DT = DGT + DWG'T).
Now, Q1 (=QG0 + QWG'0) is the number of snowmobile riders who desire to enter the
park with commercial guides if no fee is charged for entering the park. If Q1 is less than the
allowed number of snowmobiles in YNP, Q', then the limit does not bind, and all of Q1 will
enter the park with guides. The price of guide services will be P1G, and the producer surplus
will increase because P1G is greater than P0G, which is the price of guide services prior to the
regulation. If Q1 is, however, greater than Q', then the limit is binding and the price of guide
service will be P'G, which is greater than P0G but less than P1G. When the limit is binding,
guide service providers, who ration entry permits, can charge P'E to snowmobile riders. This
means that riders now must pay P'T (=P'G + P'E) per entry because only a limited number of
snowmobiles can enter and the demand for entry is larger than the limit. It can be noted that
the supply curve (S'G) becomes vertical at Q' because only authorized guiding companies can
provides guided visits.
The welfare change for guide service providers is the sum of the change in producer
surplus and the rent. The price of guide services is P0G prior to the restriction, but with a
binding limit on the number of snowmobiles, the price of guide services increases to P'G,
which means that producer surplus increases. In addition to the increased producer surplus,
guiding companies gain entry rents. The potential size of the rents is ' ' E
P Q× , but guided tour
operators must pay a certain percentage of their revenues to the NPS according to their
contracts. It is also believed that the bidding process is costly, which further reduces the
33
3.3. DATA
Among four sets of questions included in the survey, I will focus on the revealed preference
questions, which asked visitors about their previous year’s winter recreation for this chapter.
The experienced snowmobile version of the survey listed 52 snowmobile sites in Idaho,
Montana, and Wyoming with a map showing these locations (appendix B). These 52 sites
represent the set of snowmobile riding alternatives that would be available to potential YNP
visitors. Survey respondents were asked to provide information on the number of trips they
made during the 2001-2002 winter season to the sites included in the choice set. There are
617 people who answered the experienced snowmobile version of the questionnaire, and 377
of them indicated that they visited at least one of the sites in the choice set during the last
winter season. More details about the data can be found in section 2.2
3.4. MODEL
ESTIMATION
Because I do not have information on the supply side of guide services, it is not possible to
estimate the supply curve and do a full analysis of the welfare changes for guiding companies
and snowmobile riders. It is, however, possible to estimate the demand for snowmobile
entries into YNP and to calculate snowmobile riders’ welfare change from limiting the
number of snowmobile entries using the revealed preference data. For this I need to
construct the snowmobilers’ demand for entry. To estimate the demand curve, I need
information on each visitor’s willingness to pay to enter YNP, which can be evaluated via a
34
The RUM model I employ is a travel cost model that considers the choice among
sites as a function of characteristics of available sites. These characteristics include the price
of arriving at the sites (both explicit and implicit travel costs) as well as attributes of each site.
The utility a person receives for a visit to site j is defined as:
, 1,...,
j j j
u = +v ε j= J , (3.1)
where vj is the observable component of utility and εj is a random error, which is
unobservable to the researcher. On a given choice occasion the probability an individual
chooses to visit site j is the probability that uj is greater than uk for all k ≠ j. If the errors are
independently and identically distributed with a type I extreme value distribution, the
probability of an individual visiting site j is given by:
1
exp( )
( )
exp( ) j
j k J
k k
v
pr u u
v
=
≥ =
∑
. (3.2)The willingness to pay for access to site 1 can be calculated as:
[ ]
[ ]
1 1
2 1
ln J exp k ln J exp k
k k
WTP δ− v v
= =
⎛ ⎞
= − ⎜ − ⎟
⎝
∑
∑
⎠, (3.3)where vk is the deterministic component of utility for alternative k, and δ is the marginal
utility of income. The price elasticity of the probability of visiting site 1 can be computed as:
(
1)
1
1 1 p 1 P
E p =δ⋅ ⋅ − , (3.4)
where P1 is the probability of choosing site 1, p1 is the travel cost, and δ is the price
coefficient.
It is not possible from the researcher’s perspective to observe all the characteristics of
the sites that are important in individuals’ decision making. If there is correlation between