International Research Journal of Mathematics, Engineering and IT Vol. 3, Issue 7, July 2016 IF- 3.563 ISSN: (2349-0322)
© Associated Asia Research Foundation (AARF)
Website: www.aarf.asiaEmail : [email protected] , [email protected]HAZARD FUNCTION OF FSH AND LH RESPONSES TO GNRH BY OVARIES STEROIDS IN THE LUTEAL PHASE OF THE CYCLE OF THE WOMEN
Dr.S.Lakshmi M.Sc., M.Phil.,Ph.D(Mathematics)
Principal(Rtd)(K.N.Govt Arts College for Women,TNJ) no.16,Badri Vishal,West Street
Ganapathy Nagar Thanjavur-613001
P.Velvizhi M.Sc., M.Phil
Associate Professor of Mathematics M.I.E.T. Engineering College
Gundur Trichy- 620007
ABSTRACT
Aim of this paper is to find a mathematical model to determine the role of ovarian
steroids in the control of GnRH- induced gonadotrophin secretion in the luteal phase of the
cycle of eighteen women subjects, by using probability density function and hazard function
of Birnbaum- Saunders distribution. In reliability and survival analysis , it is often interest to
determine the point at which the hazard function reaches its maximum and is given by
mathematical curves.
Keywords:Birnbaum –Saunders distribution, hazard function, Follicile stimulating hormone ,
luteinizing hormone , Estradiol and Progesterone.
1. Mathematical Model
1.1.Introduction
The two-parameter Birnbaum-Saunders (BS) distribution was originally proposed by
Birnbaum and Saunders[3] as a failure time distribution for fatigue failure caused under
cyclic loading. The cumulative distribution function (CDF) of a two-parameter BS random
F(t; ,) = 1
𝛼 𝑡 𝛽
1 2
− 𝛽 𝑡
1 2
, 0 t , , 0 , (1)
Where Φ(.) is the standard normal CDF. The parameters α and β in (1) are the shape and
scale parameters, respectively. Although the BS distribution was originally proposed as a
failure time distribution for fatigue failure under the assumption that the failure is due to
development and growth of a dominant crack, a more general derivation was provided by
Desmond [4] based on a biological model. Desmond also strengthened the physical
justification for the use of this distribution by relaxing the assumptions made originally by
Birnbaum and Saunders. Some recent work on the BS distribution can be found in
Balakrishnan et al. [2], andNg et al. [13]
It is known from Johnson et al. [6] that the density function of the BS distribution is
unimodal. Though several articles have been published in the last three decades regarding
different inferential methods for the parameters of the BS distribution and their properties, yet
the shape of the hazard function has not been examined possibly due to its complex form.
Mann et al. [10] mentioned that the hazard function of the BS distribution is not an increasing
function of t, although they did not provide a formal proof for it. In this paper, we first
formally prove that the hazard function of the BS distribution is indeed an upside down
function of t>0 for all values of the shape α and scale parameter β which is used for our
application part.
It is not uncommon to model survival and failure time data by distributions which
have monotone hazard function. But in many practical situations, the hazard function is not
monotone and in fact it increases up to a point and then decreases. For example, in the study
of recovery from breast cancer, it has been observed by Langland’s et al. [8] that the
maximum mortality occurs after about three years and then it decreases slowly over a
fixedperiod of time. In this case, a quantity of natural interest is the point at which the hazard
function is maximum; see Gupta et al. [5]. Finally, here we have analysed a real data set and
illustrate all the methods discussed.
1.2.Birnbaum-Saunders Distribution
The probability density function (PDF) of a two-parameter BS random variable T
corresponding to the CDF in (1) is given by
𝑡 ; , = 1 2 2𝜋𝛼𝛽
𝛽 𝑡
1 2
+ 𝛽 𝑡
3 2
𝑒𝑥𝑝 − 1 2𝛼2
𝑡 𝛽+
𝛽
Consider now the monotone transformation
X = 1
2 𝑇 𝛽
1 2
− 𝑇 𝛽
−12
(3)
T=β{1+2X2
+2X(1+X2)1/2}; (4)
Then from (1), it readily follows that X is distributed as normal with mean zero and variance
(α2
/4). The transformation in (4) is a very useful transformation as it enables the
determination of the moments of T through known results on expectations of functions of X.
1.3.Shape of the Hazard
To examine the shape of the hazard function, let us assume that the scale parameter
β=1, without loss of generality. Let us consider the function
∈(t) = 𝑡 12− 𝑡− 1 2
For which ∈ 𝑡 = 𝑑
𝑑𝑡 ∈ (𝑡) = 1 2 𝑡
−12+ 𝑡− 32
= 1
2𝑡 𝑡
1 2+ 𝑡−
1 2
∈ (𝑡) = 𝑑
𝑑𝑡 ∈
𝑡 = - 1 4𝑡2 𝑡
1
2+ 3𝑡− 1 2
And also ∈2(t) = t +1 𝑡 − 2
The density function of the BS distribution in (2) (for β=1) is then
(t; ) = 1
2𝜋𝛼 ∈
𝑡 𝑒− 1
2𝛼 2∈ 2(𝑡)
(5)
Which, in conjunction with the expression of the distribution function in (1), gives the hazard
function as
h (t; ) = (t ; )
1− F(t; ,1) =
1 2𝜋 𝛼∈
𝑡 𝑒− 1
2𝛼 2∈2(𝑡)
−∈(𝑡)𝛼 (6)
From (6), the shape of h(t;α) is not at all clear. We need the following lemmas for
establishing our main result regarding the shape of the hazard function h(t;α) in (6).
Lemma 1: Suppose f(t), for t>0, is the density function of a positive real-valued continuous
that ƞ(t)>0 ∀t𝜖 (t0,∞), the hazard function corresponding to f(t) is either an upside down of a
decreasing function of t.
Lemma 2:The hazard function of Birnbaum-Saunders distribution is either an upside down
or a decreasing function of t>0, for all values of the shape parameter α.
Lemma 3: For >0, the hazard function of the BS distribution is indeed an upside down
function.
Proof: Note that it is enough to prove thatlim𝑡→0ℎ 𝑡, 𝛼 = 0. From (6), we have
ℎ 𝑡, 𝛼 = ∈ 𝑡
𝛼 ∈(𝑡)
𝛼
− ∈(𝑡)𝛼 (7)
Since limt→0 Φ −∈(𝑡)𝛼 =1 , we consider only the numerator of h(t , ). Note that
1
𝛼 ∈
𝑡 ∈ 𝑡
𝛼 = k𝑒 − ∈ 𝑡
2 2𝛼 2 𝑡 −
1 2+ 𝑡−
3
2 (8)
Where k is a positive constant. Now consider
lim𝑡→0 𝑙𝑛 𝑒− ∈(𝑡) 22𝛼 2 𝑡− 1
2 = lim𝑡→0 − ∈ 𝑡 2
2𝛼2 −
1 2𝑙𝑛𝑡
= lim 𝑡→0
1
2𝛼2 −𝑡 − 𝑡
−1+ 2 − 𝛼2𝑙𝑛𝑡 = - ∞
Therefore,lim𝑡→0 𝑒− ∈(𝑡) 22𝛼 2 𝑡− 1
2 = 0
Similarly, it can be shown thatlim𝑡→0 𝑒− ∈(𝑡) 22𝛼 2 𝑡− 3
2 = 0
Which completes the proof of the lemma.
By combining all these results, we can now state the following result.
Theorem1: The hazard function of the BS distribution is an upside down function for all
2.Application
2.1.Introduction
It has been established that ovarian steroids play an important role in the control of
gonadotrophin secretion from the pititary. Clinical experiments have shown that exogenous
estrogen is able to suppress basal levels of LH and FSH during the follicular phase of the
cycle . On the other hand, changes in the production of endogenous estrogen, such as after
ovarian stimulation with FSH of after bilateral ovariectomy, result repectively in a decrease
or increase of endogenous gonadotrophin values (Kamel et al., 1991[7]; Alexandris et al.,
1997[1] ). In the case of ovariectomy, the pattern of LH increase following the operation is
similar to that of FSH, but the values for both gonadotrophins are peristently lower in women
oophorectomized in the luteal rather than the follicular phase of the cycle [1]. Although the
difference in gondotrophin values between the two phases of the cycle can be attributed to the
increased concentrations of progesterone during the luteal phase, information regarding the
contribution of this steroid to the negative feedback mechanism at that stage is limited .
In-vivo experiments have shown marked changes in the reponsiveness of the pituitary
to GnRH during the normal menstrual cycle, with a significant increase from the early
follicular phase to mid cycle and a progressive decline there after . Although estradiol is the
primary factor that sensitizes the pituitary to GnRH during the follicular phase (Lasley et al.,
1975, [9] ), the role of ovarian steroids in the control of pituitary sensitivity to GnRH during
the luetal phase has not been investigated. In a recent study in women, we have demonstrated
that following ovariectomy in the luetal phase of the cycle, the response of FSH ato GnRH
increased progressively, while that of LH declined markedly. This indicates a differential
control of FSH and LH by the ovaries [1], but the mechanism is not clear.
The present study was undertaken to investigate the mechanism through which the
ovaries control GnRH induced LH and FSH secretion during the luteal phase of the menstrual
cycle by treating normal premenopausal women with estradiol and progesterone in order to
prevent the ovariectomy-induced decline in the concentrations of these two steroids.
Materials and Methods
Patients
The study included 18 normally cycling women aged 42-46 years, with normal FSH
values in the early follicular phase (<10IU/I) and ovulatory progesterone levels on cycle day
the women gave written informed consent. All women were studied during the week
following bilateral ovariectomy plus total hysterectomy performed by laparotomy under
general anaesthesia (09:00 h). The ovaries were normal and the indications for the operation
were benign uterine lesions, such as fibroids and menorrhagia. The women were dided space
into space three groups based on whether they were treated or not with ovary and steroids. In
group 1 (n=6) no hormonal treatment was given to the women post-operatively. In group 2
(n=6) the women receive estradiol through skin patches (estradern) TTS; Novartis, athens,
greece). The first patch was applied on the day of ovariectomy immediately after the
operation at the dose of hundred new gene/24 h. Further patches were applied on post
operative days three and six. In group 3 (n=6) the women received estradiol, as in group 2, +
progesterone (utrogestan capsules 100 mg/capsule;faran, athens, greece) intravaginally at the
dose of 300 mg/day (100mg every 8 hour). The first dose of progesterone was applied after
the end of the operation and the last dose on the post operative day 6. In women receiving
hormonal treatment, contraindication for the administration of the steroids were identified.
The operation was performed in the early to mid luteal phase of the cyle, i.e. five days after
the endogenous LH peak detected by LH measurement in daily bed samples taken from the
time the follici size was 16 mm in diameter as assesed by ultrasound. In all women the
pituitary response to GnRH (10 U g.i.v.) was investigated on a daily basis, starting in the
morning before the operation until post operative day7, i.e. the day of discharge. Bllod
samples in realtion to each GnRH injection (time zero) were obtained at -15,0 and 30
minutes. The 30 minute point was chosen because at that time a maximal response to GnRH
has been reported and this represents pituitary sensitivity to GnRH . FSH and LH were
measured in all blood samples, while basal values of estradiol and progesterone were
measured in the samples taken at -15 and 0 minute. During the operation, the presence of a
corpusluteum was confirmed. Before the operation, all women have normal haemoglobin
levels (>12g/dl) and the operations were performed without any complications. The blood
Figure1.Serum FSH , LH, estradiol and progesterone values before and after bilateral
ovariectomy plus hysterectomy performed in early to mid-luteal phase(day0)in 18
normally ovulating women. six of the women(o)received no hormonal treatment post
operatively(group 1), six () received estradiol through skin patches on days 0, 3 and 6
(group 2) and the remaining six (m) received estradiol, as in group 2, plus progesterone
intravaginally from days 0-6 (group 3).(a) and (b)*P<0.05 ; **P<0.01;***P<0.001
(difference from group 3).†P<0.05; ††P<0.01(difference from group 2).+P<0.05;
++P<0.01(difference from group 2).(c) *P<0.05; **P<0.01(difference from group2,and3)
Figure2.Responses of FSH(FSH) and LH (LH)at 30 min to GnRH(10g i.v) before and
after bilateral ovariectomy plus hysterectomy performed in early to mid-luteal phase (day0)in
18 normally ovulating women. six of the women(o)received no hormonal treatment post
operatively (group 1), six () received estradiol through skin patches on days 0, 3 and 6
(group 2) and the remaining six (m) received estradiol, as in group 2, plus progesterone
intravaginally from days 0-6 (group 3). (a) and (b) *P<0.05 ; **P<0.01 ;***P<0.001
(difference from group 3). †P< 0.05; ††P<0.01(difference from group 1).+P<0.05; (difference
from group 2).
Discussion
In the present study, the increasing basal values of FSH and LH following ovariectomy in the
women who did not receive hormonal treatment are in agreement with our previous data [1].
The greater increase in serum FSH values compared with LH is probably related to the lower
metabolic clearance rate and higher production rate of FSH .In the women who were treated
with estradiol, this increase was only postponed for a few days, thus indicating that estradiol
alone contributes to, but is not sufficient to maintain, the ovarian suppressing effect on
gonadotrophin secretion towards the mid-luteal phase of the cycle. There is only one study in
the literature in which women were treated immediately after ovariectomy with estradiol
that, similarly to the present study, prevented the increase in FSH and LH levels, but serial
blood samples were taken only for the first four post-operative days [7]. Low plasma FSH
and LH concentrations were also maintained in women undergoing abdominal surgery, in
whom, however, estradiol levels remained high post-operatively, not with
exo-genousestrogen, but with the conservation of the ovaries. When in the present study estradiol
was combined with progesterone, there was no increase in FSH and LH levels for at least a
week after ovariectomy. Since with these treatments the high luteal concentrations of
estradiol and progesterone were maintained following ovariectomy, it is evident that both
steroids are required to keep low secretion of gonadotrophins in the early to mid-luteal phase
of the cycle. The present study is the first to investigate the effect of estradiol and
progesterone on pituitary sensitivity to GnRH in premenopausal women following bilateral
ovariectomy. In terms of changes in GnRH-induced FSH secretion in the untreated (control)
group of women, the pattern was similar to that previously reported, i.e. a continuous rise
following ovariectomy[1], thus illustrating a suppressing effect of the ovaries on the pituitary
at that stage of the cycle. We infer that estradiol contributes to, but is not solely responsible
for, this suppressing effect, since in the women who were treated with estradiol alone the
progesterone the period of the estradiol-induced suppression was extended, the rise in FSH
eventually occurred, suggesting that the two steroids together are not sufficient to mediate
completely the ovarian suppressing effect on FSH and that other ovarian factors also play a
role.
The decreasing values of LH in the women who did not receive hormonal treatment could
be interpreted as indicating that the ovaries exerted a sensitizing effect on LH secretion
before the operation. However, the fact that the pattern of changes in LH values was
unaffected by treatment with the steroids suggests that estradiol and progesterone are not
mediators of such an ovarian effect on LH response to GnRH in the mid-luteal phase. It is
possible, therefore, that either a sensitizing effect of the ovaries on the pituitary is exerted
through unspecified substances, or that the decrease in LH values following ovariectomy is
controlled by extra-ovarian mechanisms. Such mechanisms could be related to depleted
stores of pituitary gonadotrophins as a result of the preceding mid-cycle LH surge that
affected LH reserves more than those of FSH. The latter possibility is more likely based on
previous data that a declining pattern of LH response to GnRH during the luteal phase of the
cycle has been also reported in women with intact ovaries (Messinis et al., 1993, [11]). The
fact, however, that following ovariectomy the decline in LH was interrupted shortly after
the operation, i.e. —4 days from the mid-luteal stage (Figure 2), while in women with intact
ovaries the decline continues until the end of the luteal phase [11], indicates an earlier
recovery of the pituitary in the ovariectomized than in the non-ovariectomized women. This
suggests that GnRH-induced LH secretion in the luteal phase is not entirely unaffected by the
ovaries. It is possible that a factor, different from estradiol and progesterone, maintains a low
responsiveness of LH to GnRH towards the end of the cycle. Such a factor that specifically
reduces LH response to GnRH is gonadotrophin surge attenuating factor (GnSAF) (Messinis
and Templeton, 1989 [12]), but its role at that stage of the cycle needs to be further
investigated.
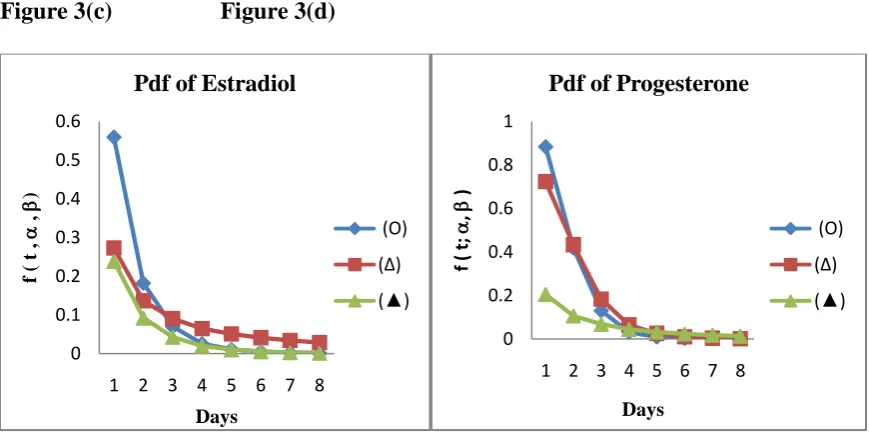
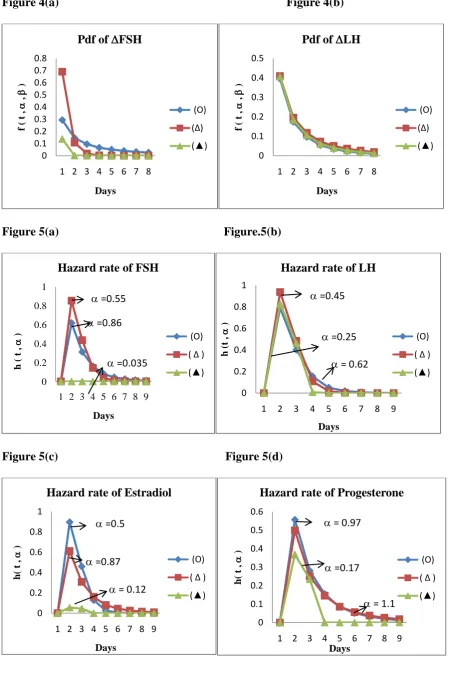
3. Mathematical Result
Pdf of FSH , LH , Estradiol and Progesterone are given in the figures1(a) ,
1(b), 1(c) , 1(d), 2(a) and 2(b) respectively by using the equation (2) are
respectively.All the curves are monotonically decreasing towards time axis in
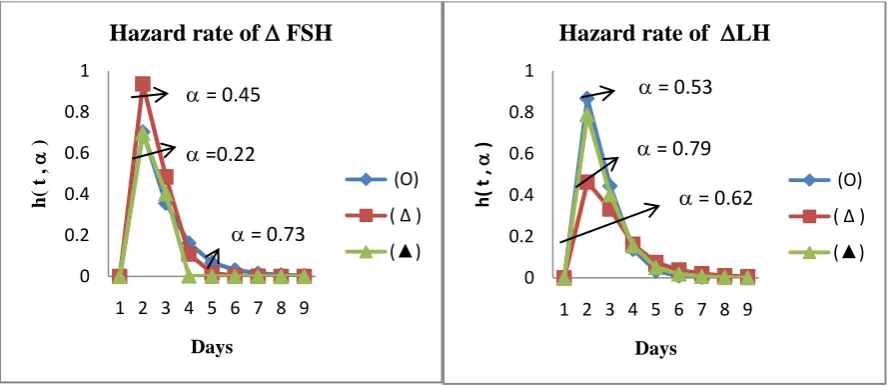
days.
Hazard rate of FSH , LH, Estradiol and Progesterone of the corresponding
medical figures 1(a) , 1(b), 1(c) 1(d), 2(a) and 2(b) respectively by using the
equation (7) are given in the following figures 5(a) ,5(b) , 5(c), 5(d), 6(a) and
6(b) respectively. All the curves of Hazard function are upside down function
for all values of .
Figure.3(a) Figure.3(b)
Figure 3(c) Figure 3(d) 0 0.1 0.2 0.3 0.4 0.5
1 2 3 4 5 6 7 8
f ( t , , ) Days
Pdf of FSH
(O) (∆) (▲) 0 0.05 0.1 0.15 0.2 0.25 0.3 0.35 0.4 0.45
1 2 3 4 5 6 7 8
f ( t , , ) Days
Pdf of LH
(O) (∆) (▲) 0 0.1 0.2 0.3 0.4 0.5 0.6
1 2 3 4 5 6 7 8
f ( t , , ) Days
Pdf of Estradiol
(O) (∆) (▲) 0 0.2 0.4 0.6 0.8 1
1 2 3 4 5 6 7 8
f ( t; , ) Days
Pdf of Progesterone
(O)
(∆)
[image:10.595.71.502.199.681.2] [image:10.595.73.494.205.420.2] [image:10.595.72.507.467.684.2]Figure 4(a) Figure 4(b)
Figure 5(a) Figure.5(b)
Figure 5(c) Figure 5(d)
0 0.1 0.2 0.3 0.4 0.5 0.6 0.7 0.8
1 2 3 4 5 6 7 8
f ( t , , ) Days
Pdf of FSH
(O) (∆) (▲) 0 0.1 0.2 0.3 0.4 0.5
1 2 3 4 5 6 7 8
f ( t , , ) Days
Pdf of LH
(O) (∆) (▲) 0 0.2 0.4 0.6 0.8 1
1 2 3 4 5 6 7 8 9
h ( t , ) Days
Hazard rate of FSH
(O) ( ∆ ) (▲) =0.55 =0.86 =0.035 0 0.2 0.4 0.6 0.8 1
1 2 3 4 5 6 7 8 9
h (t , ) Days
Hazard rate of LH
(O)
( ∆ )
(▲)
=0.45
=0.25 = 0.62
0 0.2 0.4 0.6 0.8 1
1 2 3 4 5 6 7 8 9
h( t , ) Days
Hazard rate of Estradiol
(O)
( ∆ )
(▲)
=0.5
=0.87 = 0.12
0 0.1 0.2 0.3 0.4 0.5 0.6
1 2 3 4 5 6 7 8 9
h( t , ) Days
Hazard rate of Progesterone
(O)
( ∆ ) (▲)
= 1.1 =0.17
[image:11.595.70.520.41.720.2]Figure 6(a) Figure 6(b)
4.Conclusion
In conclusion, the present study provides evidence that in the early to mid-luteal phase of the
cycle, estradiol and progesterone are important components of the suppressing effect of the
ovaries on basal FSH and LH secretion. However, in terms of gonadotropin response to
GnRH, the study demonstrates for the first time that these two steroids participate in the
control of FSH, but not of LH, secretion. It is possible that in the luteal phase the response of
LH to GnRH is partly controlled by GnSAF.
Mathematical results : P.d.f of FSH , LH , Estradiol and Progesterone are given in the
figures1(a) , 1(b), 1(c) , 1(d), 2(a) and 2(b) respectively by using the equation (2) are given
in the figures 3(a), 3(b), 3(c), 3(d), 4(a) and 4(b) respectively. All the curves are
monotonically decreasing towards time axis in days. Similarly Hazard rate of FSH , LH,
Estradiol and Progesterone of the corresponding medical figures 1(a) , 1(b), 1(c) 1(d), 2(a)
and 2(b) respectively have been obtained by using the equation (7) and are given in the
figures 5(a) ,5(b) , 5(c), 5(d), 6(a) and 6(b) respectively. All the curves of the Hazard
functions are upside down function for all values of . These results will beuseful for
medical professionals for further research.
References
[1] Alexandris, E., Milingos, S., Kollios, G., Seferiadis, K., Lolis, D. and Messinis, I.E.
(1997) Changes in gonadotrophin response to gonadotrophin releasing hormone in
0 0.2 0.4 0.6 0.8 1
1 2 3 4 5 6 7 8 9
h(
t
,
)
Days
Hazard rate of FSH
(O)
( ∆ )
(▲)
= 0.45 =0.22
= 0.73
0 0.2 0.4 0.6 0.8 1
1 2 3 4 5 6 7 8 9
h
(
t
,
)
Days
Hazard rate of LH
(O)
( ∆ )
(▲)
= 0.53 = 0.79
[image:12.595.72.518.64.257.2]normal women following bilateral ovariectomy. Clin.Endocrinol., 47, 721–726.
[2] Balakrishnan, N., Leiva, V., Lopez, J. (2007), "Acceptance sampling plans from
truncated life tests based on the generalized Birnbaum-Saunders distribution",
Communications in Statistics - Simulation and Computation, vol. 36, 643-656.
[3]Birnbaum, Z. W. and Saunders, S. C. (1969). ‘’A new family of life distribution",
Journal of Applied Probability, vol. 6, 319-327.
[4] Desmond, A. F. (1985). ―Stochastic models of failure in random environments",
Canadian Journal of Statistics, vol. 13, 171-183.
[5]Gupta, R. C., Kannan, N. and RayChoudhuri, A. (1997). ― Analysis of log-normal
survival data", Mathematical Biosciences, vol. 139, 103-115.
[6]Johnson, N. L., Kotz, S. and Balakrishnan, N. (1995). Continuous UnivariateDistribu-
tions - Vol. 2, Second edition, John Wiley & Sons, New York.
[7] Kamel, E.M., Maurer, S.A., Hochler, M.G., Hoffman, D.I. and Rebar, R.W. (1991)
Gonadotropin dynamics in women receiving immediate or delayed transdermal
estradiolafter oophorectomy. Obstet. Gynecol., 78, 98–102.
[8] Langlands, A. O., Pocock, S. J., Kerr, G. R. and Gore, S. M. (1979). ― Long term
survival of patients with breast cancer: A study of the curability of the disease", British
Medical Journal, vol. 17, 1247-1251.
[9] Lasley, B.L., Wang, C.F. and Yen, S.S.C. (1975) The effects of estrogen and
progesterone on the functional capacity of the gonadotrophs. J. Clin. Endocrinol. Metab
[10] Mann, N. R., Schafer, R. E., and Singpurwalla, N. D. (1974). Methods for Statistical
Analysis of Reliability and Life Data, John Wiley & Sons, New York.
[11] Messinis,I.E., Koutsoyiannis. D. Milingos,S.Tsahalina,E.Seferiadis,K, Lolis,D.
and Templeton, A.A.(1993) Changes in pituitary response to GnRH during the
159- 163.
[12] Messinis, I.E. and Templeton, A.A. (1989) Pituitary response to exogenous LHRH in
superovulated women. J. Reprod. Fertil., 87, 633–639.
[13] Ng, H. K. T., Kundu, D. and Balakrishnan, N. (2006). " Point and interval estimation
for the two-parameter Birnbaum-Saunders distribution based on Type-II censored