Citation:
Hanley, B and Smith, L (2009) Effects of fatigue on technique during 5 km road running. Proceedings of the XXVII International Symposium on Biomechanics in Sports. 382 - 385 (4). ISSN 1999-4168 Link to Leeds Beckett Repository record:
http://eprints.leedsbeckett.ac.uk/657/
Document Version: Article
The aim of the Leeds Beckett Repository is to provide open access to our research, as required by funder policies and permitted by publishers and copyright law.
The Leeds Beckett repository holds a wide range of publications, each of which has been checked for copyright and the relevant embargo period has been applied by the Research Services team.
We operate on a standard take-down policy. If you are the author or publisher of an output and you would like it removed from the repository, please contact us and we will investigate on a case-by-case basis.
EFFECTS OF FATIGUE ON TECHNIQUE DURING 5 KM ROAD RUNNING
Brian Hanley and Laura Smith
Carnegie Research Institute, Leeds Metropolitan University, Leeds, UK
The purpose of this study was to investigate the effects of fatigue on kinematic parameters during a 5 km road race, and to establish how men and women fatigue differently. 17 highly competitive distance runners (9 male, 8 female) were videoed (50 Hz) as they completed the English National 5 km championships. Three-dimensional kinematic data were analysed using motion analysis software (SIMI, Munich). Data were recorded at 950 m, 2,400 m, and 3,850 m. Repeated measures ANOVA showed a significant decrease in speed (p < 0.01) which occurred due to both decreased step length and cadence (p < 0.05). Differences in speed, step length and contact time between men and women were found (p < 0.05). Athletes can reduce the risk of fatigue by using appropriate racing tactics.KEY WORDS: fatigue, athletics, road running, gender differences.
INTRODUCTION: Great differences in running technique are evident between the earlier and latter stages of a race. Changes in technique are required by fatigued runners towards the end of a race to maintain speed and running economy (Anderson, 1996). This is often achieved through postural changes; however, such changes may be detrimental to actual running technique. Williams et al. (1991) suggested that with fatigue, runners should not markedly change their mechanics: runners that did exacerbated the effects of fatigue and subsequent technique deterioration. Research suggests step length decreases with fatigue due to irregularities of internal timing (Elliot and Ackland, 1981), changes in muscle firing patterns (Williams, 1990) and changes of the lower limb joint angles (Siler and Martin, 1991). Physiological factors may also contribute to the decrease in step length. Because of this, runners aim to attain an optimum technique that they can maintain in order to achieve race success. Elliot and Ackland (1981) proposed that identification and appropriate correction of deterioration in a runner’s technique would be beneficial for enhancing performance. The aim of this study was to measure kinematic variables in 5 km distance running and investigate how they altered during the course of the run.
METHODS: Seventeen competitive distance runners (nine men, eight women) gave informed consent and the study was approved by the university’s ethics committee. The participants’ mean age was 26 years (± 4), stature 1.72 m (± 0.06) and mass 60 kg (± 7). The study was conducted at the National AAA 5K Road Championships in Horwich (GBR). All 17 participants completed the 5,000 m road race (three laps of 1,450 m, including an additional 650 m at the start). The race times ranged from sub-14 minutes to 17:30 (men sub-14 to 16:30 and women 15:45 to 17:30). Kinematic data were recorded at the same position on the course for the three laps of the race: 950 m (lap 1), 2,400 m (lap 2) and 3,850 m (lap 3). The race was filmed using two stationary DM-XL1 cameras (Canon, Tokyo), recording at 50 Hz. The reference volume was 5 m long, 2 m wide, and 2.16 m high; this ensured data collection of approximately three successive steps and allowed for 3D-DLT. Each camera was placed approximately 8 metres from the path of the runners. The video data were digitised using SIMI Motion (Munich) and filtered using a Butterworth 2nd order low-pass filter. Variables measured included joint angles, step length, cadence, and step time. In order to measure the effects of fatigue on the values obtained from the kinematic data and to compare the different effects between men and women, two factor mixed factorial repeated measures ANOVA was utilised, with post hoc pairwise tests using Bonferroni adjustments (p < .05).
a .04 km/hr decrease between laps 2 and 3. The decrease over the course of the race was significant (p < 0.01). Post hoc tests showed the values of lap 1 were significantly greater than both lap 2 and 3 (p < 0.05); values between lap 2 and 3 were not significantly different. For the men participants speed decreased constantly throughout the race, and this decrease was significant (p < 0.05). Post hoc tests established that the values at lap 1 were different to those at both laps 2 and 3. The women’s mean speed decreased between lap 1 and 2, followed by a slight increase at lap 3. The values at lap 1 and 2, and lap 1 and 3 were different (p < 0.01). Men experienced a constant decrease with fatigue, whereas women decreased at a higher rate to begin with, followed by a slight increase. These differences between genders were significant (p < 0.01). Over the course of the race, men’s speed decreased by 1.07 km/hr and women’s by 1.05 km/hr, suggesting similar levels of fatigue.
Table 1: Mean (± SD) speed of the overall group, men and women participants.
Overall (km/hr) Men (km/hr) Women (km/hr) Lap 1 20.40 (± 1.25) 21.31 (± 0.96) 19.38 (± 0.55) Lap 2 19.38 (± 1.57) 20.51 (± 1.29) 18.11 (± 0.53) Lap 3 19.34 (± 1.48) 20.24 (± 1.49) 18.33 (± 0.52) Mean (± SD) 19.71 (± 1.39) 20.81 (± 1.19) 18.63 (± 0.43)
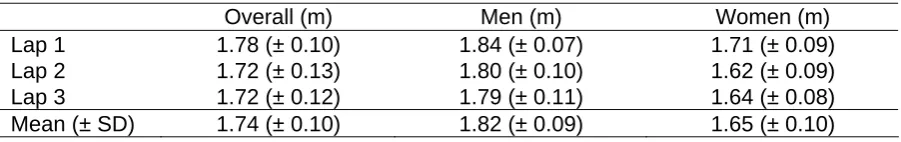
[image:3.595.71.522.534.605.2]Table 2 shows that the largest mean step length of all of the data was observed during lap 1 (1.78 m). Step length was defined as the distance the body travelled between a specific phase on one leg and the same phase on the other leg. The decrease in step length is consistent with the decrease in speed. Men’s mean step length incurred the greatest decrease between lap 1 and 2; a slight decrease was exhibited from lap 2 to 3. This decrease was not significant. Women’s mean step length decreased between laps 1 and 2, and then increased again slightly. Repeated measures ANOVA showed the differences were significant (p < 0.01). Post hoc tests showed lap 1’s values were different from both lap 2 and 3’s values. The men’s mean step length was 0.17 m longer than the women participants’. Again, men and women athletes appeared to experience parameter changes differently over the course of the race. Men’s step lengths decreased constantly, whereas an increase was evident for the women athletes following lap 2. The overall decrease in the men’s length was 0.05 m, and the women’s slightly greater at 0.07 m, suggesting women alter step length more as a result of fatigue. These differences were significant (p < 0.05).
Table 2: Mean (± SD) step length of the overall group, men and women.
Overall (m) Men (m) Women (m)
Lap 1 1.78 (± 0.10) 1.84 (± 0.07) 1.71 (± 0.09) Lap 2 1.72 (± 0.13) 1.80 (± 0.10) 1.62 (± 0.09) Lap 3 1.72 (± 0.12) 1.79 (± 0.11) 1.64 (± 0.08) Mean (± SD) 1.74 (± 0.10) 1.82 (± 0.09) 1.65 (± 0.10)
Table 3: Mean (± SD) cadence of the overall group, men and women.
Overall (Hz) Men (Hz) Women (Hz)
Lap 1 3.18 (± 0.14) 3.21 (± 0.13) 3.15 (± 0.15) Lap 2 3.14 (± 0.14) 3.16 (± 0.12) 3.11 (± 0.16) Lap 3 3.13 (± 0.16) 3.14 (± 0.11) 3.12 (± 0.20) Mean (± SD) 3.15 (± 0.14) 3.17 (± 0.12) 3.14 (± 0.17)
[image:4.595.71.524.337.440.2]Leg joint angles are shown in Table 4. The hip was considered to be 0° at extension and therefore the angles at initial contact are a measure of hip flexion. The angle of the hip at toe-off (hyperextension) for all participants remained relatively constant at about 11°. Knee extension also remained constant during lap 1 and 2 followed by a 1° increase in lap 3. The ankle angle at toe-off remained relatively constant throughout the race. The angle of the hip at contact (hip flexion) was calculated as 28° during lap 1 and 2, and then decreased to 26°. No significant differences were found between any of the angular data between laps or between genders. Men and women appeared to alter their joint angles differently. The men’s knee extension at toe-off decreased, whereas the women’s angle increased. Males also exhibited greater ankle toe-off angles (117° as opposed to 112°). These differences however were not statistically significant.
Table 4 Lower limb joint angles for all participants (mean ± SD)
Hip Knee Ankle
Initial contact (°)
Toe-off (°)
Initial contact (°)
Toe-off (°)
Initial contact (°)
Toe-off (°)
Lap 1 28 (± 5) -11 (± 3) 151 (± 4) 154 (± 3) 103 (± 5) 115 (± 5)
Lap 2 28 (± 5) -11 (± 3) 151 (± 5) 154 (± 3) 102 (± 4) 115 (± 6)
Lap 3 26 (± 4) -12 (± 3) 152 (± 4) 155 (± 2) 103 (± 4) 115 (± 6)
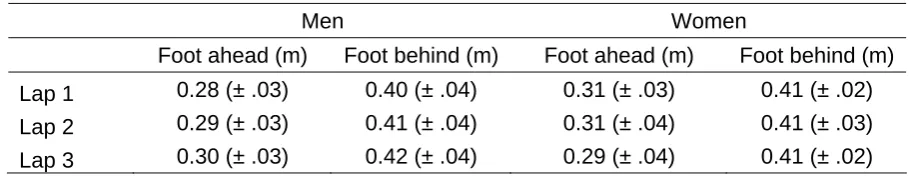
The distance between the body’s centre of mass and the foot’s centre of mass at initial contact (‘foot ahead’) and toe-off (‘foot behind’) are shown in Table 5. The overall mean values for the distance of the foot behind remained constant at 0.41 m throughout the race. Following lap 2 the distance of the foot ahead decreased from 0.30 m to 0.29 m, however no significant differences were evident. The men participants’ mean distance of the foot behind increased constantly throughout the race; an initial value of 0.40 m during lap 1, progressing to 0.41 m, and finally 0.42 m in lap 3. A similar increase was evident for the distance of the foot ahead in men: 0.28 m, 0.29 m and 0.30 m respectively. The women participants’ mean distance of the foot behind the CM remained constant at 0.41 m throughout the course of the race. The distance ahead of the CM remained stable at 0.31 m up to lap 2, decreasing to 0.29 m during the final lap. The male and female participants exhibited similar mean foot ahead and foot behind lengths. No significant differences were found between genders.
Table 5 Position of the foot ahead and behind the body at contact and toe-off (mean ± SD)
Men Women
Foot ahead (m) Foot behind (m) Foot ahead (m) Foot behind (m)
Lap 1 0.28 (± .03) 0.40 (± .04) 0.31 (± .03) 0.41 (± .02)
Lap 2 0.29 (± .03) 0.41 (± .04) 0.31 (± .04) 0.41 (± .03)
Lap 3 0.30 (± .03) 0.42 (± .04) 0.29 (± .04) 0.41 (± .02)
[image:4.595.67.522.631.719.2]decreased continually through the three laps, women’s speed showed an increase from lap 2 to 3. This may have been due to the women slipstreaming behind the men during the final lap; it appeared from the video recordings that the women used the men as pace makers, possibly contributing to their increase in speed in the later stages of the race. Kyle (1979) estimated a 40% reduction in air resistance (consequently a 3% reduction in energy expenditure) when drafting 2 m behind another runner.
Results obtained in the present study support the notion that step length decreases partly due to changes in lower limb joint angles (Siler and Martin, 1991). Although step length decreased overall for men and women during the race (men by 0.05 m and women by 0.07 m), the changes were a reflection of the speed alterations; men decreased constantly whereas the women exhibited an increase following lap 2. Cadence decreased coinciding with increases in step and contact time, and changes in hip extension at toe-off.
It is possible that angles during the recovery leg’s swing phase account for the decrease in step length. A decrease in knee flexion may occur due to muscular fatigue and an unconscious attempt to reduce stress on the hamstring muscles. As the hamstrings fatigue, this inhibits increased knee flexion, increasing the moment of inertia. The resultant increase causes less angular velocity, restricting the swing phase, and hence causing smaller steps. Although not significant, men and women exhibited different joint angle adaptations with fatigue. The difference in knee angle at toe-off may reflect gender differences and running economy. These patterns are associated with better running economy for the respective gender. Changes in knee angle as fatigue ensued may have been an unconscious attempt to reduce energy expenditure.
Changes in landing distance affect acceleration and subsequently speed due to braking effects. The slight changes in landing technique, including the distance of the foot ahead of the CM and the ankle angles may reflect a compensatory strategy. No significant differences in the joint angles or the distances of the foot ahead and behind the CM were found. This suggests fatigue did not affect these variables.
CONCLUSION: The decrease in speed was a product of a decrease in step length and cadence. Step length decreased due to increased hip and knee angles at toe-off. Cadence however decreased due to increases in contact and step time, and hyperextension at toe-off. Consequently, fatigue had an effect on important gait parameters as early as 2,400 m. The women appeared to counter fatigue through technical strategies, such as slipstreaming to reduce air resistance and using other runners to pace themselves. Runners should consciously aim to run at a constant pace, or to have a negative time split (and within a group if possible), to delay the onset and effects of fatigue.
REFERENCES:
Anderson, T. (1996). Biomechanics and running economy. Sports Medicine, 22(2), 76-89
Elliot, B. & Ackland, T. (1981). Biomechanical effects of fatigue on 10,000 meter running technique.
Research Quarterly for Exercise and Sport, 52, 160-166.
Kyle, C. R. (1979). Reduction of wind resistance and power output of racing cyclists and runners travelling in groups. Ergonomics, 22:387-397.
Siler, W. L. & Martin, P. E. (1991). Changes in running pattern during a treadmill run to volitional exhaustion: Fast versus slower runners. International Journal of Sport Biomechanics, 7, 12-28.
Williams, K. R., Snow, R., & Agruss, C. (1991). Changes in distance running kinematics with fatigue.
International Journal of Sport Biomechanics, 7, 138-162.