Citation:
Thurlow, S and Oldroyd, B and Hind, K (2017) Effect of hand positioning on iDXA total and regional bone and body composition parameters and precision error. Journal of Clinical Densitometry, 21 (3). pp. 375-382. ISSN 1094-6950 DOI: https://doi.org/10.1016/j.jocd.2017.03.003
Link to Leeds Beckett Repository record: http://eprints.leedsbeckett.ac.uk/3628/
Document Version: Article
Creative Commons: Attribution-Noncommercial-No Derivative Works 4.0
The aim of the Leeds Beckett Repository is to provide open access to our research, as required by funder policies and permitted by publishers and copyright law.
The Leeds Beckett repository holds a wide range of publications, each of which has been checked for copyright and the relevant embargo period has been applied by the Research Services team.
We operate on a standard take-down policy. If you are the author or publisher of an output and you would like it removed from the repository, please contact us and we will investigate on a case-by-case basis.
1
Effect of hand positioning on iDXA precision error for total and regional bone and body
composition parameters.
Abstract
2
Key words: DXA; precision error; measurement protocol; fat mass; lean mass; bone mineral content.
Introduction
Dual energy X-ray absorptiometry (DXA) is a non-invasive, rapid method of measuring three components of body composition: fat mass (FM), lean mass (LM) and bone mineral content (BMC), providing precise quantification at the total body and regional (left and right arms, legs and trunk) level. Over the last decade, there has been a rise in the use of DXA for the assessment of body composition in obesity (1), ageing (2) and in athletes (3-5), most likely reflecting increased availability, quicker scan acquisition times and improved resolution and image quality with fan beam densitometers. The low effective radiation dose of total body DXA, which is typically around 2-6 µSv depending on scan mode, means that the technology is also suitable for longitudinal monitoring of body composition. Longitudinal DXA body composition studies have included investigations of the effect of exercise training (6, 7), of athletic competition (8, 9, 10) and dietary interventions (11, 12).
3
recommend that positioning for total body scans follow the instructions of the National Health and Nutrition Examination Survey (NHANES) 2011 protocol with hands placed in the prone position isolated from the hip, and with legs supported together by a Velcro strap (15). However, with the greater body size of obese subjects and athletes from certain sports, there is a problem of accurately positioning these subjects within the lateral boundaries of the scanning table. As such, the recent software release from GE Lunar (Encore version 15.0) recommends that hands should now be placed in the mid-prone position with a space of >1 cm between the hands and hip. This position reduces the scan width of the subject enabling the subject to fit within the scan boundaries and is supported by the detailed methodological work of Nana and colleagues (16).
To our knowledge, only one study to date has investigated the effects of the two hand positioning protocols on DXA outcomes, using a pencil beam GE-Lunar DPX
4 Materials and Methods
Study group and study design
The study group consisted of 38 physically active male adults with a mean age of 27.1 ± 12.1 years who participated in at least 3 hours of physical activity per week (>12 months). Approval for the study was provided by the University Faculty Research Ethics Committee and informed signed consent was attained before scans, from all volunteers. All activities performed in this study were in accordance with The Declaration of Helsinki.
5
DXA scan mode and positioning protocols
The manufacturer's guidelines state that the standard mode is used for an estimated body thickness between 16 and 25 cm, and the thick scan mode, for an estimated body thickness greater than 25 cm. Scans conducted in the thick mode have an increased acquisition time from ~7 to ~14 min and an increased dose rate from 3.0 µGy to 6.0 µGy compared to the standard scan mode. In the current study, 23 subjects were scanned in standard mode and 15 in thick mode, over a period of 8 weeks.
Participants were positioned centrally on the scanning bed (65 cm wide and 196 cm in length) within the transverse scan width of the densitometer with feet separated by 15 cm and supported with a Velcro strap. On the scanning bed, the maximum separation between arm and trunk was set and the palm of the hand was placed on the bed (hand prone). All scan images in this study were within the scan field of the densitometer and accurate adjustment of the regions of interest could be made. For the hand in the mid-prone position, there was at least a 5cm space between the palm and thigh, the thumb was placed in line with the first finger and the arms were easily placed within the scan region.
Scan analysis
6
pelvis and a portion of the medial thigh. The android region of interest (ROI) is at the lower boundary of the pelvis cut and the upper boundary above the pelvis cut 20% of the distance between pelvis and neck cuts. Lateral boundaries are the arm cuts. The gynoid ROI upper boundary is below the pelvis cut by 1.5 times the height of the android ROI, and the gynoid ROI height is equal to two times the height of the android ROI. The lateral boundaries are the outer leg cuts. For consistency, manual ROI analysis of each scan was performed by the same experienced and ISCD certified clinical densitometrist.
Quality assurance (QA) tests were performed using the GE calibration block which has a tissue chamber for %fat with three compositions, high, normal and low. Over the study period the calibration values were %fat (high) = 60.60 ± 0.01; %fat (normal) = 36.55 ± 0.07, %fat (low) = 7.55 ± 0.07, indicating no drifts in soft tissue calibration throughout the study period.
Statistical analysis
7
variance were used to compare the RMS-SD precision errors between prone and mid-prone hand position and standard/thick scan modes. The least significant change (LSC) at the 95% confidence interval was calculated using the calculation 22* Precision. Statistical significance was defined as p ≤ 0.05.
Results
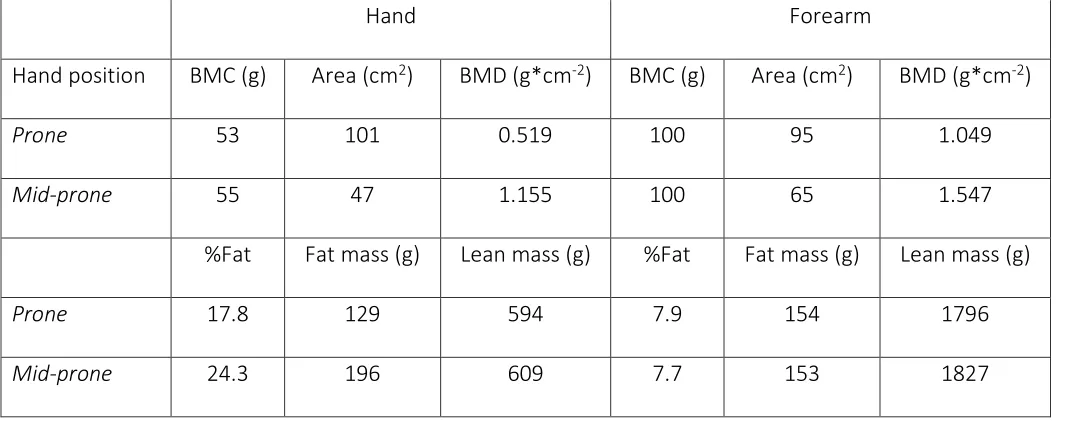
The physical characteristics of the two study groups are given in Table 1. Figure 1 indicates the differences in the scan position of the hands. In the mid-prone position both the hand and forearm have reduced bone area. Regions of interest were placed at the hand and forearm of a single subject to determine bone and body composition differences between the two hand positions (Table 2). With the hand in the mid-prone position, bone analysis indicated reduced bone area at both the hand and forearm (the radius and ulna observed as a single bone) with no change in BMC, hence BMD of the hand and forearm regions were increased. Body composition analysis of the hand region in the mid-prone position indicated an increase in FM with LM unchanged. No differences were observed in the forearm FM or LM between the two hand positions.
8
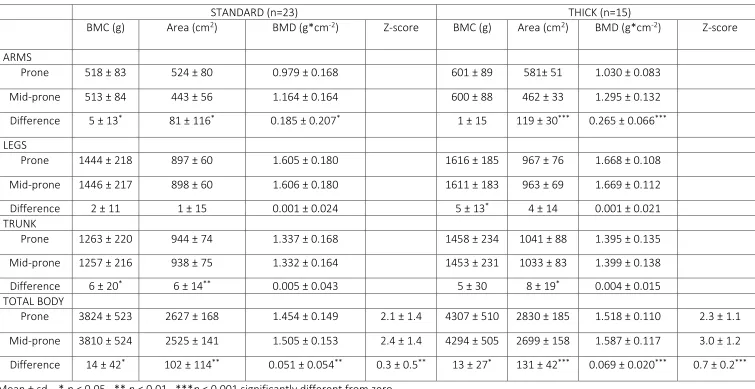
observed with the hand in the mid-prone position in the trunk region for BMC (6 g, p < 0.05) and area (6 cm2, p < 0.01).
Similar results were observed for the thick scan mode. With the hand in the mid-prone position a highly significant decrease in arm bone area (119 cm2; p < 0.001) resulted in a highly significant increase in arm BMD (0.265 g*cm-2; p < 0.001). For total body there was a small significant increases in BMC (13 g, p < 0.05) and a significant decrease in area (131 cm2, p < 0.001) and a highly significant increase in BMD (0.069 g*cm-2; p<0.001) and Z-score 0.7 (p < 0.001). Small significant decreases were observed in the leg BMC (5 g; p < 0.05) and trunk area (8 cm2; p < 0.05).
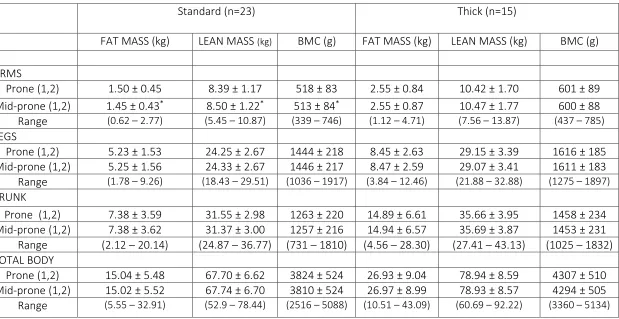
The effect of hand positioning on total and regional body composition parameters for the two scan modes are given in Table 4. The only significant differences were observed in the arm region with the standard scan mode. With the hand in the mid-prone position, a significantly lower fat mass (0.05 kg; p<0.05) and BMC (5 g; p < 0.05) with an increased lean mass (0.11 kg; p < 0.05) were observed compared to the hand prone position. No significant differences
9
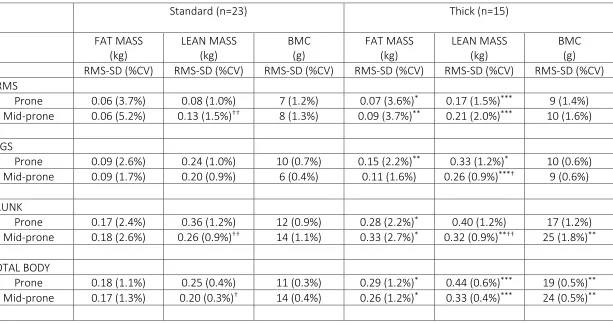
The effect of hand positioning on precision error (RMS-SD) for the standard and thick scan modes for total and region body composition measurements are given in Table 5. For the standard mode with the hand in the mid-prone position a significant reduction in lean mass precision error was observed for the arm region (0.08 kg to 0.13kg; p < 0.01) with significant improvements in lean mass precision errors at the trunk (0.36 kg to 0.26kg; p < 0.01) and total body (0.25kg to 0.20kg; p < 0.05). Hand positioning had no significant effect on fat mass or BMC precision error. Thick scan mode and hands in the mid-prone position showed significantly improved precision error for lean mass at the legs (0.33 kg to 0.26 kg, p < 0.05) and trunk (0.40 kg to 0.32 kg; p < 0.01) compared to hands in the prone position. Fat mass and BMC precision errors were comparable between hand positions.
The thick scan mode had significantly higher precision error values compared to the standard mode for most body composition parameters (p < 0.05 – 0.001) with but with comparable %CV. Therefore there will be different LSC values for body composition parameters between standard and thick scan mode
10 Discussion
This study was performed to determine if differences exist in body composition parameters, precision error and LSC between DXA total body measurements conducted with the hands placed prone (NHANES) and the hands placed mid-prone. Our main finding was that total body and arm BMD are not comparable between the two hand positioning protocols. With the hand in the mid-prone position the radius and ulna are observed as a single bone. This results in a small significant reduction in arm and total body BMC and highly significant reduction of arm and total body bone area, resulting in an increase of BMD at the arm and total body with the hand in the mid-prone position. This also resulted in an increase in total body BMD Z-score. Technologists must be aware that the BMD reference data will have been derived with the hands prone and advised to ensure consistency in total body DXA longitudinal measurement patient positioning.
The only difference observed in body composition parameters between the two hand positions was at the arm, where we found a small significant reduction in fat mass and a small significant increase in lean mass with the hands in the mid-prone position. The absence of differences in bone and body composition parameters at the leg and trunk regions plausibly reflects that only the hand and forearm positioning differed between the two protocols.
11
has only been one other previous study comparing the effects of prone and mid-prone hand positioning on total and regional body composition outcomes (17). The study was performed on a pencil beam GE-Lunar DPX densitometer using positioners at the hands and feet, and it was concluded that scanning subjects with the hands in the mid-prone position improves precision error for regional (arms and trunk) fat mass and BMC. However, the authors also report that the two protocols give substantially different body composition assessments.
There are advantages and disadvantages associated with both hand positioning protocols. Hands mid-prone provides a more feasible position when performing scans in obese or athletic subjects who are broad at the shoulders because in this position, it is easier to place subjects within the scan boundaries and facilitates precision in cuts for regional analysis. This would also reduce the need for conducting half-body scans in such scenarios. Attention should be given to the positioning protocols used for reference data. The major reference databases for total body densitometry, such as NHANES, were acquired using the hands prone position and therefore is not compatible for comparison of scans that are acquired using the hands mid-prone position.
12
Our findings should be interpreted with consideration that the two groups of subjects (n = 23 and n = 15) are less than the ISCD recommended study group size (14). Further research work is needed to determine if the effect of positioners at the hands and feet would reduce the precision error.
Conclusions
Total body DXA scans are not comparable for total BMD, regional arm fat mass and the associated precision error when interchanging hand positioning from hands prone to hands mid-prone. We clarify the importance of consistency in hand positioning for longitudinal monitoring and for standardised practice within a centre. As best practice, published DXA-based studies and reports for clinic-DXA-based total body assessments should ensure that subject positioning is fully described. It is also recommended that attention is given to the hand positioning used for reference data.
References
1. Camhi SM, Katzmarzyk PT. 2014 Differences in body composition between metabolically healthy obese and metabolically abnormal obese adults. Int J Obesity. 38:1142-1145.
2. Szulc P, Duboeuf F, Chapurlat R. 2016 Age related changes in fat mass and distribution in men- the cross sectional STRAMBO study. J Clin Densitom. Sept 2.
13
4. Lees MJ, Hind K. 2015 Total, regional and unilateral body composition of professional English first class cricket fast bowlers. J Sports Sci. 1:34:252-8.
5. Prokop NW, Reid RE, Andersen RE. 2016 Seasonal Changes in Whole Body and Regional Body Composition Profiles of Elite Collegiate Ice-Hockey Players. J Str Condit Res. 1:30:684-92.
6. Argus CK, Gill N, Keogh J, Hopkins WG, Beaven CM. 2010 Effects of a short-term pre-season training programme on the body composition and anaerobic performance of professional rugby union players. J Sports Sci. 28:6:679-686.
7. Sillanpaa E, Hakkinen A, Hakkinen K. 2013 Body composition changes by DXA,BIA and skinfolds during exercise training in women. Eur J App Physiol. 113:9:2331-2341.
8. Harley JA, Hind K, O’Hara JP. 2011 Three compartment body composition changes in elite
rugby league players during a super season measured by dual-energy x-ray absorptiometry. J Strength Cond Res. 25:4:1024-1029.
9. Georgeson EC, Weeks BK, McLellen C, Beck BR. 2012 Seasonal change in bone muscle and fat in professional rugby league players and its relationship to injury: a cohort study. BMJ Open doi: 10.1136/bmj open-2012-001400.
10. Lees MJ, Oldroyd B, Jones B, Brightmore A, O’Hara J, Barlow MJ, et al. 2016 Three-compartment body composition changes in professional rugby union players over one competitive season: A team and individualized approach. J Clin Densitom.
14
12. Ispoglou T, White H, Preston T, McElhone S, McKenna J, Hind K. 2016 Double-blind, placebo-controlled pilot trial of L-Leucine-enriched amino-acid mixtures on body composition and physical performance in men and women aged 65–75 years. Eur J Clin Nutr. 70:2:182-188.
13. Baim S, Wilson CR, Lewiecki EM. 2005 Precision assessment and radiation safety for dual energy X-ray absorptiometry : position paper f the International Society for Clinical Densitometry. J Clin Densitom. 8:371-378.
14. Hangartner TN, Warner S, Braillon P, Jankowski L, Shepherd J. 2013 The Official Positions of the International Society for Clinical Densitometry: acquisition of dual-energy X-ray absorptiometry body composition and considerations regarding analysis and repeatability of measures. J Clin Densitom. 31:16:520-36.
15. National Health and Nutrition Examination Survey (NHANES). 2011 Body Composition Procedures Manual.
16. Nana A, Slater GJ, Hopkins WG, Burke LM. 2012 Techniques undertaking whole-body scans to estimate body composition in tall and/or broad subjects. Int J Sport Nutr Exerc Metab. 22: 313-322.
17. Kerr A, Slater GJ, Byrne N, Nana A. 2016 Reliability of 2 different positioning protocols for dual-energy x-ray absorptiometry measurements of body composition in healthy adults. J Clin Densitom. 19:3: 282 – 289
15
19. Barlow MJ, Oldroyd B, Smith D, Leeds MJ, Brightmore A, Till K, et al. 2015 Precision error in dual-energy x-ray absorptiometry body composition measurements in elite male rugby league players. J Clin Densitom. 18:4:546-550.
20. Rothney MP, Martin FP, Xia Y, Beaumont M, Davis C, Ergun D, et al. 2012 Precision of GE Lunar iDXA for the measurement of total and regional body composition in nonobese adults. J Clin Densitom. 15:4:399-404.
21. Hind K, Oldroyd B, Truscott JG. 2011 In-vivo precision of the GE Lunar iDXA densitometer for the measurement of total body composition and fat distribution in adults. Eur J Clin Nutr. 65:140-142.
16
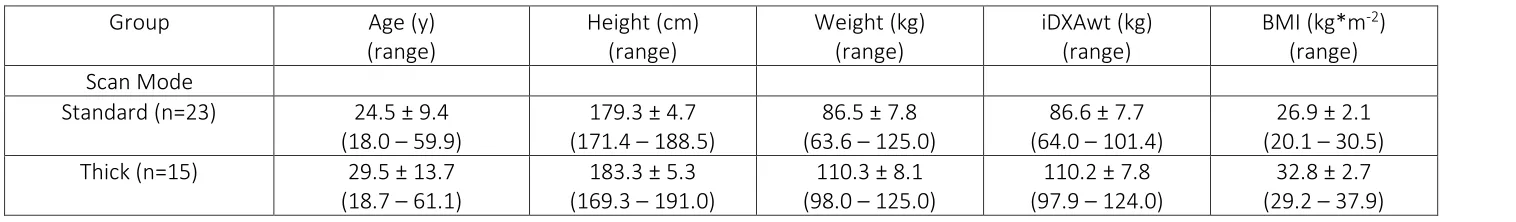
Table 1 Physical characteristics of the two study groups.
Group Age (y)
(range) Height (cm) (range) Weight (kg) (range) iDXAwt (kg) (range)
BMI (kg*m-2)
(range) Scan Mode
Standard (n=23) 24.5 ± 9.4 (18.0 – 59.9)
179.3 ± 4.7 (171.4 – 188.5)
86.5 ± 7.8 (63.6 – 125.0)
86.6 ± 7.7 (64.0 – 101.4)
26.9 ± 2.1 (20.1 – 30.5) Thick (n=15) 29.5 ± 13.7
(18.7 – 61.1)
183.3 ± 5.3 (169.3 – 191.0)
110.3 ± 8.1 (98.0 – 125.0)
110.2 ± 7.8 (97.9 – 124.0)
17
Table 2. Differences in iDXA bone and body composition parameters of the hand and forearm according to hand position, derived from a single
subject’s total body scan.
Hand Forearm
Hand position BMC (g) Area (cm2) BMD (g*cm-2) BMC (g) Area (cm2) BMD (g*cm-2)
Prone 53 101 0.519 100 95 1.049
Mid-prone 55 47 1.155 100 65 1.547
%Fat Fat mass (g) Lean mass (g) %Fat Fat mass (g) Lean mass (g)
Prone 17.8 129 594 7.9 154 1796
18
Table 3 Mean, standard deviation and differences of regional and total body bone parameters with the hand in the prone and mid-prone positions for the two scan modes
STANDARD (n=23) THICK (n=15)
BMC (g) Area (cm2) BMD (g*cm-2) Z-score BMC (g) Area (cm2) BMD (g*cm-2) Z-score
ARMS
Prone 518 ± 83 524 ± 80 0.979 ± 0.168 601 ± 89 581± 51 1.030 ± 0.083
Mid-prone 513 ± 84 443 ± 56 1.164 ± 0.164 600 ± 88 462 ± 33 1.295 ± 0.132
Difference 5 ± 13* 81 ± 116* 0.185 ± 0.207* 1 ± 15 119 ± 30*** 0.265 ± 0.066***
LEGS
Prone 1444 ± 218 897 ± 60 1.605 ± 0.180 1616 ± 185 967 ± 76 1.668 ± 0.108
Mid-prone 1446 ± 217 898 ± 60 1.606 ± 0.180 1611 ± 183 963 ± 69 1.669 ± 0.112
Difference 2 ± 11 1 ± 15 0.001 ± 0.024 5 ± 13* 4 ± 14 0.001 ± 0.021
TRUNK
Prone 1263 ± 220 944 ± 74 1.337 ± 0.168 1458 ± 234 1041 ± 88 1.395 ± 0.135
Mid-prone 1257 ± 216 938 ± 75 1.332 ± 0.164 1453 ± 231 1033 ± 83 1.399 ± 0.138
Difference 6 ± 20* 6 ± 14** 0.005 ± 0.043 5 ± 30 8 ± 19* 0.004 ± 0.015
TOTAL BODY
Prone 3824 ± 523 2627 ± 168 1.454 ± 0.149 2.1 ± 1.4 4307 ± 510 2830 ± 185 1.518 ± 0.110 2.3 ± 1.1
Mid-prone 3810 ± 524 2525 ± 141 1.505 ± 0.153 2.4 ± 1.4 4294 ± 505 2699 ± 158 1.587 ± 0.117 3.0 ± 1.2
Difference 14 ± 42* 102 ± 114** 0.051 ± 0.054** 0.3 ± 0.5** 13 ± 27* 131 ± 42*** 0.069 ± 0.020*** 0.7 ± 0.2***
19
Table 4 Mean, standard deviation and ranges of regional and total body composition parameters with the hand in the prone and mid-prone positions for the two scan modes.
Standard (n=23) Thick (n=15)
FAT MASS (kg) LEAN MASS (kg) BMC (g) FAT MASS (kg) LEAN MASS (kg) BMC (g)
ARMS
Prone (1,2) 1.50 ± 0.45 8.39 ± 1.17 518 ± 83 2.55 ± 0.84 10.42 ± 1.70 601 ± 89 Mid-prone (1,2) 1.45 ± 0.43* 8.50 ± 1.22* 513 ± 84* 2.55 ± 0.87 10.47 ± 1.77 600 ± 88
Range (0.62 – 2.77) (5.45 – 10.87) (339 – 746) (1.12 – 4.71) (7.56 – 13.87) (437 – 785) LEGS
Prone (1,2) 5.23 ± 1.53 24.25 ± 2.67 1444 ± 218 8.45 ± 2.63 29.15 ± 3.39 1616 ± 185 Mid-prone (1,2) 5.25 ± 1.56 24.33 ± 2.67 1446 ± 217 8.47 ± 2.59 29.07 ± 3.41 1611 ± 183 Range (1.78 – 9.26) (18.43 – 29.51) (1036 – 1917) (3.84 – 12.46) (21.88 – 32.88) (1275 – 1897) TRUNK
Prone (1,2) 7.38 ± 3.59 31.55 ± 2.98 1263 ± 220 14.89 ± 6.61 35.66 ± 3.95 1458 ± 234 Mid-prone (1,2) 7.38 ± 3.62 31.37 ± 3.00 1257 ± 216 14.94 ± 6.57 35.69 ± 3.87 1453 ± 231 Range (2.12 – 20.14) (24.87 – 36.77) (731 – 1810) (4.56 – 28.30) (27.41 – 43.13) (1025 – 1832) TOTAL BODY
20
Table 5 iDXA precision for regional and total body composition parameters and scan mode with the hands in prone and mid-prone positions.
Standard (n=23) Thick (n=15)
FAT MASS (kg)
LEAN MASS (kg)
BMC (g)
FAT MASS (kg)
LEAN MASS (kg)
BMC (g) RMS-SD (%CV) RMS-SD (%CV) RMS-SD (%CV) RMS-SD (%CV) RMS-SD (%CV) RMS-SD (%CV) ARMS
Prone 0.06 (3.7%) 0.08 (1.0%) 7 (1.2%) 0.07 (3.6%)* 0.17 (1.5%)*** 9 (1.4%)
Mid-prone 0.06 (5.2%) 0.13 (1.5%)†† 8 (1.3%) 0.09 (3.7%)** 0.21 (2.0%)*** 10 (1.6%)
LEGS
Prone 0.09 (2.6%) 0.24 (1.0%) 10 (0.7%) 0.15 (2.2%)** 0.33 (1.2%)* 10 (0.6%)
Mid-prone 0.09 (1.7%) 0.20 (0.9%) 6 (0.4%) 0.11 (1.6%) 0.26 (0.9%)***† 9 (0.6%)
TRUNK
Prone 0.17 (2.4%) 0.36 (1.2%) 12 (0.9%) 0.28 (2.2%)* 0.40 (1.2%) 17 (1.2%)
Mid-prone 0.18 (2.6%) 0.26 (0.9%)†† 14 (1.1%) 0.33 (2.7%)* 0.32 (0.9%)**†† 25 (1.8%)**
TOTAL BODY
Prone 0.18 (1.1%) 0.25 (0.4%) 11 (0.3%) 0.29 (1.2%)* 0.44 (0.6%)*** 19 (0.5%)**
Mid-prone 0.17 (1.3%) 0.20 (0.3%)† 14 (0.4%) 0.26 (1.2%)* 0.33 (0.4%)*** 24 (0.5%)**