TRANSMISSION OF VOLATILITY IN INDIAN STOCK MARKETS
Prashant Joshi, Professor and Head, Department of Management, Uka Tarsadia University, Bardoli.
ABSTRACT
The study examines the return and volatility spillover among BSE and NSE of Indian Stock
Markets using asymmetric GARCH-BEKK model during January 1, 2012 to April 4, 2014. We
find evidences of bidirectional shock and volatility spillover among the stock markets. The study
detects bidirectional cross-market asymmetric volatility responses between the two indices.
Keywords:Volatility spillovers, Unit Root Test, Multivariate GARCH, Asymmetric volatility
JEL Classification: C32, G15
1.
Introduction
The growing integration of financial markets has prompted several empirical studies to examine
the mechanism through which stock market movements are transmitted. These studies evaluate
how stock returns in one stock market influence the returns of other stock markets. These studies
further examine their implications for pricing securities, for hedging, other trading strategies and
for framing regulatory policies. These issues have been of heightened interests to all the
participants in the stock markets in the wake of October 1987 international crash of stock
markets that saw large correlated price movements across most of the stock markets of the world.
It has lead to introduction of various regulations and institutional rules to dampen the
cross-market impact of large stock movements.
The extent of the linkage between financial markets improves access to capital markets. Strong
linkage reduces the insulation of the emerging stock markets from external shocks, hence
limiting the scope for independent monetary policy (Li, 2007). From the perspective of the
global investors, weak stock market linkage in the form of less than perfect correlation between
their returns offers potential gains from international portfolio diversification, while strong
market linkage or co-movement in returns eliminates the potential benefits of diversification.
The present study tries to analyze volatility spill over among Indian stock markets using
multivariate GARCH models.
2.
Literature Review
Although there is no dearth of literature on financial integration, there are only a few studies
related to stock markets of India. Moreover, the limited literature on the emerging stock markets
in India has studied the co-movements between the stock markets using cointegration and Vector
Autoregression framework (Eun and Shin, 1989,Chung and Ng, 1992, Bhattacharya and
Samantha, 2001, Wong, Agrawal and Du, 2005, Voronkova, 2004, Ahmad, Ashraf and Ahmed,
2005, Chelley and Steeley, 2005, Yang, Hsiao, Li and Wang, 2006, Hoque, 2007). The studies
It is believed that if markets are integrated, an unanticipated event in one market will influence
not only returns but also variance in the other markets. The analysis of volatility is particularly
important because it can proxy for the risk of assets. Scheicher(2001) studied the regional and
global integration of stock markets in terms of return and volatility shocks in Hungary, Poland
and Czech Republic and Financial Times/S&P‟s world actuaries index by using
MGARCH(Multivariate Generalized Auto regressive conditional heteroscedasticity) with a
constant conditional correlation. Using daily closing price values of the stock markets from
January 1, 1995 to October 7, 1997, results revealed that the emerging stock exchanges were
integrated with the global market, proxied by Financial Times S&P‟s actuaries‟ world index only
in terms of return. MGARCH results showed that the regional influences were the major cause of
volatility of the markets. International volatility had no impact on the markets.
Chou, Lin and Wu (1999) examined the price and volatility linkages of Taiwan stock market
with United States using close-to-open, open-to-close and close-to-close returns of indices of
Taiwan known as Taikex and United states‟ Standard and Poor‟s 500 (S&P 500) composite
index during January 1, 1991 to December 31, 1994. The results found that the volatility and
return spilt over from US to Taiwan. The results of MGARCH indicated some important linkage
from the US stock market to the Taiwan stock market. The spillover effects occurred for both the
mean and the variance of Taiwan Stock returns. It further pointed out that the volatility in US
stock markets affected total daily volatilities of the Taiwan stock market.
Karolyi (1995) examined the short run dynamics of returns and volatilities for stocks traded on
the New York Stock Exchange (NYSE) and Toronto stock exchange (TSE) of Canada by
applying multivariate GARCH and Vector autoregression models in time series of daily stock
market indices at the close of markets in terms of local currency for S&P 500 and TSE 300
during April 1, 1987 to December 29, 1989. Results of MGARCH indicated the return and
volatility spillovers from S&P 500 to TSE 300. The effects of shocks of return and volatility
from NYSE to TSE measured by MGARCH were smaller and less persistent.
Harris and Pisedtasalasai (2006) applied constant conditional correlation MGARCH framework
(FTSE)100, FTSE 200 and FTSE small cap equity indices of UK stock market using daily return
during January 1, 1986 to December 2002 using GJR specifications of MGARCH model to
capture asymmetric effect. The study found that return and volatility transmission mechanism
between large and small stocks in the UK were asymmetric. There were significant positive
spillover effects from portfolio of larger stocks to the portfolio of smaller stocks.
Worthington and Higgs (2004) examined the transmission of equity returns and volatility among
three developed Asian markets (Hong Kong, Japan and Singapore) and six emerging markets of
Asia (Indonesia, Korea, Malaysia, the Philippines, Taiwan and Thailand) using weekly returns
from January 15, 1988 to October 6, 2000. They employed BEKK parameterization of
multivariate GARCH model to identify the source and magnitude of volatility spillover. The
study found the presence of positive mean and volatility spillovers. The mean return spillovers
from the developed markets to the emerging markets were not homogenous across the emerging
markets. Application of MGARCH suggested that own stock market volatility spillovers were
generally higher than cross-volatility spillovers for all markets, especially for emerging stock
markets. Li (2007) examined the linkages between the two emerging stock exchanges namely
Shanghai and Shenzen of China and the established stock markets Heng Seng of Hong Kong and
S & P of the US by a multivariate GARCH-BEKK framework using the daily share price indices
of the stock markets, January 4, 2000 to August 17, 2005. The results indicated that there was no
evidence of spillover effect in terms of return and volatility between the stock exchanges in
China and US market. There was an evidence of unidirectional volatility spillover from stock
exchange in Hong Kong to those in Shanghai and Shenzhen. The study found that Chinese stock
exchanges were integrated with the regional developed stock exchange in Hong Kong but the
extent of the linkages between the stock exchange in Hong Kong and China was weak. The
results further showed that there was a bidirectional shock spillover between the two Chinese
stock exchanges. The study also found that there was an asymmetric response of volatility in all
four stock exchanges under study.
Although there is a voluminous literature on equity market integration internationally, little
the light of the review of the existing literature on the linkages between the various stock
markets, the present study tries to analyze volatility spill over among Indian stock markets using
MGARCH-BEKK framework. The rest of the paper is organized as follows. Data and
Preliminary Analysis are presented in Section 3. Section 4 provides research design used in the
study. Empirical results are discussed in Section 5. Section 6 summarizes.
3.
Data and Preliminary Analysis
The study uses data on daily closing price of Sensex of Bombay Stock Exchange (BSE) and
Nifty of National Stock Exchange (NSE) of India from January 2, 2012 to April 4, 2014
consisting of 568 observations. The data are obtained from www.bseindia.com and
www.nseindia.com. The period is the most recent one to examine the return and volatility
spillover among the stock markets during the period.
Daily returns are identified as the first difference in the natural logarithm of the closing index
value for the two consecutive trading days for the six indices. The indices used in this study are
widely accepted bench mark indices for Indian stock markets.
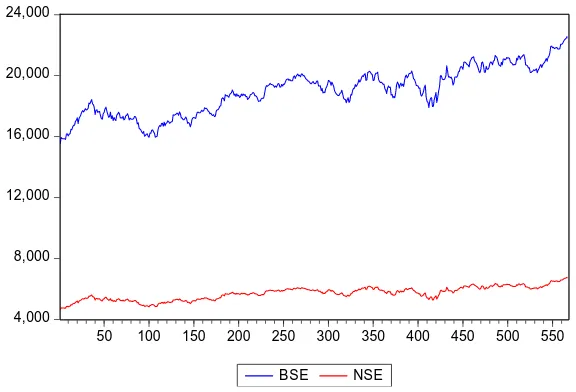
Figure 1 presents time plot of the price series of the stock markets. The first impression is that all
the indices follow a similar movement.
Figure 2 represents the returns of the share price indices, the first difference of the natural
logarithm of the share price indices, during the period under study. The two indices are
characterized by volatility clustering where large (small) volatility followed by large (small)
volatility. As the cluster tends to occur simultaneously, between the indices, volatility must be
modeled systematically.
4,000 8,000 12,000 16,000 20,000 24,000
50 100 150 200 250 300 350 400 450 500 550
BSE NSE
Figure 2: Returns of the share price indices
-.05 -.04 -.03 -.02 -.01 .00 .01 .02 .03 .04
50 100 150 200 250 300 350 400 450 500 550
[image:6.612.162.450.87.283.2]RBSE RNSE
[image:6.612.145.426.320.525.2]Table 1 reports the summary statistics for the return series.
Table 1: Summary statistics of returns series Summary
Statistics RBSE RNSE Mean 0.000644 0.000648 Std. Dev. 0.009803 0.010181 Skewness -0.060749 -0.078196 Kurtosis 4.360228 4.431531 Jarque-Bera 44.06021 48.99207 Probability 0.000000 0.000000
.
The Jarque-Bera statistics reject the null hypothesis that the returns are normally distributed for
all cases. The Stock indices have negative skewness, indicating that large negative stock returns
are more common than large positive returns. Furthermore all the returns series are leptokurtic,
having significantly fatter tails and higher peaks which can be seen from the kurtosis statistics
that are greater than 3. Generalized Autoregressive Conditional Heteroscedasticity (GARCH)
models are capable of dealing with data displaying the above features. When modelling with
GARCH, the nonzero skewness statistics indicate an ARCH order higher than one in the
conditional variance equation. Subsequently, a Multivariate GARCH (1, 1) model should be
preferred to an ARCH (p) model to examine volatility spillover effects for the sake of parsimony
(Li, 2007).
4.
Methodology
On the basis of the features discussed in the previous section, GARCH model is appropriate for
the study. The aim of the paper is to examine the volatility interdependence across both the stock
markets. The following model is used to examine the joint process relating to the share price
indices under study.
1
1
,
/ (0, )
t t t
t t t
Y Y
I N H
Equation 1
Where Yt is a 21 vector of daily returns at time t and is a 22 matrix for parameters
associated with the lagged returns. The 21 vector of random error,t, is the innovation for each
market at time t and has a 22 conditional variance-covariance matrix, Ht. The market
information available at time t-1 is represented by the information set It-1. The 21 vector of α
represents constants. Bollerslev et al. (1988) propose that Ht is a linear function of the lagged
squared errors and cross products of errors and lagged values of the elements of Ht as follows:
1
1 1 1
( ) ( ) ( ) ( ) ( )
q p p
t i t t i i t i i t i
i i i
vech H vech C A vech G vech H D vech H
Equation 2
Where vech is the operator that stacks the lower triangular portion of a symmetric matrix into a
vector. The problems with this formulation are that the number of parameters to be estimated is
large and restrictions on the parameters are needed to ensure that the conditional variance matrix
is positive definite. Engle and Kroner (1995) propose the following new parameterization for Ht,
i.e. the BEKK model, to overcome the above two problems.
G H G A A C C
Ht t1t1 t1
Equation 3
The BEKK model provides cross-market effects in the variance equation parsimoniously and
also guarantees positive semi-definiteness by working with quadratic forms. Kroner and Ng
(1998) propose to extend the BEKK model to allow for the asymmetric responses of volatility,
i.e. stock volatility tends to rise more in response to bad news than positive shocks, in
variance-covariances. D D G H G A A C C
Ht t1t1 t1 t1t1
Equation 4
where tis defined as t if tis negative and zero otherwise. The last term on the right-hand side
captures the asymmetric property of time varying variance-covariance. The notion used in the
equation is as follows:
C is 22 lower triangular matrix of constants while A, G and D are 22 matrices. The diagonal
parameters of matrices A and G measures the effects of own past shocks and past volatility of
market i on its conditional variance, while diagonal parameter in matrix D measure the response
of market i on its own past negative shocks. The off-diagonal parameters in matrices A and G, aij
and gij, measure the cross-market effects of shock and volatility, also known as volatility
spillover, while off-diagonal parameters dij, measures the response of market i on the negative
a variance-covariance matrix. We will use Multivariate GARCH in the style of BEKK proposed
by Engle and Kroner (1995) to analyze volatility spill over among the stock markets.
The BEKK systems can be estimated using maximum likelihood method. The log likelihood
function of the joint distribution is the sum of all the log likelihood functions of the conditional
distributions, i.e. the sum of the logs of multivariate-normal distribution. Letting Lt be the log
likelihood of observation t, n be the number of stock exchanges and L be the joint log likelihood
which gives,
T i t L L 1 t t t tt n H H
L 1
2 1 ln 2 1 ) 2 ln( 2 / Equation 5
5.
Empirical Results
In this section, we perform unit root test to check for nonstationarity of the stock markets series.
We report the estimated results about market linkages. We will look for any statistically
significant cross-market effects as evidence of linkages and measures the extent of the linkages
by the estimated time-varying covariances using MGARCH asymmetric model. We organize the
section as follows. In section 4.1, we discuss Augmented Dickey Fuller Test (ADF) results. In
section 4.2, we report the evidence of market linkages in the estimated six-variable asymmetric
GARCH-BEKK model.
4.1 Unit root test results
Stationarity conditions of the stock market indices are tested by Augmented Dickey-Fuller Test
(ADF). A unit root test is a statistical test for the proposition that in an autoregressive statistical
model of a time series, the autoregressive parameter is one. It is a test for detecting the presence
of stationarity in the series. The early and pioneering work on testing for a unit root in time series
was done by Dickey and Fuller (Dickey and Fuller 1979, Fuller 1981). If the variables in the
regression model are not stationary, then it can be shown that the standard assumptions for
asymptotic analysis will not be valid. In other words, the usual “ratios” will not follow a
t-distribution; hence they are inappropriate to undertake hypothesis tests about the regression
Stationarity time series is one whose mean, variance and covariance are unchanged by time shift. Nonstationary time series have time varying mean or variance or both. If a time series is nonstationary, we can study its behaviour only for a time period under consideration. It is not possible to generalize it to other time periods. It is, therefore, not useful for forecasting purpose.
The presence of unit root in a time series is tested with the help of Augmented Dickey-Fuller
Test. It tests for a unit root in the univariate representation of time series. For a return series Rt,
the ADF test consists of a regression of the first difference of the series against the series lagged
k times as follows:
Equation 6
) ln( ;
1 t t
t t
t r r r R
r
The null hypothesis is H0: 0 and H1: 1. The acceptance of null hypothesis implies
nonstationarity.
We can transform the nonstationary time series to stationary time series either by differencing or
by detrending. The transformation depends upon whether the series are difference stationary or
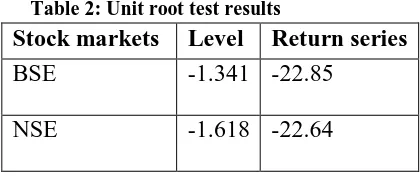
[image:10.612.201.411.424.512.2]trend stationary. We report the results of unit root test in Table 2.
Table 2: Unit root test results
Stock markets Level Return series BSE
-1.341 -22.85
NSE
-1.618 -22.64
Mackinnon‟s test critical values at 1%, 5% and 10% are -3.439, -2.865 and -2.568 respectively.
ADF statistics reported in the Table 2 show that the null hypothesis of a unit root in case of the
indices is rejected. The absolute computed values for all the indices are higher than the
MacKinnon critical value at 1% level. Thus, the results show that the return series are stationary.
As the results suggest that the underlying return series are stationary, our next step is to examine
the stock markets‟ linkages. 1
1 p
t t i t i t
i
r r r
4.2 The Evidence of stock market linkages
Now, we examine the estimated results of the time varying variance-covariance Equation 3 in the
[image:11.612.145.449.174.400.2]system. The results of two-variable asymmetric GARCH model are reported in Table 4.
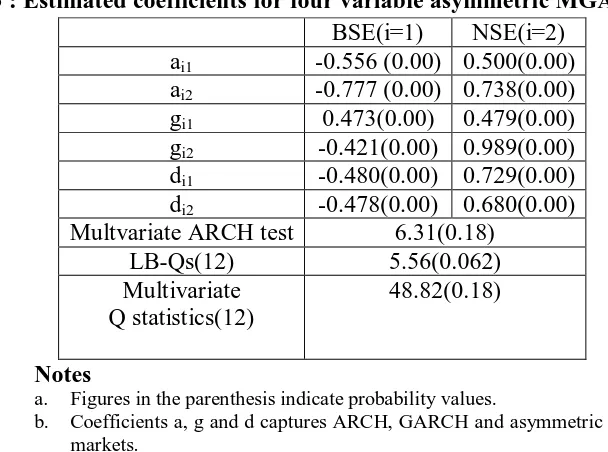
Table 3 : Estimated coefficients for four variable asymmetric MGARCH BSE(i=1) NSE(i=2)
ai1 -0.556 (0.00) 0.500(0.00)
ai2 -0.777 (0.00) 0.738(0.00)
gi1 0.473(0.00) 0.479(0.00)
gi2 -0.421(0.00) 0.989(0.00)
di1 -0.480(0.00) 0.729(0.00)
di2 -0.478(0.00) 0.680(0.00)
Multvariate ARCH test 6.31(0.18) LB-Qs(12) 5.56(0.062) Multivariate
Q statistics(12)
48.82(0.18)
Notes
a. Figures in the parenthesis indicate probability values.
b. Coefficients a, g and d captures ARCH, GARCH and asymmetric GARCH effects in the markets.
Now we examine the estimated results. It can be noted that the Ljung Box Q statistics for the 12
the order and Multvariate Q statistics for 12th orders in standardized and squared standardized
residuals show that there is no series dependence in the residuals indicating the appropriateness
of the fitted variance-covariance equations by the two variable asymmetric BEKK model. The
matrices A and G reported in Table 4 help us to examine the relationship in terms of volatility.
The diagonal elements in matrix A capture the ARCH effect, while the diagonal elements in
matrix G measure the GARCH effect. As shown in Table 3, the estimated diagonal parameters
a11 through a22 are statistically significant implying presence of ARCH effect in the stock
markets while parameters g11 through g22 are all statistically significant, indicating a strong
GARCH (1,1) process driving the conditional variances of all the indices. The magnitude of own
volatility presented by GARCH parameter is highest in NSE suggesting own volatility largely
The off-diagonal elements of matrix A and G capture the cross-market effects such as shock
spillover and volatility spillover among the two stock exchanges. Firstly, we find evidence of
statistically significant bidirectional shock transmissions between BSE and NSE as the pairs of
off-diagonal parameters a12 and a21 are statistically significant. The two way shock spillover
indicates strong connection between the stock markets. The bidirectional shock spillover
indicates the news about shocks in one stock exchange affect the volatility of other stock
exchange and vice-versa. In terms of cross-shock spillover effects in the markets, past
innovations in BSE have the greatest effect (0.777) on future volatility in NSE. The negative
coefficient of A mean that the variance is affected more when the shocks move in opposite
direction than when they move in the same direction. The same is true for negative coefficient in
G.
Secondly, there are bidirectional volatility linkages between BSE and NSE as respective
coefficients in g are statistically significant. It indicates that the conditional variance of one index
depends on past volatility of the other index, implying strong linkages between them.
Own-volatility spillovers in all markets are large and significant. The overall persistence of stock
market volatility is highest for NSE (0.989).
As far as matrix D is concerned, we find evidence of asymmetric responses to negative shocks of
own markets for the stock markets. The sign of the own past shocks affects the conditional
variance of these indices. It is highest in NSE (0.680). We have found the bidirectional
cross-market asymmetric responses between BSE and NSE as their„d‟ parameters are statistically
significant. The negative sign of D coefficients indicate that asymmetric volatility is affected
more when it moves in opposite direction than in the same direction. The asymmetric spillover
effect of NSE has the greatest effect (0.729) on BSE. The results suggest that volatility spillover
from NSE has higher impact on the volatility of BSE.
6.
Summary
The study investigates volatility spillover effect between the stock markets in India. Summary
significantly fatter tails and higher peaks. Generalized Autoregressive Conditional
Heteroscedasticity (GARCH) models are capable of dealing with the property of the data.
By applying a multivariate asymmetric GARCH approach to the daily stock indices, the study
found evidence of linkages in terms of return and volatility. There are evidences of bidirectional
shock transmissions between BSE and NSE. In terms of cross-shock spillover effects in the
markets, past innovations in BSE have the greatest effect (0.777) on future volatility in NSE.
There are bidirectional volatility linkages between BSE and NSE. The overall persistence of
stock market volatility is highest for NSE (1.07).
We find evidence of asymmetric responses to negative shocks of own markets for all the stock
markets. The sign of the own past shocks affects the conditional variance of these indices. We
References:
Ahmad, Ashraf and Ahmed (2005), “Is the Indian stock market integrated with the US and Japanese stock markets?: An empirical analysis”‟ South Asia economic journal,
193-206.
Bhattacharya and Samanta (2001), “A tale of two indices: the story of the NASDAQ and The Sensex”, Journal of Quantitative Economics, 1(1), pp. 89-102.
Bollerslev, Engle and Wooldridge (1988), “A capital asset pricing model with time-varying covariances”, Journal of political economy, 96, 116-131.
Brooks Chris(2008), Introductory Econometrics for Finance, Cambridge University
Press, UK.
Chelley and Steeley (2005), “Modeling equity market integration using smooth transition analysis: a study of eastern European stock markets”, Journal of International Money and
Finance, 24, 818-831.
Chou, Lin and Wu(1999), “Modeling the Taiwan stock market and international linkages”, Pacific Economic Review, 4, 305-320.
Chung Yin-Wong and Ng Lillian (1992), “Interactions Between the U.S. and Japan Stock Market Indices”, Journal of International Financial Markets, Institutions and Money,
2(2), pp. 51-69.
Dickey D. and Fuller W., (1979) „Distribution of the estimates for Autoregressive time series with a unit root‟, Journal of American Statistical Association, 74, 427-31.
Dickey, D. & Fuller W., (1981) „Likelihood Ratio Statistics for Autoregressive Time Series with a Unit Root‟, Econometrica, 49, 1057 – 72
Engle and Kroner(1995), “Multivariate simultaneous generalized ARCH”, Econometric
Theory, 11, 122-150.
Eun C., and Shim S, (1989), “International Transmission of Stock Market Movements”,
Journal of Financial and Quantitative Analysis, 24(2), 241-255.
Hogue (2007), “Co-movement of Bangladesh stock market with other markets: cointegration and error correction approach”, Managerial Finance, 33(10),810-820.
Karolyi (1995), “A Multivariate GARCH model of international transmissions of stock
returns and volatility: The case of the United States and Canada”, Journal of Business and
Economic Studies, 13(1), 11-24.
Kroner, K. and Ng, V.(1998), “Modeling asymmetric comovements of asset returns”, The
review of Financial Studies, 11, 817-44.
Li (2007), “International Linkages of the Chinese stock exchanges: a multivariate GARCH analysis”, Applied Financial Economics, 17, 285-295.
Ng Thiam (2002), “Stock Price Movements in South-East Asia”, Asian Economic
Journal, 16(4), pp.353-77.
Scheicher(2001), “The comovements of stock markets in Hungary, Poland and the Czech republic”, International Journal of Finance and Economics, 6, 27-39.
Voronkova (2004), “Equity market integration in Central European stock markets: A cointegration analysis with shifting regimes”, International Review of Financial Analyst,
13, 633-647.
Wing-Keung Wong & Agarwal Aman & Jun Du, (2005), "Financial Integration for India
Stock Market, a Fractional Cointegration Approach," Departmental Working Papers
wp501, National University of Singapore, Department of Economics.
Worthington and Higgs (2004), “Transmission of Equity returns and volatility in Asian developed and emerging markets: A multivariate GARCH analysis”, International
Journal of Finance and Economics, 9, 71-80.