ISSN 1450-216X Vol.23 No.3 (2008), pp.406-420 © EuroJournals Publishing, Inc. 2008
http://www.eurojournals.com/ejsr.htm
Ductility Behaviour of Reinforced Palm Kernel Shell
Concrete Beams
U. Johnson Alengaram
Department of Civil Engineering, Faculty of Engineering University of Malaya, 50603, Kuala Lumpur, Malaysia
E-mail: [email protected]
Tel: +06-03-79675302; Fax: +06-03-79675318
Mohd Zamin Jumaat
Department of Civil Engineering, Faculty of Engineering University of Malaya, 50603, Kuala Lumpur, Malaysia
Hilmi Mahmud
Department of Civil Engineering, Faculty of Engineering University of Malaya, 50603, Kuala Lumpur, Malaysia
Abstract
This paper presents the results on the structural behavior of palm kernel shell concrete and its comparison with normal weight concrete (NWC). The structural grade palm kernel shell concrete, a lightweight concrete (LWC) produced using palm kernel shell (PKS) an agricultural waste and by-product of the production of palm oil as lightweight aggregate, referred to hereafter as PKSC. The concrete is of grade 30 and the reinforced concrete beams of size 150 mm x 250 mm x 2100 mm were prepared to study the structural behavior. Similar grade concrete using NWC were also prepared and reinforced. The flexural behavior of under-reinforced concrete beams of grade 30 concrete has been studied and the results are compared with NWC beams which were also designed as grade 30 and under-reinforced similar to that of the PKSC beams. Ten percent of silica fume and five percent of class-F fly ash on cement weight were used as additional and cement replacement cementitious materials respectively. Each beam was tested under two-point loading for flexure until failure.
Keywords: Lightweight Aggregates, Palm kernel Shell Concrete, Structural Behavior, Failure Mode, Ductile Behavior
1. Introduction
The high demand for concrete in the construction using normal weight aggregates such as gravel and granite drastically reduces the natural stone deposits and this has damaged the environment thereby causing ecological imbalance (Short and Kinniburgh, 1978). Therefore, there is a need to explore and to find out suitable replacement material to substitute the natural stone. In developed countries, the construction industries have identified many artificial and natural lightweight aggregates (LWA) that have replaced conventional aggregates thereby reducing the size of structural members. This has brought immense change in the development of high rise structures using LWC. However, in Asia the construction industry is yet to utilize the advantage of LWC in the construction of high rise structures.
Malaysia is the second largest palm oil producing country in the world and it produces more than half of world’s palm oil. The requirement of vegetable oil is constantly increasing and more cultivation of palm oil is forecast in the near future (Ramli, 2003). At the same time, the production of palm oil result in by products such as empty fruit bunches (EFB), palm kernel shells (PKS) or oil palm shells (OPS), pericap and palm oil mill effluent (POME). These are waste materials and stockpiling such wastes have caused storage problem in the vicinity of the factories as large quantities of these wastes are produced every day. Also, these wastes are stockpiled in open fields and thus it had negative impact on environment. One of the ways of disposing these wastes would be utilization of some of these into constructive building materials. This will also help to prevent the depletion of natural resources and to maintain ecological balance.
PKS are hard stony endocarps that surround the kernel and the shells come in different shapes and sizes. They are light and naturally sized; they are ideal for substituting aggregates in LWC construction. Being hard and of organic origin, they will not contaminate or leach to produce toxic substances once they are bound in concrete matrix. Normally, the shells are flaky and of irregular shape that depend on the breaking pattern of the nut. PKS are available in large quantities in palm oil producing countries in Asia and Africa. Malaysia alone produces nearly 4 million tones of PKS annually and this is likely to increase as more production is expected in the near future.
2. Previous Research
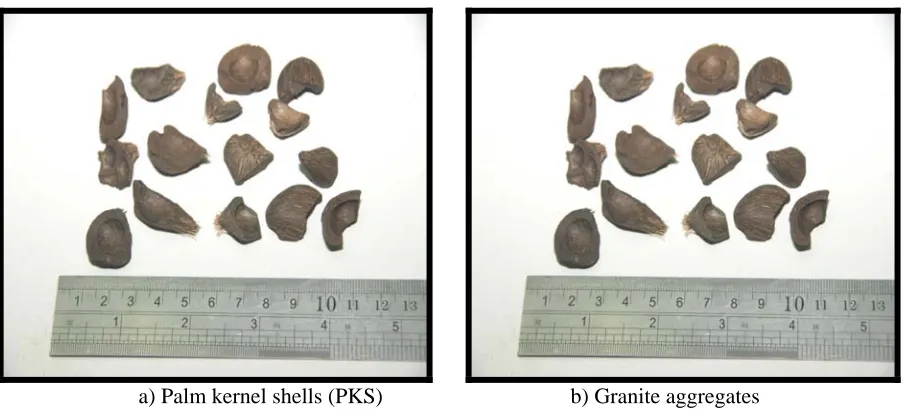
PKS possesses hard characteristics as coarse aggregates and there have been attempts by Abdullah (2003), Okafor (1988), Okpala (1990) and Basri et al., (1999) to use PKS as coarse aggregates replacing normal granite aggregates traditionally used for concrete production. Ata et.al., (2006) compared the mechanical properties of palm kernel shell concrete with that of coconut shell concrete and reported the economy of using PKS as lightweight aggregate. Generally, PKS consists of 60-90 % of the particles in the range of 5-12.7 mm (Okafor, 1988; Okpala, 1990). The specific gravity of PKS varies between 1.17 and 1.37, while the maximum thickness of the shell was found to be about 4mm.
The density of PKSC varies in the range of 1700 to 2050 kg/m that depends on factors such as type of sand, and, sand and PKS contents. Generally, when the density of concrete is lower than 2000 kg/m , it is categorized as LWC. Thus, the PKSC can be produced within this target density of 2000 kg/m and PKSC is a LWC. The 28 day cube compressive strength of about 15-25 MPa has been reported by them. Other properties of PKS and the PKSC have been studied and reported by these researchers. However, the structural behavior of PKSC is very limited.
One of the important characteristics of PKSC is the compressive strength. Generally grade 30 concrete is acceptable for structural members, though some of the codes of practice stipulate minimum strength of LWC as 15MPa (FIP Manual, 1983). The highest compressive strength produced by the researchers in the past though fulfils this minimum requirement, higher strength is desirable for the design of structural members. It has been found that the failure of PKS concrete is generally governed by the strength of PKS (Okafor, 1988). However, PKS as LWA can produce poor bond between their surfaces and cement matrix, as they possess smooth and convex surfaces.
Silica fume (SF) has been used to produce high-strength concrete and SF particles are finer than cement particles. However, the use of the powder form of SF demands more water to maintain workability and therefore powders are most often used with plasticizers or superplasticisers. The extremely fine SF particles react with the liberated calcium hydroxide to produce calcium silicate and aluminate hydrates. These both increase the strength and reduce the permeability by densifying the matrix of the concrete (Robert et al., 2003; Neville, 1996). Thus the zone between aggregate and cement paste interface, which is called the zone of weakness, could be strengthened by the use of SF. At present there is no literature available on the properties of concrete SF as mineral admixture.
This research work focuses on producing PKSC of grade 30 using ten percent of silica fume and five percent of fly ash as additional cementitious material and cement replacement material, respectively and to study the structural behavior of the PKSC.
3. Objectives
The objectives of this study can be summarized as stated below:
O1: To produce concrete of grade 30 using PKS as lightweight aggregates and cementitious materials
O2: To study the mechanical properties of the PKSC and compare it with the properties of the NWC of similar grade
O3: To study the structural behavior of the PKSC with respect to failure mode, ductility characteristic, moment capacity, crack width, and deflection
O4: To compare the structural behavior of the PKSC with that of the NWC of similar grade
4. Research Method
The methodology to produce and study the structural behavior of the PKSC is described hereunder. Since this investigation is experimental based, the following sections describe the methods to fabricate and test the reinforced PKSC and NWC beams for structural behavior.
4.1. Materials
Ordinary Portland cement (OPC) conforming to MS 522; Part-1:2003 with specific gravity and surface area of 3.10 and 335 m / kg respectively was used for all mixes. The cementitious materials used in preparation of PKS concrete were: Five percent Class F fly ash (FA) and ten percent silica fume (SF) as cement replacement and additional cementitious materials on the cement weight respectively. The SiO content and specific gravity of class F fly ash (FA) used in this investigation were 65% and 2.10 respectively. Undensified Silica fume (SF) of specific gravity of 2.10 used in the investigation was supplied by Elkem materials, Singapore. No cementitious material was used in the NWC.
Table 1: Physical and mechanical properties of aggregates
Properties Granite Aggregate PKS Aggregate
Thickness (mm) 15 0.7 – 3.00
Bulk density (kg/m ) 1510 620
Specific gravity (saturated surface dry) 2.67 1.37
Fineness modulus 6.57 6.24
Water absorption – 1 hour (%) <1 10-12 Water absorption – 24 hr (%) <1 24.5 Aggregate impact value (%) 16.78 3.91
Figure 1: Coarse aggregates
a) Palm kernel shells (PKS) b) Granite aggregates
The reinforcement consisted of two numbers of 12 mm diameter high yield strength deformed bars with a yield strength (f ) of about 505MPa. The steel ratio, (ρ = A /bd) used in this investigation was found about 0.72 %. The ultimate strength (f ) of 620 MPa was found experimentally for the 12 mm bars. Mild steel links of 6 mm diameter bars with yield strength of about 350 MPa was used. In addition, two numbers of 10 mm bars were used as holding bars in the shear zone. All these reinforcements were supplied by AMSTEEL Sdn Bhd, Klang, Malaysia for this research.
4.2. Selection of mix
Table 2: Mix proportions of PKSC and NWC
Cementitious materials (%) Mix Water to binder
ratio (w/b)
Sand to cement ratio (s/c)
Coarse aggregate to
cement ratio (a/c) Silica fume (SF) Fly ash (FA)
Superplasticizer (%)
PKSC 0.35 1.20 0.80 10 5 1.0
NWC 0.65 3.35 2.64 - - 0.5
4.3. Reinforcement gage, beam preparation and instrumentation
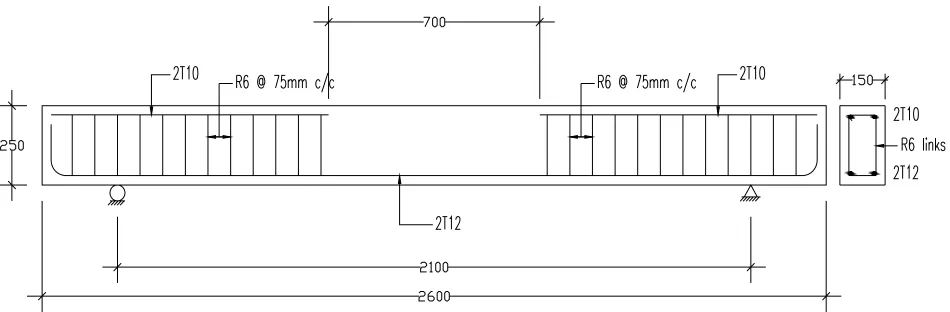
The reinforcement gage prepared for the study on both the flexural behavior is shown in Fig. 2. All beams were designed as under-reinforced in accordance with BS 8110:1997 to produce typical flexural mode of failure. The shear reinforcement for flexure was used only in the shear span at close spacing of about 75mm c/c and this has been done to ensure yielding of tension steel before crushing of concrete.
Figure 2: Reinforcement details of test beams
Note: All dimensions in mm Clear Cover: 30 mm (all beams)
No compression reinforcement was provided in the flexural zone. The strain gauges were fixed at the bottom of the main reinforcement for the strain measurements in main steel
All beams were designed as under-reinforced using BS 8110-Part 1:1997 (1997) and cast in steel moulds. The width (b) and the overall depth of the beam were kept at 150 mm and 250 mm respectively for all beams. And using a clear cover of 30 mm, the effective depth of the beams was maintained at 209 mm. A total of four beams, two each on NWC and PKSC were cast. They were vibrated using internal vibrator and covered with jute clothes for curing. Afterwards the beams were kept under laboratory condition till the day of testing.
The companion specimens for compressive and flexural strengths and modulus of elasticity were cast and tested for both NWC and PKSC beams. 100 mm cubes and 100 x 100 x 500 mm prisms were used respectively for cube compressive strengths and flexural strength. 150 mm diameter and 300 mm height cylinders were used for static modulus test.
The tensile and compressive strains of both reinforcement and concrete were measured through electrical resistance gauges. All the strains were recorded using data logger. In addition, the strain distribution on the vertical face of the beams in the flexural zone was determined using de-mountable digital extensometer with a sensitivity of 0.001 mm.
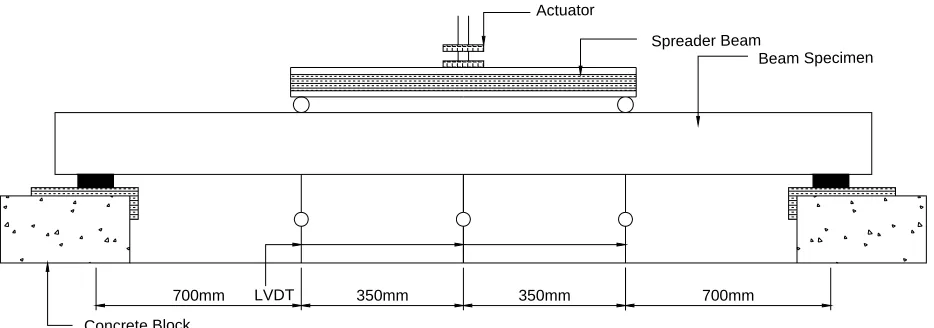
[image:5.612.63.538.249.405.2]Three linear voltage displacement transducers (LVDT) were placed, one at centre of the beam, the other two under load points, to measure the deflections at centre and under load points. The crack widths at the level of tensile reinforcement were measured using hand held microscope with sensitivity of 0.02 mm. All strain, crack width and deflection measurements were measured at every load increment. The first crack load was noted immediately after the formation and all the cracks were marked as and when they propagated in the beam.
Figure 3: Test set up and Instrumentation
Beam Specimen
Concrete Block
700mm LVDT 350mm 350mm 700mm
Spreader Beam Actuator
5. Discussion of Test Results
5.1. Comparison of mechanical properties
The mix proportions stated in Table 2 designed to yield 28 day compressive strength of about 30 MPa and the strengths obtained at 28 days were slightly higher than 30 MPa. Table 3 shows the properties of mechanical strengths for both PKSC and NWC at the age of 96 days of beam testing. It should be mentioned that the strength gain for PKSC beyond 28 day was not significant. It has been found that due to the addition of silica fume, the early strength was found higher and nearly 85 – 90% of 28 day strength was obtained at the age of 7days.
The workability of the PKSC was better than the NWC as seen from the slump values. The addition of silica fume increased the cohesiveness of the mix, and at the same time demands higher water to produce workability. Thus, the addition of superplasticizer is mandatory to compensate the strength loss that may arise if higher water is used.
The comparison of the cube strengths of the PKSC with that of NWC shows an average increase of about 14 %. However, the density of the PKSC was found about 24 % lower compared to the NWC and that is very significant as far as dead load of the structures is concerned in the design of structural elements. Thus, it can be concluded that PKSC has advantage in both strength and density. It should be mentioned that the PKSC contained SF of about ten percent as additional cementitious material, however may slightly increase the cementitious materials content. On the other hand, the five percent fly ash added as cement replacement may have slight influence in reducing the cement content.
Table 3: Details of beams (concrete strength, steel and beam size)
Beam No. Density (kg/m )
Slump (mm)
Cube strength (MPa)
Flexural strength (MPa)
Young’s modulus (kN/mm )
Beam size (b x h) (mm)
NWC-1 31.83 4.21 30.71 148 x 253
NWC-2 2335 65 33.04 4.42 31.08 149 x 254
PKSC-1 37.41 3.83 10.71 152 x 253
PKSC-2 1888 105 36.70 3.50 10.02 152 x 253
5.2. Mode of failure
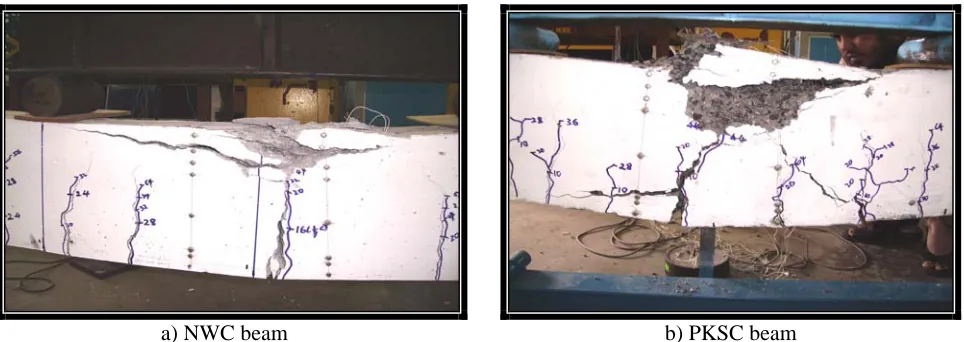
The flexural failure mode was observed for the both NWC and PKSC beams as shown in Fig. 4. The yielding of steel took place and this was followed by crushing of concrete in the compression zone. Since all the beams were designed as under-reinforced, the failure started by yielding of the tension steel bar before the compression failure of concrete as expected. As can be seen from Fig.2, in order to ensure typical flexural failure, the shear and compression reinforcements were not provided in the pure bending region. Also, the stirrup spacing was kept at 75 mm centers in the shear zone and thus all beams failed in typical flexural mode.
[image:7.612.59.541.413.584.2]For both types of concrete, failure started with flexural crack and extended to the neutral axis. The first flexural crack, after reaching the neutral axis, started to incline to form compression failure zone. And the crushing of concrete took place in that zone during failure. NWC concrete exhibited brittle failure; the prolonged deflection at maximum load of PKSC beam has given sufficient warning before final failure and thus the beam failed in ductile manner. However, the failure zone of PKSC was larger than NWC beams as seen from Fig.4.
Figure 4: Failure modes of beams
a) NWC beam b) PKSC beam
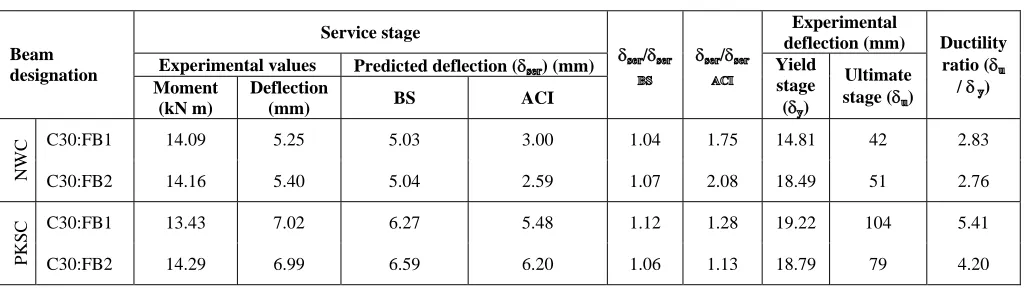
5.3. Deflection and ductility characteristics
Table 4: Ultimate load and deflection characteristics of PKSC and NWC beams
Service stage Experimental
deflection (mm) Experimental values Predicted deflection (δ ) (mm)
Beam designation
Moment (kN m)
Deflection
(mm) BS ACI
δ /δ δ /δ
Yield stage (δ)
Ultimate stage (δ)
Ductility ratio (δ
/ δ )
C30:FB1 14.09 5.25 5.03 3.00 1.04 1.75 14.81 42 2.83
NWC C30:FB2 14.16 5.40 5.04 2.59 1.07 2.08 18.49 51 2.76
C30:FB1 13.43 7.02 6.27 5.48 1.12 1.28 19.22 104 5.41
PKSC C30:FB2 14.29 6.99 6.59 6.20 1.06 1.13 18.79 79 4.20
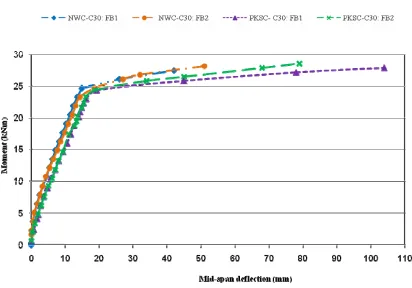
Fig.5 shows the deflections at mid-span for all the four beams tested. As expected, the PKSC beams have shown higher deflections. This may be attributed to their lower stiffness of the PKSC compared to that of the NWC. Table 3 shows that the modulus of elasticity of PKSC is less that half that of NWC. Thus, the PKSC beams had undergone large deflections. It can also be seen that at early loads both NWC and PKSC beams behave linearly. Though the modulus of elasticity of PKSC is only 33% as that of NWC, at service loads, the deflections of both NWC and PKSC beams are much closer.
The maximum deflections of the NWC beams were found to be between 40 to 50 mm. However, the PKSC beams exhibited higher deflections than the NWC beams. The large deflections at near maximum load of the PKSC beams exhibit high ductile behavior that may give ample warning before total collapse. However, the NWC beams failed in brittle manner as usual.
Figure 5: Deflection of PKSC and NWC beams
5.4. Moment capacity
Table 5 shows the moment capacity of the PKSC and NWC beams tested under two-point loading. The theoretical ultimate moments were calculated using the ultimate strength of the reinforcement (f ) without any partial safety factor materials. It can be seen from the results that the experimental moments are nearly five percent higher than the theoretical calculations. The results show that the PKSC beams have slightly higher moment capacities than the NWC beams. The service moments given in the Table 4 were calculated based on the yield strength of the steel. In addition, the partial safety factors for the materials have also been used.
Table 5: Crack load, theoretical and ultimate moments
Beam Failure mode
Ultimate load (kN)
First cracking load (kN)
First crack width (mm)
Theoretical ultimate moment
M (kNm)
Experimental ultimate moment, M (kNm)
e t
M M
NWC-FB1 Flexural 76.01 16 0.06 24.91 26.10 1.05
NWC-FB1 Flexural 78.00 16 0.06 25.08 26.81 1.07
PKSC-FB1 Flexural 77.47 10 0.06 25.62 26.72 1.04
PKSC-FB2 Flexural 81.09 8 0.02 25.54 28.99 1.09
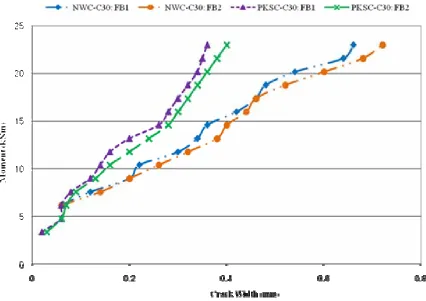
5.5. Crack load, width and distribution
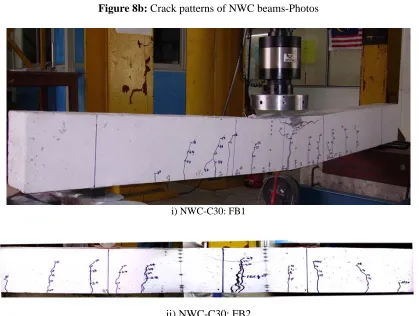
Fig. 6 shows the relationship between load applied and the crack width variation. Generally, in beams cracks occur when the stress in the tensile zone reaches the modulus of rupture of the concrete beam. Table 4 shows the summarized values of first crack load, first and the maximum crack widths. For all four beams, the first crack appeared at the centre of the beam. Figs. 7 and 8 show the crack pattern for the PKSC and the NWC beams.
closed spaced cracks or more number of cracks, leads to smaller crack width. In one of the PKSC beams, referred to here as PKSC: B1, the crack width was slightly smaller compared to other PKSC: B2. PKSC beams had more number of cracks of about 25 to 30 compared to average number of cracks of 12 for NWC. Thus, PKSC beams had lesser crack width and bore higher failure load compared to NWC beams tested.
[image:10.612.102.528.259.560.2]Under the service load condition, the crack width in the PKSC beams did not exceed the limiting value of 0.3 mm, as stipulated in the BS 8110 (1997). Whereas, the crack widths of NWC beams are close to the permissible crack width of 0.3 mm at the service loads. Thus, PKSC beams satisfactorily fulfilled the BS Code’s requirements on the crack width. Table 5 shows that the first crack load for the PKSC beams is lower than that of the NWC beam. This is because of the lower modulus of rupture of the PKSC than the NWC. The crack widths and spacing are subject to wide scatter; however for the beams tested in this experiment, the test readings show consistency.
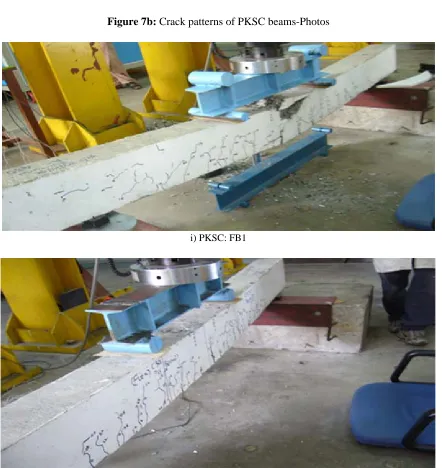
Figure 7a: Crack patterns of PKSC-C30: FB1 & 2- Line sketches
Figure 7b: Crack patterns of PKSC beams-Photos
i) PKSC: FB1
[image:11.612.80.522.262.730.2]Figure 8a: Crack patterns of NWC-C30: FB 1 & 2 beams- Line sketches 64 20 52 56 60 16 32 60 68 60 16
4468 52
36 24 20 44 32 24 20 24 2840 48 60 64 44 40 28 32 40 56 60 28 56 48 36 28 64 56 44 40 44 32 20 16 56 36 24 20 60 44 32 24 48 44 40 36 60 28 3244 64 20 24 32 56 32 28 24 56 44 36 32 24 56 NWC-C30 FB1 NWC-C30 FB2
Figure 8b: Crack patterns of NWC beams-Photos
i) NWC-C30: FB1
ii) NWC-C30: FB2
[image:12.612.105.524.254.570.2]5.6. Strain characteristics
The tensile and compressive strains of reinforcement and concrete respectively were measured at every load increment. The strain measurements against the loads for both NWC and PKSC beams are shown in Fig. 9. The negative values show the compressive strains in the concrete, while the tensile strains in the reinforcement are shown in positive values. The highest tensile and compressive strain in PKSC beams reached 10,000 x 10 m/m and 7000 x 10 m/m in PKSC before failure. The maximum strains in the NWC beams recorded were 3900 x 10 m/m and 3700 x 10 m/m in steel and concrete, respectively.
The higher strains in PKSC beams may be attributed to higher deflection due to low modulus of elasticity of the PKSC. The strains were linear in both NWC and PKSC beams until yielding of steel and then rapidly increased before failure. The higher strains in PKSC concrete beams also show that good bond between steel and concrete existed till the yielding of steel. The strains, before final failure may have been higher than the strains mentioned here.
[image:13.612.75.522.326.577.2]The compressive strains in concrete at service moments varied between 800 x 10 to 1200 x 10 m/m in NWC beams; however the PKSC beams recorded slightly higher strains between 1200 x 10 to 1600 x 10 m/m.
Figure 9: Compressive and tensile strains of concrete and steel
5.7. Comparison of the test results with previous research
by them. One possible explanation for these improvements could be the stronger bond between the concrete and the PKS.
The experimental moment capacity found in this investigation also shows an increase of nearly 26% compared to the value reported by them. In addition, the higher value of elastic modulus also decreased the deflection of PKSC-C30 beams. The experimental crack width at failure reported here was only 45 % of their value. Thus, the PKSC beams showed an overall improvement in the flexural behaviour compared to the test results of the OPS-S2 beam by them. The ductility ratio of the beam, PKSC-C30: FB1 has also shown nearly 30% higher values compared to that of OPS-S2. The reinforcement strains of both the PKSC beams have shown higher strains than OPS-S2 beam.
6. Summary and Concluding Remarks
The experimental results of four beams, two each in PKSC and the NWC are presented in this paper. The comparison of mechanical properties and structural behavior of the NWC and PKSC beams is discussed. The crack width, deflection, ultimate strength, concrete and steel strains are analyzed and compared for both beams. Based on the results, the following conclusions may be drawn:
1. The PKSC produced a density reduction and an increase in compressive strength of about 24% and 14%, respectively compared to that of the NWC.
2. The compressive strengths obtained for the PKSC were approximately 36 MPa and this was higher than the target strength of 30 MPa and hence PKSC can be produced as structural grade concrete of grade 30 with the addition of ten percent of silica fume.
3. The modulus of elasticity of the PKSC was found to be about 33 % as that of the NWC. Similarly, the PKSC produced flexural strength of about 15% lower than the NWC.
4. The overall flexural behavior of reinforced PKSC beams used in this study closely resembles that of equivalent beam made with NWC.
5. Lower modulus of rupture of PKSC resulted in early cracks in PKSC beam. However, the close spacing and large number of cracks in PKSC beams resulted in lesser crack widths than the NWC beams. The crack widths of the PKSC at service loads are within the durability requirements of BS 8110.
6. The deflection of the PKSC beams at service loads were close to the deflection of the NWC beams. However, the large deflections at near maximum load of the PKSC beams exhibited high ductile behavior that gave ample warning before total collapse.
7. The ultimate moment of the PKSC beams were closer to that of the NWC beams and in the case of the PKSC-B2, the ultimate moment was higher than that of the NWC beams.
8. The PKSC beams had sufficient ductility and the failure zone was distinctly larger than the NWC beams.
9. Higher tensile steel strains of the PKSC beams show the existence of the stronger bond between the concrete and the steel
10. The overall flexural behavior of the PKSC beams shows better performance than the OPS beams reported earlier.
Acknowledgment
References
[1] ASTM, 2003. ASTM C 127. “Standard Test Method for Density, Relative Density and Absorption of Coarse Aggregate”, Annual Book of ASTM Standards.
[2] ASTM, 2003. ASTM C 138. “Standard Test Method for Density, Yield and Air Content”, Annual Book of ASTM Standards.
[3] Ata,O, E.A Olanipekun, K.O.Oluola, 2006. “A comparative study of concrete properties using coconut shell and palm kernel shell as coarse aggregates”, Building and Environment 41, pp.297-301.
[4] Basri, H.B, M.A.Mannan, and M.F.M.Zain, 1999. “Concrete using waste oil palm shells as aggregates”, Cement and Concrete Research 29, pp. 619-622.
[5] BS 8110-1:1997, “Structural use of concrete. Code of practice for design and construction”, British Standards Institution, London.
[6] FIP Manual, 1983. “FIP Manual of Lightweight Aggregate Concrete, 2 ed. London: Surrey University Press.
[7] Neville, A.M. 1996. “Properties of concrete”. Longman Group Limited, London.
[8] Okafor, F.O. 1988. “Palm kernel shell as a lightweight aggregate for concrete” Cement and Concrete Research 18, pp. 901-910.
[9] Okpala, D.C, 1990. “Palm kernel shell as a lightweight aggregate in concrete”, Building and Environment 25, pp.291-296.
[10] Ramli, A, 2003. “Short-term and long-term projection of Malaysian palm oil production”, Oil Palm Industry Economic Journal 3, pp.32-36.
[11] Robert, L, S. Lindon, W. Peter, R. Ray. 2003. “Cementitious additions. In: John N, Ban SC, editors. Advanced Concrete Technology”. Amsterdam: Elsevier publications pp.43-45.
[12] Satish, C, and Berntsson L.2003. “Lightweight Aggregate Concrete, Science, Technology, and Applications”. 1st edn. New York: Noyes Publications.
[13] Short, A, and W. Kinniburgh, 1978. “Lightweight Concrete”, 3 edn. London: Applied Science.