I
Building Information Modelling (BIM)
maturity-benefits assessment relationship
framework for UK construction clients
Ammar Jasim Dakhil
School of The Built Environment,
University of Salford,
UK
II
Contents
List of Figures ... X List of Tables ... XIII ACKNOWLEDGEMENTS ... XIX DEDICATION ... XX DECLARATION ... XXI ABSTRACT ... XXII
Chapter 1: Introduction ... 1
1.1 Introduction ... 2
1.2 Problem statement and research justification ... 4
1.3 Aims and Objectives ... 6
1.4 Scope of the Research ... 6
1.5 The Research Processes ... 7
1.6 Structure of the thesis ... 9
Chapter 2: Building Information Modelling for Construction Client Organisations ... 11
2.1 Introduction ... 12
2.2 UK Construction Industry ... 12
2.3 Construction Clients ... 16
2.3.1 Client Types ... 17
2.3.1.1 Public sector client ... 18
2.3.1.2 Private sector client ... 19
2.3.1.3 Mix sector client ... 20
2.3.1.4 Similarities and differences ... 20
2.3.2 Construction Clients’ roles... 22
2.4 The role of information management in construction ... 26
2.5 BUILDING INFORMATION MODELLING ... 28
2.5.1 BIM Definitions ... 28
2.5.2 Building Information Modelling (BIM) in UK construction Industry... 30
2.6 BIM for client organisation ... 36
2.6.1 Client organisation information requirements ... 38
2.6.2 BIM Benefits for client ... 40
2.6.3 Client roles regarding the BIM implementation process ... 48
2.6.4 BIM uses requirement ... 50
III
Chapter 3: BIM Client Maturity ... 54
3.1 Introduction ... 55
3.2 Organisational competencies ... 55
3.3 Maturity definition ... 59
3.4 BIM maturity ... 63
3.5 BIM client maturity models ... 64
3.5.1 Succar’s BIM Maturity Matrix (BMMI) ... 66
3.5.2 CIC Research Program’s Owner Matrix ... 67
3.5.3 Owner’s BIMCAT ... 68
3.5.4 TNO’s BIM QuickScan ... 69
3.5.5 Indiana University’s BIM Proficiency Matrix ... 70
3.6 Existing BIM maturity model evaluations ... 70
3.7 Clients’ BIM competencies selection ... 77
3.8 Summary ... 81
Chapter 4: Research Methodology ... 82
4.1 Introduction ... 83
4.2 Research methodology ... 83
4.3 Research Philosophy ... 85
4.3.1 Ontology ... 86
4.3.2 Epistemology ... 87
4.3.3 Axiology ... 87
4.4 Research Approach ... 89
4.4.1 Deductive Approach ... 89
4.4.2 Inductive Approach ... 90
4.4.3 Abduction Approach ... 92
4.5 Research Choice ... 92
4.5.1 Quantitative Study ... 93
4.5.2 Qualitative Study ... 93
4.5.3 Triangulation approach ... 94
4.6 Research strategy ... 100
4.6.1 Experiment ... 102
4.6.2 Survey ... 102
4.6.3 Action Research ... 103
IV
4.6.5 Ethnographic Research ... 105
4.6.6 Archival Research... 105
4.6.7 Case Study ... 105
4.6.7.1 Case Study Selection Criteria ... 107
4.7 Time Horizon ... 109
4.8 Research Technique ... 110
4.8.1 Literature Review ... 110
4.8.2 Interview ... 111
4.8.3 Secondary data (Document) ... 112
4.8.4 Questionnaires ... 112
4.8.5 Objectives of the study and how they are addressed ... 114
4.8.6 Data sampling ... 115
4.8.6.1 Probability Sampling ... 116
4.8.6.2 Non-probability sampling ... 117
4.9 Data analysis ... 118
4.9.1 Qualitative data analysis ... 118
4.9.2 Quantitative data analysis ... 120
4.10 Validity and Reliability ... 122
4.11 Research methodological process ... 124
4.12 Summary ... 127
Chapter 5: Maturity-benefits relationship assessment framework ... 128
5.1 Introduction ... 129
5.2 Importance of developing a framework ... 129
5.3 Initial l framework development steps ... 131
5.3.1 BIM uses benefits and requirements (Step 1) ... 132
5.3.2 BIM maturity competencies (Step 2) ... 133
5.3.3 The relationship between BIM maturity and BIM uses benefits (Step 3) ... 135
5.3.3.1 Connecting BIM maturity competencies with BIM uses benefits. ... 135
5.3.3.2 Effects of BIM maturity development on BIM uses benefits achievement ... 136
5.4 Pilot study (Experts’ opinions) ... 140
5.4.1 Organisation P background ... 140
5.4.2 Initial conceptual framework feedback ... 141
5.4.2.1 Proposed maturity model ... 141
5.4.2.2 The benefit assurance levels ... 143
V
5.6 Summary ... 146
Chapter 6: Qualitative Data Analysis ... 147
6.1 Introduction ... 148
6.2 Data collection procedure ... 148
6.3 Data analysis procedure ... 150
6.4 Case study findings for client organisation A ... 153
6.4.1 Client organisation A: Background ... 153
6.4.2 Data analysis and findings ... 154
6.4.2.1 The main motivation of using BIM ... 154
6.4.2.2 Critical success competencies for BIM implementation ... 155
6.4.2.3 BIM maturity ... 158
6.4.2.4 BIM benefits ... 162
6.4.2.5 Document analysis ... 164
6.5 Case study findings for client organisation B ... 167
6.5.1 Client organisation B background ... 167
6.5.2 Data analysis and findings ... 168
6.5.2.1 The main motivation of using BIM ... 168
6.5.2.2 Critical success competencies for BIM implementation ... 169
6.5.2.3 BIM maturity ... 172
6.5.2.4 BIM benefits ... 176
6.5.2.5 Document analysis ... 179
6.6 Case study findings for client organisation C ... 180
6.6.1 Client organisation C background ... 180
6.6.2 Data analysis and findings ... 181
6.6.2.1 The main motivation of using BIM ... 181
6.6.2.2 Critical success competencies for BIM implementation ... 182
6.6.2.3 BIM maturity ... 185
6.6.2.4 BIM benefits ... 188
6.6.2.5 Document analysis ... 191
6.7 Case study findings for client organisation D ... 192
6.7.1 Client organisation D background ... 192
6.7.2 Data analysis and findings ... 193
6.7.2.1 The main motivation of using BIM ... 193
6.7.2.2 Critical success competencies for BIM implementation ... 194
6.7.2.3 BIM maturity ... 197
VI
6.7.2.5 Documents analysis ... 203
6.8 Case study findings for client organisation E ... 204
6.8.1 Client organisation E background ... 204
6.8.2 Data analysis and findings ... 205
6.8.2.1 The main motivation of using BIM ... 205
6.8.2.2 Critical success competencies for BIM implementation ... 206
6.8.2.3 BIM maturity ... 209
6.8.2.4 BIM benefits ... 212
6.8.2.5 Documents analysis ... 215
6.9 Case study findings for client organisation F ... 216
6.9.1 Client organisation F background ... 216
6.9.2 Interview answers and discussion ... 216
6.9.2.1 The main motivation of using BIM ... 217
6.9.2.2 Critical success competencies for BIM implementation ... 217
6.9.2.3 BIM maturity ... 220
6.9.2.4 BIM benefits ... 223
6.9.2.5 Documents analysis ... 226
6.10 Cross-sectional analysis ... 227
6.10.1 Motivation factors ... 228
6.10.2 Critical success BIM competencies ... 231
6.10.2.1 Employer Information Requirements (EIR) ... 231
6.10.2.2 Validation BIM model outcomes ... 233
6.10.2.3 Client leadership ... 236
6.10.2.4 Critical success competencies summary ... 238
6.10.3 BIM maturity ... 241
6.10.4 BIM benefits ... 241
6.11 Summary ... 242
Chapter 7: Quantitative Data Analysis ... 243
7.1 Introduction ... 244
7.2 Data Collection Procedures ... 244
7.3 Data analysis procedure ... 245
7.4 Descriptive analysis ... 248
7.4.1 Participants BIM experience ... 250
7.4.2 Participants BIM position ... 251
7.4.3 Participants client Type ... 252
VII
7.4.5 Maturity Competencies ... 253
7.4.6 BIM uses frequency ... 258
7.4.7 Descriptive analysis summary ... 259
7.5 Descriptive and Inferential analysis for BIM uses ... 260
7.5.1 Existing Condition Modelling ... 260
7.5.1.1 Descriptive analysis ... 260
7.5.1.2 Inferential analysis ... 262
7.5.1.3 Summary ... 269
7.5.2 Cost Estimate ... 270
7.5.2.1 Descriptive analysis ... 270
7.5.2.2 Inferential analysis ... 271
7.5.2.3 Summary ... 276
7.5.3 Phase Planning ... 277
7.5.3.1 Descriptive analysis ... 277
7.5.3.2 Inferential analysis ... 279
7.5.3.3 Summary ... 285
7.5.4 Design Authority ... 286
7.5.4.1 Descriptive analysis ... 286
7.5.4.2 Inferential analysis ... 287
7.5.4.3 Summary ... 291
7.5.5 Design Review ... 292
7.5.5.1 Descriptive analysis ... 292
7.5.5.2 Inferential analysis ... 293
7.5.5.3 Summary ... 298
7.5.6 Engineering Analysis ... 299
7.5.6.1 Descriptive analysis ... 299
7.5.6.2 Inferential analysis ... 300
7.5.6.3 Summary ... 304
7.5.7 Energy Analysis ... 305
7.5.7.1 Descriptive analysis ... 305
7.5.7.2 Inferential analysis ... 306
7.5.7.3 Summary ... 310
7.5.8 Lighting Analysis ... 311
7.5.8.1 Descriptive analysis ... 311
7.5.8.2 Inferential analysis ... 312
VIII
7.5.9 Sustainability Evaluation ... 316
7.5.9.1 Descriptive analysis ... 316
7.5.9.2 Inferential analysis ... 318
7.5.9.3 Summary ... 323
7.5.10 Code Validation ... 324
7.5.10.1 Descriptive analysis ... 324
7.5.10.2 Inferential analysis ... 325
7.5.10.3 Summary ... 329
7.5.11 Clash Detection ... 329
7.5.11.1 Descriptive analysis ... 330
7.5.11.2 Inferential analysis ... 331
7.5.11.3 Summary ... 337
7.5.12 Construction System Design ... 337
7.5.12.1 Descriptive analysis ... 337
7.5.12.2 Inferential analysis ... 339
7.5.12.3 Summary ... 343
7.5.13 Site Planning ... 344
7.5.13.1 Descriptive analysis ... 344
7.5.13.2 Inferential analysis ... 345
7.5.13.3 Summary ... 349
7.5.14 Digital Fabrication ... 350
7.5.14.1 Descriptive analysis ... 350
7.5.14.2 Inferential analysis ... 351
7.5.14.3 Summary ... 355
7.5.15 3D Control and Planning ... 355
7.5.15.1 Descriptive analysis ... 355
7.5.15.2 Inferential analysis ... 356
7.5.15.3 Summary ... 360
7.5.16 Record Model ... 361
7.5.16.1 Descriptive analysis ... 361
7.5.16.2 Inferential analysis ... 362
7.5.16.3 Summary ... 367
7.5.17 Asset Maintenance Scheduling ... 367
7.5.17.1 Descriptive analysis ... 367
7.5.17.2 Inferential analysis ... 368
IX
7.5.18 Asset System Analysis ... 373
7.5.18.1 Descriptive analysis ... 373
7.5.18.2 Inferential analysis ... 374
7.5.18.3 Summary ... 378
7.5.19 Asset Management ... 379
7.5.19.1 Descriptive analysis ... 379
7.5.19.2 Inferential analysis ... 380
7.5.19.3 Summary ... 384
7.5.20 Space Tracking ... 385
7.5.20.1 Descriptive analysis ... 385
7.5.20.2 Inferential analysis ... 386
7.5.20.3 Summary ... 389
7.5.21 Disaster Management ... 389
7.5.21.1 Descriptive analysis ... 389
7.5.21.2 Inferential analysis ... 390
7.5.21.3 Summary ... 394
7.6 Summary of the findings ... 394
7.7 Final conceptual assessment framework ... 397
7.7.1 Validation step 1 (qualitative data analysis and results) ... 398
7.7.2 Validation step 2 (quantitative data analysis and results) ... 398
7.7.3 Final version of the conceptual assessment framework ... 399
7.7.4 Testing final framework applicability ... 402
7.7.5 Framework practical implementation ... 410
7.8 Summary ... 412
Chapter 8: Conclusions, Research Contributions & Future Research ... 413
8.1 Introduction ... 414
8.2 Synthesis on the objectives of the study ... 414
8.3 Contribution to knowledge ... 420
8.3.1 Academic contribution ... 420
8.3.2 Practice contribution ... 421
8.4 Limitations of the study ... 421
8.5 Future research ... 422
References ... 424
Appendix A ... 445
X
Appendix C ... 460
Appendix D ... 463
Appendix E ... 469
List of Figures
Figure 1.1: Schematic representation of research process ... 8Figure 2.1: Output per hour and output per worker (Tucker, 2016) ... 14
Figure 2.2: Client main types in UK construction industry (Boyd & Chinyio, 2008) ... 17
Figure 2.3: The client's opportunity to increase project’s value (Kurokawa et al., 2016) ... 23
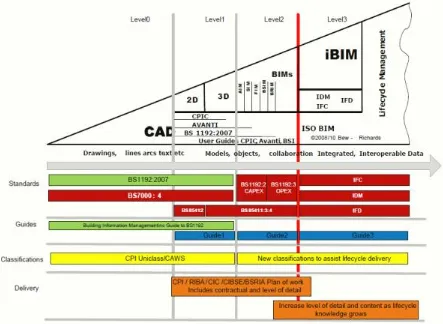
Figure 2.4: BIM maturity levels in the UK (BIMTalk, 2010). ... 32
Figure 2.5: Barriers to BIM adoption (NBS, 2014) ... 37
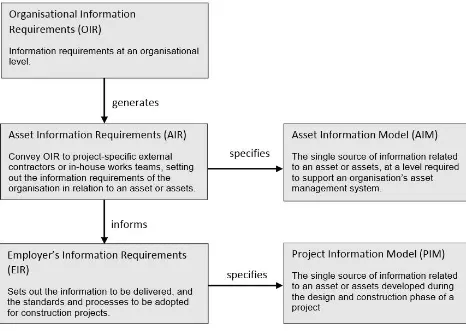
Figure 2.6: The relationship between OIR, AIR, and EIR ... 38
Figure 2.7: Information delivery plan (Task Group, 2013) ... 39
Figure 2.8: BIM Application ranking according to their benefits (Penn State, 2012) ... 46
Figure 2.9: location BIM uses in project life cycle (RIBA, 2013) ... 47
Figure 2.10: Clients’ roles in BIM implementation process ... 50
Figure 3.1: Competencies lifecycle phases (Fejfarová & Urbancová, 2015; Khoshgoftar & Osman, 2009)... 58
Figure 3.2: Typical five level maturity model (Chrissis et al., 2003) ... 61
Figure 3.3: Existing BIM maturity assessment methods ... 64
Figure 3.4: BIM maturity matrix components (Succar, 2015a) ... 67
Figure 3.5: BIM Planning Guide for Facility Owners (Penn State, 2012) ... 68
Figure 3.6: BIMCAT maturity model components (Brittany Giel & Issa, 2013b) ... 69
Figure 3.7: TNO’s BIM Quick-scan Evaluation process categories (Van Berlo, Dijkmans, Hendriks, Spekkink, & Pel, 2012) ... 69
Figure 3.8: Indiana University’s BIM Proficiency Matrix (Kang, Won, & Lee, 2013) ... 70
Figure 3.9: Proposed BIM maturity competencies fields ... 81
Figure 4.1: Nested research methodology approach (Kagioglou, 1998) ... 84
Figure 4.2: Onion research methodology approach (Saunders, 2011) ... 85
Figure 4.3: The dimension of the research philosophy (Sexton, 2003) ... 86
Figure 4.4: Typical phases for the research process (Kassim, Underwood, & Raphael, 2010) 88 Figure 4.5: Deductive Reasoning Steps (Trochim & Donnelly, 2001) ... 90
XI
Figure 4.7: Research choice (Saunders, 2011)... 95
Figure 4.8: Dimension of Research Philosophy (Sexton, 2007) ... 101
Figure 4.9: Types of case studies based on the number and units (U. Kulatunga, 2008a) .... 108
Figure 4.10: The significance of the Spearman’s rank correlation ... 122
coefficient and degree of freedom... 122
Figure 4.11 Research methodological process ... 126
Figure 5.1 Development of the framework (U. Kulatunga, 2008b) ... 131
Figure 5.2: The draft initial BIM maturity-benefits framework development steps... 132
Figure 5.3: The initial framework for the research ... 140
Figure 5.4: BIM maturity-benefits relationship assessment framework ... 146
Figure 6.1: Themes structure from NVIVO program ... 150
Figure 6.2: Qualitative analysis procedure ... 151
Figure 6.3: BIM implementation main elements for the client organisation ... 153
Figure 6.4: Cognitive map for motivation factors ... 229
Figure 6.5: Word frequency analysis of motivation factors ... 229
Figure 6.6: Word frequency analysis of EIR competencies requirements ... 231
Figure 6.7: Word frequency analysis of validation process competencies requirements ... 234
Figure 6.8: Word frequency analysis of leadership competencies requirements ... 236
Figure 6.9: Critical success competencies for client main roles ... 240
Figure 7.1: Quantitative analysis procedure ... 245
Figure 7.2: Participants’ BIM experience... 250
Figure 7.3: Participants’ current position ... 251
Figure 7.4: Participants’ organisation type ... 252
Figure 7.5: BIM uses frequencies ... 253
Figure 7.6: BIM uses frequencies ... 259
Figure 7.7: Benefit assurance evaluation for Existing Condition Modelling ... 261
Figure 7.8: Visual representation of the related BIM maturity competencies ... 266
Figure 7.9: Benefit assurance evaluation for Cost Estimate ... 271
Figure 7.10: Benefit assurance evaluation for Phase Planning ... 278
Figure 7.11: Benefit assurance evaluation for Design Authority ... 287
Figure 7.12: Benefit assurance evaluation for Design Review ... 293
Figure 7.13: Benefit assurance evaluation for Engineering Analysis ... 300
XII
Figure 7.15: Benefit assurance evaluation for Lighting Analysis ... 312
Figure 7.16: Benefit assurance evaluation for Sustainability Evaluation ... 318
Figure 7.17: Benefit assurance evaluation for Code Validation ... 325
Figure 7.18: Benefit assurance evaluation for Clash Detection ... 331
Figure 7.19: Benefit assurance evaluation for Construction System Design ... 338
Figure 7.20: Benefit assurance evaluation for Site Planning ... 345
Figure 7.21: Benefit assurance evaluation for Digital Fabrication ... 351
Figure 7.22: Benefit assurance evaluation for 3D Control and Planning ... 356
Figure 7.23: Benefit assurance evaluation for Record Model ... 362
Figure 7.24: Benefit assurance evaluation for Asset Maintenance Scheduling ... 368
Figure 7.25: Benefit assurance evaluation for Asset System Analysis ... 374
Figure 7.26: Benefit assurance evaluation for Asset Management ... 380
Figure 7.27: Benefit assurance evaluation for Space Tracking... 386
Figure 7.28: Benefit assurance evaluation for Disaster Management ... 390
Figure 7.29: The final conceptual assessment framework ... 401
XIII
List of Tables
Table 2.1: Private clients’ categories ... 19
Table 2.2: Mixed clients’ categories ... 20
Table 2.3: BIM benefits for client organisations ... 45
Table 2.4: BIM uses and client ... 52
Table 3.1: Competency definitions from different sources ... 56
Table 3.2: Maturity level explanation (Succar, 2010a) ... 62
Table 3.3: The summary of BIM maturity evaluation model ... 65
Table 3.4: Comparison between existing BIM organisation maturity model ... 73
Table 3.5: The strengths and weakness of the selected BIM maturity models ... 76
Table 4.1: The contrasts between deductive and inductive approaches (Saunders, 2011) .... 91
Table 4.2: Differences between qualitative and quantitative research (Bryman, 2015) ... 94
Table 4.3: The main differences between multi and mixed method ... 96
Table 4.4: Mixed method types comparison ... 97
Table 4.5: Qualitative and quantitative strategies used in directing this research ... 99
Table 4.6: Justification of selecting research method (Yin, 2009) ... 102
Table 4.7: The advantages and disadvantages of a survey (Creswell, 2013; Saunders et al., 2011) ... 103
Table 4.8: the objectives of this study and the mode of investigation ... 114
Table 5.1: The essential client BIM competencies defined from the literature ... 133
Table 5.2: The relationship for the Existing Condition Modelling BIM use ... 135
Table 5.3: Benefit classification summary (Bradley, 2010) ... 136
Table 5.4: Pilot study interviewees for organisation P ... 140
Table 5.5: A comparison between the initial and final maturity levels’ titles ... 141
Table 6.1: The final interview questions with explaining each question aim ... 148
Table 6.2: Interviewees for organisation A ... 153
Table 6.3: Critical success competencies for organisation A ... 156
Table 6.4: Organisation A maturity assessment result ... 160
Table 6.5 Benefits assessment results for organisation A ... 163
Table 6.6: BIM uses in organisation A ... 164
Table 6.7: The early stage BIM requirements sections details ... 165
XIV
Table 6.9 Critical success competencies for organisation B ... 170
Table 6.10: Organisation B maturity assessment result ...174
Table 6.11: Benefits assessment results for organisation B ... 177
Table 6.12: BIM uses in organisation B ... 178
Table 6.13 List of the interviewees for organisation C ... 180
Table 6.14: Critical success competencies for organisation C ... 183
Table 6.15: Organisation C maturity assessment result ... 186
Table 6.16: Benefits assessment results for organisation C ... 189
Table 6.17: BIM uses in organisation C ... 190
Table 6.18: List of the interviewees for organisation D ... 192
Table 6.19: Critical success competencies for organisation D ... 195
Table 6.20: Organisation D maturity assessment result. ... 198
Table 6.21: Benefits assessment results for organisation D ... 201
Table 6.22: BIM uses in organisation D ... 203
Table 6.23: List of the interviewees for organisation E ... 204
Table 6.24: Critical success competencies for organisation E ... 207
Table 6.25: Organisation E maturity assessment result ... 211
Table 6.26: Benefits assessment results for organisation E ... 213
Table 6.27: BIM uses in organisation E ... 215
Table 6.28: List of the interviewees for organisation F ... 216
Table 6.29: Critical success competencies for organisation F ... 219
Table 6.30: Organisation F maturity assessment result. ... 222
Table 6.31: Benefits assessment results for organisation F ... 225
Table 6.32: BIM uses in organisation F ... 226
Table 6.33: Motivation factor for different types of the client organisation ... 230
Table 6.34: Required competencies to develop EIR for different types of client ... 232
Table 6.35: Required competencies to BIM model outcomes ... 234
Table 6.36: Required competencies to enable the client to lead BIM implementation ... 236
Table 6.37: Critical success competencies for UK construction client ... 238
Table 7.1: Cronbach’s alpha for each question and the entire questionnaire ... 248
XV Table 7.3: BIM maturity assessment results for people competencies with descriptive
analysis... 254
Table 7.4: BIM maturity assessment results for process competencies with descriptive analysis ... 255
Table 7.5: BIM maturity assessment results for technology competencies with descriptive analysis ... 256
Table 7.6: Descriptive analysis of Existing Condition Modelling benefits ... 260
Table 7.7: Spearman correlation results for Existing Condition Modelling ... 262
Table 7.8: Spearman correlation summary of Existing Condition Modelling benefits ... 266
Table 7.9: Related maturity competencies of Existing Condition Modelling ... 267
Table 7.10: Descriptive analysis of Cost Estimate benefits ... 270
Table 7.11: Spearman correlation results for Cost Estimate... 272
Table 7.12: Spearman correlation summary of Cost Estimate ... 274
Table 7.13: Related maturity competencies of the Cost Estimate ... 275
Table 7.14: Descriptive analysis of Phase Planning benefits ... 278
Table 7.15: Spearman correlation results for Phase Planning ... 280
Table 7.16: Spearman correlation summary of Phase Planning ... 282
Table 7.17: Related maturity competencies of Phase Planning ... 283
Table 7.18: Descriptive analysis of Design Authority benefits ... 286
Table 7.19: Spearman correlation results for Design Authority... 287
Table 7.20: Spearman correlation summary of Design Authority ... 289
Table 7.21: Related maturity competencies of the Design Authority ... 290
Table 7.22: Descriptive analysis of Design Review benefits ... 292
Table 7.23: Spearman correlation results for Design Review ... 293
Table 7.24: Spearman correlation summary of Design Review ... 295
Table 7.25: Related maturity competencies of the Design Review ... 297
Table 7.26: Descriptive analysis of Engineering Analysis benefits ... 299
Table 7.27: Spearman correlation results for Engineering Analysis... 300
Table 7.28: Spearman correlation summary of Engineering Analysis ... 302
Table 7.29: Related maturity competencies of the Engineering Analysis ... 303
Table 7.30: Descriptive analysis of Energy Analysis benefits ... 305
Table 7.31: Spearman correlation results for Engineering Analysis... 306
XVI
Table 7.33: Related maturity competencies of the Energy Analysis ... 309
Table 7.34: Descriptive analysis of Lighting Analysis benefits ... 311
Table 7.35: Spearman correlation results for Lighting Analysis ... 312
Table 7.36: Spearman correlation summary of Lighting Analysis ... 314
Table 7.37: Related maturity competencies of the Lighting Analysis ... 315
Table 7.38: Descriptive analysis of Sustainability Evaluation benefits ... 317
Table 7.39: Spearman correlation results for Sustainability Evaluation ... 318
Table 7.40: Spearman correlation summary of Sustainability Evaluation ... 320
Table 7.41: Related maturity competencies of the Sustainability Evaluation ... 321
Table 7.42: Descriptive analysis of Code Validation benefits... 324
Table 7.43: Spearman correlation results for Code Validation ... 324
Table 7.44: Spearman correlation summary of Code Validation ... 326
Table 7.45: Related maturity competencies of the Code Validation ... 327
Table 7.46: Descriptive analysis of Clash Detection benefits ... 329
Table 7.47: Spearman correlation results for Clash Detection ... 331
Table 7.48: Spearman correlation summary of Clash Detection ... 333
Table 7.49: Related maturity competencies of the Clash Detection ... 335
Table 7.50: Descriptive analysis of Construction System Design benefits ... 337
Table 7.51: Spearman correlation results for Construction System Design ... 338
Table 7.52: Spearman correlation summary of Construction System Design ... 340
Table 7.53: Related maturity competencies of the Construction System Design... 341
Table 7.54: Descriptive analysis of Site Planning benefits ... 344
Table 7.55: Spearman correlation results for Site Planning ... 345
Table 7.56: Spearman correlation summary of Site Planning ... 347
Table 7.57: Related maturity competencies of the Site Planning ... 348
Table 7.58: Descriptive analysis of Digital Fabrication benefits ... 350
Table 7.59: Spearman correlation results for Digital Fabrication ... 351
Table 7.60: Spearman correlation summary of Digital Fabrication ... 353
Table 7.61: Related maturity competencies benefits of the Digital Fabrication ... 354
Table 7.62: Descriptive analysis of 3D Control and Planning benefits ... 355
Table 7.63: Spearman correlation results for 3D Control and Planning ... 356
Table 7.64: Spearman correlation summary of 3D Control and Planning ... 358
XVII
Table 7.66: Descriptive analysis of Record Model benefits ... 361
Table 7.67: Spearman correlation results for Record Model ... 362
Table 7.68: Spearman correlation summary of Record Model ... 365
Table 7.69: Related maturity competencies of the Record Model ... 366
Table 7.70: Descriptive analysis of Asset Maintenance Scheduling benefits... 368
Table 7.71: Spearman correlation results for Asset Maintenance Scheduling ... 369
Table 7.72: Spearman correlation summary of Asset Maintenance Scheduling ... 371
Table 7.73: Related maturity competencies of the Asset Maintenance Scheduling ... 372
Table 7.74: Descriptive analysis of Asset System Analysis benefits ... 374
Table 7.75: Spearman correlation results for Asset System Analysis ... 375
Table 7.76: Spearman correlation summary of Asset System Analysis ... 377
Table 7.77: Related maturity competencies of the Asset System Analysis ... 378
Table 7.78: Descriptive analysis of Asset Management benefits ... 380
Table 7.79: Spearman correlation results for Asset Management ... 381
Table 7.80: Spearman correlation summary of Asset Management ... 383
Table 7.81: Related maturity competencies of the Asset Management ... 384
Table 7.82: Descriptive analysis of Space Tracking benefits ... 386
Table 7.83: Spearman correlation results for Space Tracking ... 387
Table 7.84: Descriptive analysis of Disaster Management benefits ... 390
Table 7.85: Spearman correlation results for Disaster Management ... 391
Table 7.86: Spearman correlation summary of Disaster Management ... 393
Table 7.87: Related maturity competencies of the Disaster Management ... 393
Table 7.88: The frequencies of significant correlated BIM maturity competencies with BIM uses ... 396
Table 7.89: The relationship between BIM maturity competencies and BIM uses benefits for case study one .……….406
Table 7.90: The relationship between BIM maturity competencies and BIM uses benefits for case study two ……….407
Table 7.91: The relationship between BIM maturity competencies and BIM uses benefits for case study three .……….409
XIX
ACKNOWLEDGEMENTS
I would like to thank the following people and organisations for supporting me in numerous ways throughout my PhD. First and foremost, I am indebted to my supervisor Professor Jason Underwood for his continuous support and guidance throughout the PhD process. Jason, I am so lucky to have you as my supervisor and I would have never completed my PhD without your knowledge, advice and most importantly your encouragement! I would also like to extend my gratitude to my previous supervisor Professor Mustafa Al Shawi for his guidance during the PhD. Mustafa, I am really appreciated your help and support throughout all the difficult times that I faced before finishing my PhD. Deep thanks from my heart.
I would like to take this opportunity to thank the Iraqi ministry of higher education and research and their representative Iraqi cultural attaché for offer me this opportunity to finish my PhD here in the UK. Also, I would like to thank the School of the Built Environment for their help and support during my PhD journey. I am grateful to the academic and support staff from the School of the Built Environment for their efficient service and support.
Special thanks to the interview participants and questionnaire survey participants for spending their valuable time. Without their support, I would not have completed the PhD as expected. I would also like to thank my lecturers at the University of
XX
DEDICATION
XXI
DECLARATION
This thesis is submitted to the University of Salford rules and regulations for the award
of a PhD degree by research. While the research was in progress, some research
findings were published in refereed journals and conference papers prior to this
submission.
The researcher declares that no portion of the work referred to in this thesis has been
submitted in support of an application for another degree of qualification of this, or any
other university or institution of learning.
XXII
ABSTRACT
Building Information Modelling (BIM) is defined as an approach to building design, construction, and operation through modelling technology, associated sets of processes and people to produce, communicate and analyse building information models. The implementation of BIM is projected to improve the efficiency of the design, construction, and operation of an asset through 3D visualisation, integrated and automated drawing production, intelligent documentation and information retrieval, consistent data and information, automated conflict detection and automated material take off.
Despite the considerable value that BIM can add to any project, it has been noted that BIM prevented to be widely implemented due to the lack of clients’ demand. The lack of BIM understanding and the initial cost of BIM implementation represent the main barriers which clients always hesitate to use BIM. To overcome these difficulties, clients have to understand their roles in the BIM implementation process and also provide the requirements that will enable them to use BIM effectively and realise the desired benefits of BIM. These requirements have been identified as competencies. The lack of using these competencies inside the UK has raised questions about why together with the suitability of using them within the UK. In addition, the lack of presenting these competencies with relation to the benefits increase clients concerns about the feasibility of having these competencies.
The aim of this research was therefore set out to support client organisations in the UK to implement BIM effectively by establishing BIM maturity competencies–BIM uses benefits assessment relationship for the UK construction client. The research engaged a multiple-case-studies approach to validate the proposed BIM maturity competencies list and online questionnaire to validate the relationship between BIM maturity competencies and BIM uses benefits. Data from each case was analysed by using a content analysis technique before being cross-analysed to determine the patterns of the interviews’ manuscripts. In addition, the online questionnaire was analysed using correlation techniques. The findings were then discussed and theoretically validated to produce a conceptual framework.
1 | P a g e
Chapter 1:
2 | P a g e
1.1 Introduction
The construction industry has an active and important role in the UK economy (Department for Business Innovation & Skills, 2013) and is represented in the Government’s first growth review in 2011 (UK Commission for Employment and Skills, 2013). The growth of the UK economy increased by 0.8% during the third quarter 2012, helped by a 2.5% growth in construction (Hayman, 2014). Meanwhile, in 2012 the gross value added (GVA) of the construction industry was £83 billion which equates to approximately 6.0% of the total UK economy (Rhodes, 2013; O. o. N. Statistics, 2011).
Despite its contribution to the economy’s development, the UK construction industry is facing significant pressure from the UK Government to deal with all the factors likely to affect the demand for asset construction (Department for Business Innovation & Skills, 2013). These include reducing the capital costs, some modern challenges (such as globalization), demographic changes, the demand for green energy, and sustainable construction (Barton et al., 2013).
At the project level, activities are usually divided into purposeful areas, which are completed by different stakeholders (e.g. the client, architects, engineers, and contractors). Regularly, each discipline makes decisions without considering its impact on others (Love et al., 2011), which can create barriers. These barriers cause project delays that directly lead to an increase in the amount of time needed to complete the project; furthermore, additional resources are required to complete the project, thus productivity rates decrease and costs rise. The fragmented structure of the industry also contributes towards the productivity conundrum (Cox and Townsend, 1997; Proverbs et al., 2000). Egan (1998) reported how within this structure, each party involved has become less trusting, more self-interested and adversarial. Effectively, risks are passed down to the next layer in the supply chain in order to minimise exposure. As a result, there are many interfaces and possible conflicts that ultimately lead to increased cost, and reduced efficiency and productivity.
3 | P a g e applications such as estimation and planning can be completed in minimal time with a high level of efficiency (Chan et al., 2016; Ghaffarianhoseini et al., 2016; Peansupap and Walker, 2005; Shen et al., 2016).
The Construction Industrial Strategy in the UK emphasises the major progress being made in the implementation process of BIM, which will become mandatory for all public sector construction projects from April 2016 onwards (Department for Business Innovation & Skills, 2013; UK Commission for Employment and Skills, 2013). The main driver behind this strategy is that BIM could revolutionise the project process by transforming the whole industry. In that its approach to asset whole life value differentiates it from other technologies by combing the technology aspects with process aspects to optimise the end value of an asset (Haron, 2013). This is set not only on the advantages of 3D parametric modelling, but also on the structured information that is organised, defined, and exchangeable (Haron, 2013). The structured information will lead to more effective communication and collaboration between the project stakeholders throughout the project lifecycle (D. K. Smith and Tardif, 2012). In addition, the different construction industry stakeholders consider it as the main driver towards them gaining considerable value in their projects (Eastman, 2011). For example, the federal government in the USA has predicted savings of 5-12% from project costs when BIM is used (Jernigan, 2008). This new approach reduces the pressure on the construction industry and paves the road to achieving a high level of efficiency and productivity.
Despite the positive value that can be derived from BIM, there is still a fairly large proportion (43.4%) from UK contractors who state that they do not perceive it as a core competency because of client demand is a barrier to adoption of BIM (NFB, 2013). The overwhelming majority of respondents (contractors) said that they had not asked about BIM experience in PQQ or ITT when procuring suppliers, which clearly demonstrates a lack of drive and demand from the clients to the supply chain (Market, 2014; RICS, 2011). In addition, non-users trust that their clients are not using BIM, with 87% believing that clients are using it on 15% or less of projects which mean that clients in particular can play vital role in BIM implementation process. The factor that is important to project stakeholders for driving their BIM implementation is the impact of client demand. The highest percentage of stakeholders’ view more client/owner/operators requiring BIM as important to increasing the business benefits they experience from BIM (Smart Market 2011).
4 | P a g e of implementation. Client demands could be a significant motivation for the industry to start to implement BIM (Isikdag et al., 2012; Porwal and Hewage, 2013; Sackey et al., 2013). In addition to that, considerable research has stated that as one of the construction stakeholders, clients can stimulate the innovation to achieve the desired benefits of BIM (Gann and Salter, 2000; Getuli et al., 2016; Ghaffarianhoseini et al., 2016; C. Harty, 2005; K. Kulatunga et al., 2011; Manley, 2006; Jim Mason and Knott, 2016; R. Miller, 2009). Furthermore, widespread acceptance of BIM implementation has been hampered across the construction industry by client fears and a lack of full understanding of the benefits and the requirements (Erik Eriksson et al., 2008; Getuli et al., 2016; Ghaffarianhoseini et al., 2016; Brittany Giel and Issa, 2013c; Isikdag et al., 2012; Kassem et al., 2013; Jim Mason and Knott, 2016; Porwal and Hewage, 2013; Sackey et al., 2013; Succar, 2010b).
1.2 Problem statement and research justification
There is considerable literature that has focused on how to help construction industry stakeholders implement BIM in their organisations. However, there is a lack in considering clients are the real obstacle against BIM implementation across the construction industry (Yusuf Arayici et al., 2012; Azhar et al., 2008; Eastman, 2011; Hardin, 2011; Khosrowshahi and Arayici, 2012; D. K. Smith and Tardif, 2012; Yan and Damian, 2008). Smart Market Report (2012) stated that the client still has little trust in BIM compared to contractors and consultants, and is therefore still lagging behind contactors and designers in BIM implementation. Clients are facing difficulties on deciding whether or not to implement BIM based on understanding the perceive benefits to them (Barlish and Sullivan, 2012). In addition, there is a lack of understanding as to where, during the project lifecycle, BIM can provide benefits to the client, what some of the challenges are, and what the expected value is to the client (Becerik-Gerber et al., 2012).
5 | P a g e awareness of possible benefits and challenges from a client perspective, as well as an absence of training in how to use BIM applications (Gu and London, 2010).
The main reasons behind the client’s behaviour are that the benefits of BIM are not as clearly defined to clients compared to other construction industry stakeholders (Azhar, 2011; Barlish and Sullivan, 2012; Bryde et al., 2013; Hergunsel, 2011; Migilinskas et al., 2013; Yan and Damian, 2008). This is argued by Eastman et al. (2011) through a number of BIM applications along with the related benefits to the client. However, it is considered that the benefits presented by these authors are primarily project-based, i.e. improves the design and construction phase rather than supporting the business proposition of the client (Azhar et al., 2012; Codinhoto and Kiviniemi, 2014; Eadie, Browne, et al., 2013; Getuli et al., 2016; Ghaffarianhoseini et al., 2016; Jim Mason and Knott, 2016). Codinhoto et al. (2013) concluded that the emphasis on the design and construction benefits, explains the level of uncertainty in regards to the benefits of BIM beyond the handover stage.
In addition, the same emphasis is noted in relation to BIM capability maturity levels for facility management (Azhar et al., 2012; Codinhoto and Kiviniemi, 2014; Eadie, Browne, et al., 2013). According to Smart Market Report (2011), there is a relationship between the capability and maturity level and the benefits that can be achieved. However, the relationship between the BIM maturity level and the expected benefits are not clear and need to be addressed (Brittany Giel and Issa, 2013c; Kassem et al., 2013; Succar, 2015a). Also, there is a lack of consistency or methodology in measuring the benefits gained by implementing BIM and the maturity level of the organisations (HM Government 2012).
6 | P a g e add more clarification about the requirements that the client needs to develop in order to use BIM in different areas across the project life cycle.
1.3 Aims and Objectives
This research aims to develop a conceptual assessment framework for a Building Information Modelling (BIM) benefit-maturity relationship for client organisations in the UK construction industry to assist clients in deciding which BIM maturity competency(ies) that their organisations need to achieve in order to access the desired benefits.
In achieving the aim, the following objectives are defined:
1. Identify the importance of BIM for UK construction clients and of client roles in the BIM implementation process.
2. Identify the possible areas where BIM can be used and the corresponding benefits and requirements for each BIM use from a clients’ perspective.
3. Establish a BIM organisation maturity assessment model which can be used to evaluate UK construction clients.
4. Validate the proposed BIM maturity model and identify the relationship between client roles and the proposed BIM maturity competencies.
5. Establish, validate and produce a final assessment conceptual framework to explain the relationship between BIM maturity competencies and BIM uses benefits from the UK construction clients’ perspective. This objective also includes an explanation as to how UK construction clients can use the conceptual assessment framework on a practical basis.
1.4 Scope of the Research
This research identified client organisations’ roles in the BIM implementation process; these are developing the requirements and information validation, plus leading BIM implementation processes across their supply chain. Twenty-one potential areas have been identified in which BIM can be used throughout project lifecycle. Each area demands different types of requirements that clients need to provide in order to achieve the desired benefits of BIM. This research also proposes several critical success BIM competencies, which will support client organisations to improve their business via implementing BIM.
7 | P a g e for client organisations in the UK construction Industry. Both quantitative and qualitative data have been used to examine and validate the conceptual framework.
1.5 The Research Processes
The research processes designed to achieve the objectives of the research include: reviewing and synthesising current literature on the related fields of the research; developing a new concept to describe the area and subject of the research; empirically testing and presenting the findings in the form of new knowledge (Sarantakos, 2012). A schematic representation of the research is illustrated by Figure 1.1, and it can be seen that the research process includes five main phases, as follows:
1. Phase one: This phase includes the literature review that will help in developing the research aim and objectives. In addition, the research methodology will be established. The development steps of the draft conceptual framework that explains the relationship between BIM maturity competencies and BIM uses benefits from the client’s perspective is also included in this phase.
2. Phase two:
This phase contains the initial validation step which will be carried out
through a pilot study. Based on the experts’ views gathered from the pilot study, a draft version will be amended to produce the initial version of the conceptual assessment framework.
3. Phase three: This phase includes the first step of the validation process via the qualitative data analysis and discussion. This step will aim to validate the proposed BIM maturity competencies and develop their relationship with clients’ roles in BIM implementation process.
4. Phase four: This phase comprises the second step in the framework validation process via quantitative data analysis and discussion. This step will aim to validate the proposed relationship between BIM maturity competencies and BIM uses benefits.
8 | P a g e
Research Process
Phase one
Phase two
Phase three
Phase four
[image:30.842.85.822.80.514.2]Phase Five
Figure 1.1: Schematic representation of research process Literature
review
Develop the Aim and the Objectives
Identify the research methodology
Develop the draft version of the framework
Initial validation via pilot study
Initial version of the framework
Framework validation step
1
Quantitative data analysis and discussion Qualitative data analysis and
discussion
Framework validation step 2
Produce final version of the framework
Produce practical usage guide
9 | P a g e
1.6 Structure of the thesis
This thesis is organised into the following 7 chapters:
Chapter 1: This chapter includes an overview of the research problem and the justification. The research aim and objectives are discussed. The rationale and approach adopted to conduct this research are discussed. An overview of the research contribution is briefly discussed, and a brief summary of the organisation of the various chapters in this thesis is presented.
Chapter 2: In this chapter, a critical review of the literature relevant to the focus of this study is discussed. These issues include the UK construction industry, clients’ roles, information management, BIM, BIM for client organisations in terms of their requirements and benefits.
Chapter 3: This chapter presents a critical review of the literature, relevant to existing BIM maturity assessment models, in order to identify the critical success competencies that UK construction clients have to develop in order to use BIM effectively.
Chapter 4: An overview of the research methodologies available for the conduct of this research are presented and analysed. The use of the ‘Research Onion’ proposed by Saunders et al. (2009) in adopting the methodologies to conduct this research is discussed. Justifications for the choices made for each layer of the ‘Onion’ are presented. The data collection procedures and the associated data analysis procedures are also discussed and justified.
Chapter 5: This chapter conceptualises the phenomenon under consideration by developing a framework to illustrate the key areas identified from the literature and expert opinion. It also identifies the issues that will provide the focus for the course of the study.
Chapter 6: This chapter discusses the first process of validating the conceptual framework, which is based on a qualitative data analysis. The qualitative data have been collected via semi-structure interviews and documentary analysis. The main aim of this chapter is to validate the proposed BIM maturity competencies and investigate the relationship between BIM maturity competencies and BIM uses benefits.
Sixty-10 | P a g e five responses to the questionnaire survey are analysed and the conclusions drawn from the survey data are discussed.
11 | P a g e
Chapter 2: Building Information
12 | P a g e
2.1 Introduction
The key purpose of this chapter is to explore several discussions regarding the main areas of the literature review. The main areas relate to the research themes where the concerns are associated with UK construction clients, such as the client’s fears about BIM implementation and the lack of BIM understanding amongst client. They are the reason that the construction sector exists; therefore, clients are of great importance to the industry. In construction, however, it is doubtful that a client will be an individual as most clients are organisations or groups of people. It is vital to establish a definition of a client order to avoid misunderstanding. Client categories, what clients want, and the current challenges that clients are facing with project delivery will be discussed to help to understand the nature of the client and how they see the world; this will help to minimise the current barriers in deriving business benefits through construction projects. This chapter is thus essential in providing the rationale for BIM implementation from a client perspective, which is detailed in this literature investigation.
2.2 UK Construction Industry
Recent population growth statistics make the future of the construction industry prosperous. With the global population predicted to hit 9 billion by 2050, where two out of every three people could be living in cities, the demand for construction has never been greater. Worldwide, construction is already one of the largest industry sectors, accounting for more than 11% of the global GDP and expected to grow to 13.2% by 2020, according to the (PWC, 2014). However, concentrating on this strong demand obscures a more problematic reality. Underlying challenges in productivity, profitability, performance, labour, and sustainability could derail the industry’s growth. Today, the construction industry is at a crossroads. On the one hand, organisations that address these challenges head on and reimagine their business processes will be poised for significant growth. On the other, businesses that fail to take these challenges seriously, will face an uphill battle for viability (Leeds, 2016).
13 | P a g e industry is officially in recession as both house building and infrastructure output fell in the second quarter of 2016. Economists believe this could be an early sign that the wider economy could enter a mild recession later this year (O. f. N. Statistics, 2016).
The fragmented nature of the construction industry has been identified throughout the literature as a primary factor that affects its overall performance and productivity (Adetunji et al., 2003; Shammas-Toma et al., 1998). Any construction project involves many stakeholders, including the client, architects, engineers, contractors, subcontractors and suppliers, in delivering a one-of-a-kind project, which requires a significant amount of coordination (Isikdag and Underwood, 2010). This involves collaboration between a number of organisations which are brought together for the period of the project to form the ‘project team’ (Adetunji et al., 2003; Cox and Townsend, 2009; Morton and Ross, 2008). These organisations often show a discrepancy in terms of size, capabilities, skills, practices, ICT systems, and so forth, and more often they are based in different locations. However, they need to work collaboratively and share the same project information (Cox and Townsend, 2009; Jones et al., 2006; Morton and Ross, 2008; Shammas-Toma et al., 1998). This imposes a great challenge in deriving value, which can be increased by improved function or reduced in terms of whole life cost. In addition, achieving Value for Money (VfM), as a concept, relates to the optimum balance between the benefits expected of a project and the resources expended in its delivery, and most importantly in meeting client requirements through better collaboration between the project stakeholders (Adetunji et al., 2003; Shammas-Toma et al., 1998).
14 | P a g e by demanding efficiency, increasing client involvement and partnering, and introducing supply chain management approaches to construction projects and programmes (ECLLP, 2013).
Figure 2.1: Output per hour and output per worker (Tucker, 2016)
Egan (1998), Latham (1994), and Levine at al. (1995) have identified the necessity for a number of important changes in the way construction services are obtained and supplied, and to increase value for money, which is mainly focused on the characteristics of the construction process. The aforementioned reports, in addition to Wolstenholme (2009), identified the factors that need to be considered in order to improve the UK construction industry’s performance, and these are as follows:
Giving extra importance to end-users in the design and construction stages of a project, plus any future needs. This highlights the importance of involving client organisations and their operation and maintenance teams in the early stages of project, which should consequently reduce conflicts and improve efficiency.
15 | P a g e
Enhancing partnerships between clients, contractors and consultants to address issues collaboratively, reduce project time and cost overruns, promote innovation, and improve quality.
Establishing longer-term relationships with clients and contractors to encourage continuous improvement in the cost and quality of final products.
Identifying that accepting the lowest tender price for the initial capital costs does not provide value for money, and that the operation and maintenance costs of a building need more attention. Thus it can be seen that the total cost is identified as the target cost rather than just the capital cost; this will motivate the client to implement sustainable solutions for long-term benefits.
Reducing oppositional approaches between the industry and clients, which have produced high levels of litigation. This change will be achieved if the client and industry work in one environment with an ability to share the risks and benefits.
Expanding the use of prefabrication and standardised building components in construction to improve quality and cost effectiveness.
16 | P a g e
2.3 Construction Clients
Every single construction project begins with an optimistic idea from a client regarding a proposed project, which a project team of designers, architects, and engineers expand on to deliver. Nevertheless, clients of any industry are not a consistent group, and it follows those different clients, or categories of clients, will require different, and probably discrete, solutions to their problems, which will also present different opportunities (Cheong et al., 2003; Kamara et al., 2000; Vennström, 2008; Vennström and Erik Eriksson, 2010). It is, therefore essential that, before addressing the technical, managerial and aesthetic challenges of the project, the identity, nature and characteristics of the client are accurately identified. In understanding the client, the project team can become fully aware of, and understand, the their needs (Masterman, 2003). However, it is not easy to find one definition of the term construction client. The term was first used as an official requirement for legal advice or protection (Boyd and Chinyio, 2008; Masterman, 2003; J. B. Miller and Evje, 1999). Nevertheless, clients can also be identified as the initiators of projects and those who contract with other parties for the supply of construction goods or service (Atkin et al., 1995; J. B. Miller and Evje, 1999). In construction, however, it is doubtful that a client will be an individual; most are organisations or groups of people (Boyd and Chinyio, 2008). Therefore, the establishment of a client definition is vital in order to avoid misunderstanding, and it is proposed that the following meanings will be used throughout this work:
1. According to Wiggins (2014), construction (design and management) regulation (CDM) defines a client as an individual or organisation who, in the course or furtherance of a business, has a construction project carried out by another or by himself.
2. According to Cabe (2003), a construction client has been defined as the person or group that ‘owns’ the building. The client initiates the project, employs the design and construction teams, and finds the resources to make it a reality. The client is sometimes referred to as the ‘employer’, ‘champion’ or ‘manager’. The executive client is the name sometimes given to the most senior person in the client organisation. The lead client is the name of the senior person on the client project team.
17 | P a g e 4. Kometa et al. (1994) simply define the client as the one who pays the bills. The client
can be an individual or an organisation but is responsible for financing the project. 5. The construction client represents both owners and end-users who are responsible for
ensuring that all the requirements of owners, customers, and wider society are met by a construction project, from its initial conception to the final implementation (Vennström, 2008).
Thus, a client needs to be seen as an organisation, involving a set of teams with different viewpoints and needs (Newcombe, 2003; Rowlinson et al., 1999; J. Smith and Love, 2004). Nevertheless, there are different categorisations of client, which are explored in the next section in order to understand the differences and similarities in their nature and needs. 2.3.1 Client Types
The key to successfully managing a diverse team of service providers is to be open and honest regarding the variable priorities and expectations of the respective client. Understanding that every client is unique will guide the approach of all participants before any ground is broken (Kamara et al., 1999); Masterman (2003) states that client organisations have traditionally been categorised in the literature and statistical data as ‘public’ or ‘private’, which is a reflection of the ownership or source of funding of the organisation. In addition, the characteristics of these two types of client differ, mainly as result of the funding source. Figure 2.2 presents a lateral view of the different types of clients in the UK construction industry, according to their funded source (Kometa et al., 1994).
18 | P a g e 2.3.1.1 Public sector client
The public client is defined, basically, as a client who uses public funds to procure construction projects. In addition, all enterprises, agencies, and bodies are fully owned, controlled and run by the government, whether central, regional or a local (Shah, 2015). Therefore, government-based construction projects can be issued at three different levels:
Level 1: Local council
Level 2: State and territory government Level 3: Central (federal) government
Local councils have the duty of constructing and maintaining services, and this includes the police, housing, and leisure; state governments may instruct major capital works, such as new public buildings, or significant infrastructure changes. The highest level is central government departments who manage massive building and infrastructure projects, such as ministries, courts, environmental assets, and prisons (Boyd and Chinyio, 2008).
A typical characteristic of these publicly financed bodies is the need to guarantee that the expenditure of taxpayers’ money is secured by the adoption of risk-averse and conventional policies. Internal regulations, standing orders, and continuous control and auditing of expenditure are also used to ensure public accountability (Kometa et al., 1994; Masterman, 2003). There are substantial opportunities for central governments and the wider public sector to establish a solid lead through sustainable design, procurement, maintenance, and the operation of its built assets; in doing so, this also brings costs down for the rest of the market (Architecture and Environment, 2002). The public sector is considered the largest client sector of the construction industry, which works for the high-end life for the people by providing the following services (but not limited) to the people (Shah, 2015):
Generation of employment opportunities
Postal services
Providing education and health facilities at low cost
Providing security
Railway service
19 | P a g e
Utilities services
Leisure facilities 2.3.1.2 Private sector client
The private sector is the segment of a national economy that is owned, controlled and managed by private individuals. The private sector has a goal of making a profit, which can be achieved by forming a new initiative or privatising a public sector organisation. A large private-sector corporation may be privately or publicly traded. Businesses in the private private-sector drive down prices for goods and services while competing for consumers’ money (Boyd and Chinyio, 2008; Drew et al., 2001).
Private clients tend to be exclusive traders or domestic clients who would like to have an asset improved, extended or maintained (Kometa et al., 1994; B. Li et al., 2005). They enter into private contracts with a builder to carry out the work. The private client may have an architect who has created the drawings if planning or building regulations call for this (Tang et al., 2010). The private sector clients can be categorised under one of two main sub-divisions: 1. industry, or 2. services, as shown in the Table 2.1. These sub-divisions are used in economic categorisations and with agencies, such as Business Link (Boyd and Chinyio, 2008).
Table 2.1: Private clients’ categories Private
Industry Service
Agriculture and fishing
Biotechnology, medical and chemical
Construction and building
Energy and water Manufacturing
and engineering
Business Media Financial IT and
telecom Real state Travel and
tourism
20 | P a g e expected to serve the organisation’s mission, vision, and goals (Shah, 2015). The major services provided by the private sector are as follows:
Quality education
Telecommunication services
ICT services
Courier Services
Infrastructure development 2.3.1.3 Mix sector client
The final type of client is more complex and consists of a degree of mix between public and private enterprise (Boyd and Chinyio, 2008). Mixed clients can be classified into two main sub-divisions, namely not-for-profit and private regulated (Table 2.2). The not-for-profit client is a privately established organisation that offers a public service but channels its surpluses back into the service. Private regulated organisations carry out a public service, often with a monopoly, but are allowed to make a profit. The regulations define and monitor the service offered by this type of client and try to limit the profit by pricing control (Boyd and Chinyio, 2008).
Table 2.2: Mixed clients’ categories
2.3.1.4 Similarities and differences
Noticeable differences and similarities exist between clients in relation to their types. The following highlights the major differences between the public and private sector (Boyd and Chinyio, 2008; Kamara et al., 1999; Masterman, 2003; Shah, 2015):
Mixed
Not-for-profit Private regulated Rail
Housing associations Universities Religious TV and
Radio (BBC) Nuclear
power
Water Airport Ports Electricity
Gas
21 | P a g e
The public sector is part of the country’s economy where the control and maintenance are in the hands of the government. On the other hand, the private sector is owned and managed by private individuals and corporations. This leads to a significant difference in each client’s needs and business targets.
The aim of the public sector is to serve people whereas private sector clients are established with a profit motive. This basically means that each client type has different requirements that will affect his desire to implement any changes or new innovations.
In the public sector, the government has full control over client organisations. Conversely, private sector companies enjoy less government interference. This explains why the public client has to follow government strategies without considering financial benefits for these strategies. However, private clients have the freedom to examine any new strategies from a financial benefits point of view before deciding whether to implement them.
In the private sector, the working environment is extremely competitive; this is missing in the public sector where they are not established to meet commercial objectives. This can be considered a motivation to private clients to implement new innovations that maintain their competitiveness in the market. However, public clients show less interest in new innovations without government commitment.
Thus, different types of clients have different types of objectives; however, Egan (1998), Latham (1994), and Levine at al. (1995) suggested that a client’s project requirements represent the similarities between clients regardless of type, and these include:
• obtaining value for money;
• ensuring the project is delivered on time; • having satisfactory durability;
• incurring reasonable running costs; • being fit for its purpose;
22 | P a g e • having an aesthetically pleasing appearance;
• being supported by meaningful guarantees.
Despite differing client types, clients should work with experts to deliver their asset projects. Although clients may not have subject expertise, their overriding role as the client is just as important. Client aspirations and vision should drive all project stakeholders to make sure they meet client requirements.
2.3.2 Construction Clients’ roles
23 | P a g e Figure 2.3: The client's opportunity to increase project’s value (Kurokawa et al., 2016) To ensure greater efficiencies and value for money in how assets are built and operated, the client’s role is, more than ever, crucial in making sure the core requirements are maintained and communicated to the various parties involved (Wing et al., 2015). Therefore, providing accurate requirements is not enough without the validation of supply chain deliverables, which enables the client to achieve the desired benefits. Therefore, being the 'client' of a project is an important role which can provide opportunities for creativity through implementing new innovations and methods of delivery. However, it can also be a difficult and challenging role when the project is finished and it becomes apparent that the aims do not match the outcomes (Al-Harthi et al., 2014; Boyd and Chinyio, 2008; Doloi, 2012).