The wealth, health and wellbeing of Ireland’s older people before
and during the economic crisis
A. Barretta and V. O’Sullivanb
aESRI, Dublin, Ireland bTILDA, Trinity College Dublin, Ireland
Abstract
The economic crisis of 2008/9 was felt more acutely in Ireland relative to elsewhere and
culminated in the international bailout in 2010. Given the economic collapse, Ireland provides an ideal case-study of the link between wealth collapses and movements in variables such as health and well-being. Using nationally-representative samples of older people collected before and during the crisis, we show that mean net assets fell by 45 percent between 2006/7 and 2012/13. In spite of this massive fall in wealth, measures of health and well-being remained broadly
unchanged. However, expectations about future living standards became less optimistic. The results tend to support the findings of other recent studies that recessions do not have widespread negative effects on health and well-being.
Keywords
Recession; wealth; health; wellbeing
I. Introduction
The economic crisis of 2008/9 has led to the regeneration of interest in the question of whether recessions cause declines in health and wellbeing. Perhaps contrary to expectations, previous research found a counter-cyclical relationship between economic prosperity and health (Ruhm 2000). However, the emerging evidence is that the relationship between macro-economic events and health is loosening e.g. Tekin et al. (2013) and Ruhm (2013). Deaton (2012) also found a very weak relationship between subjective wellbeing and the recession in the USA.
As the recession in Ireland was more acute than elsewhere, we are provided with a particularly interesting situation in which to study the link between recession and health/ wellbeing. We find no evidence of declines in wellbeing or health in spite of a massive fall in wealth. Hence, our results are in line with the most recent studies cited above.
HHS Public Access
Author manuscript
Appl Econ Lett. Author manuscript; available in PMC 2015 October 15.
Published in final edited form as:
Appl Econ Lett. 2014 July 3; 21(10): 675–678. doi:10.1080/13504851.2014.884687.
Author Manuscript
Author Manuscript
Author Manuscript
II. Data Description
Our analysis needed nationally-representative data from before and after 2008/9 which contained information on wealth, health and wellbeing. No single source was available but we were fortunate in being able to draw on two very similar sources. We use data from the Irish component of the Survey of Health, Retirement and Ageing in Europe, SHARE, collected in 2006/7, and from two waves of The Irish Longitudinal Study on Ageing, TILDA, collected in 2010/11 and 2012/13.
Both samples are nationally representative of those aged 50 and over and were constructed using the RANSAM system developed by the Economic and Social Research Institute of Ireland (Whelan (1979). Around 1,100 participants were interviewed during 2006/2007 for the Irish component of SHARE. A full description of the methodology of SHARE Ireland can be found in Delaney et al. (2008). Over 8,500 people participated in the first wave of TILDA between late 2009 and early 2011 and around 7,200 of these respondents were re-interviewed in the second wave between 2012 and early 2013. A detailed description of the design of TILDA can be found in Barrett et al. (2011). A specific discussion of the income and wealth data in TILDA can be found in O'Sullivan et al. (2013)
III. Results
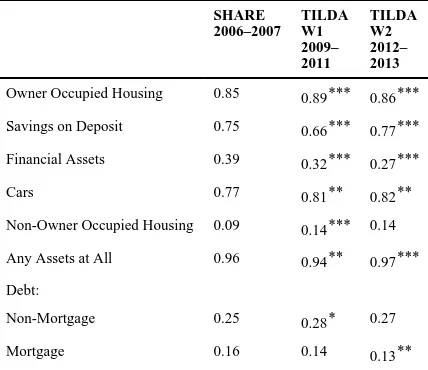
Table 1 shows the proportion of households holding different types of assets and debt in 2006–2007, 2009–2011 and 2012–2013. The proportion owning houses and cars has remained around the same magnitude. However the proportion with savings on deposit initially fell from 0.75 to 0.66 and then returned to pre-crisis levels. This trend could reflect fears about the stability of the Irish banking system in 2010 and the gradual growth of confidence thereafter. The proportion with financial assets fell from 0.39 before the crisis to 0.27 in the most recent data. The proportion with nonmortgage debt levels has fluctuated but remained between 0.25 and 0.3. The proportion with mortgage debt dropped slightly and remains at 0.13 in the most recent data.
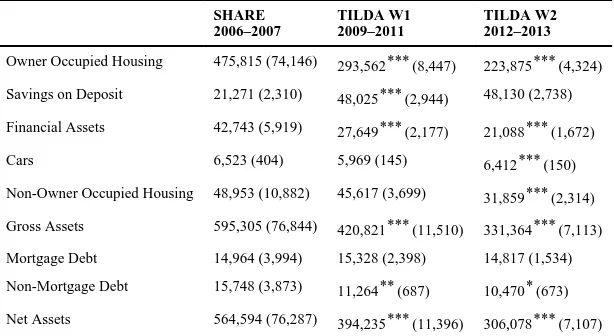
In Table 2 we see that mean net assets fell from €564,594 in 2006/7 to €306,078 in 2012/3, a fall of 45 percent. The fall is largely accounted for by declines in housing wealth. Housing wealth fell by about 40% from €475,815 in 2006/2007 to €293,562 in 2009/2011 and by a further 24% during the recession. Despite the fall in the proportion of households with savings on deposit, the mean holding of savings doubled from before the crisis and has remained around €48,000 throughout the crisis. Conversely the mean value of financial assets fell from €42,743 in 2006/7 to €21,088 in 2012/3. Over the same period, the average value of non-owner occupied housing wealth fell from €48,953 to €31,859.
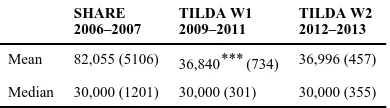
In Table 3 we show that mean net household income was €82,055 in the SHARE data. When compared to data from the Irish component of the EU-Survey on Income and Living Conditions, this value did not appear to be plausible so we concentrate on median values instead. Median incomes of older households do not appear to have changed throughout the crisis. This is not surprising given that many have sources of income that would not have
Author Manuscript
Author Manuscript
Author Manuscript
changed with the crisis – e.g. age related social welfare payments, defined benefit pension schemes.
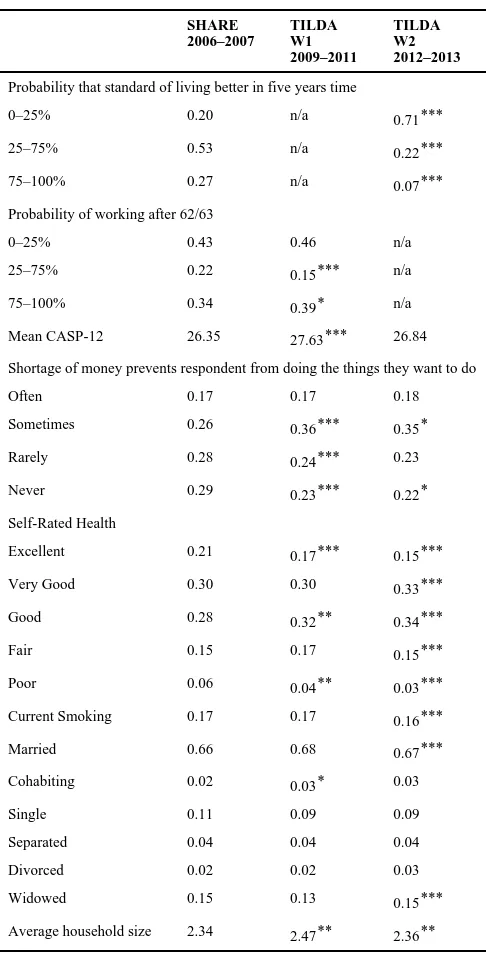
In Table 4, we present summary statistics for variables that relate to quality of life, health, expectations and some other demographic issues. We use the CASP-12 score, developed by Hyde et al. (2003), as a way of measuring quality of life among older people across four domains: control, autonomy, self realisation and pleasure. Respondents are presented with a series of statements and asked whether they agree with them: often, sometimes, not often and never. Responses are scored 0–3 and aggregated (although reverse coding applies for certain questions). Thus the maximum score for CASP-12 is 36. We can see from Table 4 that quality of life, rose slightly over the period of the analysis. However the increase is very small, given that the standard deviation of CASP scores in each year is between 3 and 5 units. In relation to the one item of the CASP scale that explicitly refers to personal finances, since the recession started, respondents are less likely to never feel that lack of money is preventing them in doing the things that they want to do.
As regards self-rated health, there is no clear trend towards improvement or
disimprovement. The proportions reporting poor or excellent health have fallen with corresponding increases in the middle ranking categories.
In SHARE and Wave 2 of TILDA, participants were asked: “what are the chances that five years from now your standard of living will be better than today?”. The proportion with the most pessimistic view in 2012/2013 is over three times that of 2006/2007. In relation to early retirement, the proportion with strong expectations to retire early at age 62/63 did not change.
We examined a number of other items and while we do find some statistically significant changes in marital status and smoking, the pattern of results does not point to a qualitative deterioration in quality of life. We also find that household size initially increased slightly from before the crisis but has since returned to pre-crisis levels. It does not appear that children are living in their family home for longer or returning to the family home as a result of the economic crisis.
IV. Conclusion
Older Irish people have experienced very large reductions in their wealth as a result of the recent economic collapse. Despite this, average levels of wellbeing and self-reported health do not appear to have declined. These findings provide support to some recent papers which have reported similar findings for the US (Tekin et al. (2013) and Ruhm (2013)) and for Ireland (Walsh, 2011).
Acknowledgements
We acknowledge comments from Jim Smith, Kevin Denny, Irene Mosca, Eibhlin Hudson and Anne Nolan. We acknowledge financial support from the NIA (grant R21AG040387). We use data from SHARE release 2.5.0. The SHARE data collection has been primarily funded by the European Commission through the 5th Framework Programme (project QLK6-CT-2001-00360 in the thematic programme Quality of Life), through the 6th
Author Manuscript
Author Manuscript
Author Manuscript
SHARE-LEAP, N° 227822 and SHARE M4, N° 261982). Additional funding from the U.S. National Institute on Aging (U01 AG09740-13S2, P01 AG005842, P01 AG08291, P30 AG12815, R21 AG025169, Y1-AG-4553-01, IAG BSR06-11 and OGHA 04-064) and the German Ministry of Education and Research as well as from various national sources is gratefully acknowledged (see www.share-project.org for a full list of funding institutions).
References
Barrett, A.; Savva, G.; Timonen, V.; Kenny, RA., editors. Fifty Plus in Ireland 2011: First Results from the Irish Longitudinal Study on Ageing (TILDA). TILDA, Dublin: 2011.
Deaton A. The financial crisis and the well-being of Americans. Oxford Economic Papers. 2012; 64:1– 26. [PubMed: 22389532]
Delaney, L.; Harmon, C.; Kelleher, C.; Kennedy, J.; O'Shea, E.; Gannon, B. SHARE Ireland First Results, Geary Institute Working Papers. Geary Institute, University College Dublin; 2008. Hyde M, Wiggins RD, Higgs P, Blane DB. A measure of quality of life in early old age: the theory,
development and properties of a needs satisfaction model (CASP-19). Aging & Mental Health. 2003; 7:186–194. [PubMed: 12775399]
O'Sullivan V, Barrett A, Nolan B. Income and wealth in The Irish Longitudinal Study on Ageing. IZA Discussion Paper No. 7393. 2013
Ruhm CJ. Are recessions good for your health? Quarterly Journal of Economics. 2000; 115:617–650. Ruhm CJ. Recessions, healthy no more? National Bureau of Economic Research Working Paper No.
19287. 2013
Tekin E, McClellan C, Minyard KJ. Health and health behaviors during the worst of times: evidence from the Great Recession. National Bureau of Economic Research Working Paper No. 19234. 2013 Whelan BJ. RANSAM: a random sample design for Ireland. Economic and Social Review. 1979;
10:169–174.
Author Manuscript
Author Manuscript
Author Manuscript
Author Manuscript
Author Manuscript
Author Manuscript
[image:5.612.80.294.120.305.2]Author Manuscript
Table 1
Proportion with non-zero holdings of asset/debt type
SHARE 2006–2007
TILDA W1 2009– 2011
TILDA W2 2012– 2013
Owner Occupied Housing 0.85 0.89*** 0.86***
Savings on Deposit 0.75 0.66*** 0.77***
Financial Assets 0.39 0.32*** 0.27***
Cars 0.77 0.81** 0.82**
Non-Owner Occupied Housing 0.09 0.14*** 0.14
Any Assets at All 0.96 0.94** 0.97***
Debt:
Non-Mortgage 0.25 0.28* 0.27
Mortgage 0.16 0.14 0.13**
Notes: Asterisks indicate significance level of test of difference with immediate earlier period.
Author Manuscript
Author Manuscript
Author Manuscript
[image:6.612.80.387.120.288.2]Author Manuscript
Table 2
Mean holdings of assets/debt
SHARE 2006–2007
TILDA W1 2009–2011
TILDA W2 2012–2013
Owner Occupied Housing 475,815 (74,146) 293,562*** (8,447) 223,875*** (4,324)
Savings on Deposit 21,271 (2,310) 48,025*** (2,944) 48,130 (2,738)
Financial Assets 42,743 (5,919) 27,649*** (2,177) 21,088*** (1,672)
Cars 6,523 (404) 5,969 (145) 6,412*** (150)
Non-Owner Occupied Housing 48,953 (10,882) 45,617 (3,699) 31,859*** (2,314)
Gross Assets 595,305 (76,844) 420,821*** (11,510) 331,364*** (7,113)
Mortgage Debt 14,964 (3,994) 15,328 (2,398) 14,817 (1,534)
Non-Mortgage Debt 15,748 (3,873) 11,264** (687) 10,470* (673)
Net Assets 564,594 (76,287) 394,235*** (11,396) 306,078*** (7,107)
Notes: Asterisks indicate significance level of test of difference with immediate earlier period.
Author Manuscript
Author Manuscript
Author Manuscript
[image:7.612.79.274.121.175.2]Author Manuscript
Table 3
Annual net household income
SHARE 2006–2007
TILDA W1 2009–2011
TILDA W2 2012–2013
Mean 82,055 (5106) 36,840*** (734) 36,996 (457)
Median 30,000 (1201) 30,000 (301) 30,000 (355)
Notes: Asterisks indicate significance level of test of difference with immediate earlier period.
Author Manuscript
Author Manuscript
Author Manuscript
[image:8.612.79.322.115.592.2]Author Manuscript
Table 4
Expectations and quality of life
SHARE 2006–2007
TILDA W1 2009–2011
TILDA W2 2012–2013
Probability that standard of living better in five years time
0–25% 0.20 n/a 0.71***
25–75% 0.53 n/a 0.22***
75–100% 0.27 n/a 0.07***
Probability of working after 62/63
0–25% 0.43 0.46 n/a
25–75% 0.22 0.15*** n/a
75–100% 0.34 0.39* n/a
Mean CASP-12 26.35 27.63*** 26.84
Shortage of money prevents respondent from doing the things they want to do
Often 0.17 0.17 0.18
Sometimes 0.26 0.36*** 0.35*
Rarely 0.28 0.24*** 0.23
Never 0.29 0.23*** 0.22*
Self-Rated Health
Excellent 0.21 0.17*** 0.15***
Very Good 0.30 0.30 0.33***
Good 0.28 0.32** 0.34***
Fair 0.15 0.17 0.15***
Poor 0.06 0.04** 0.03***
Current Smoking 0.17 0.17 0.16***
Married 0.66 0.68 0.67***
Cohabiting 0.02 0.03* 0.03
Single 0.11 0.09 0.09
Separated 0.04 0.04 0.04
Divorced 0.02 0.02 0.03
Widowed 0.15 0.13 0.15***
Average household size 2.34 2.47** 2.36**
Notes: Asterisks indicate significance level of test of difference with immediate earlier period.