Journal of Criminal Law and Criminology
Volume 69
Issue 4
Winter
Article 17
Winter 1978
Mandatory Prison Sentences: Their Projected
Effects on Crime and Prison Populations
Joan Petersilia
Peter W. Greenwood
Follow this and additional works at:
https://scholarlycommons.law.northwestern.edu/jclc
Part of the
Criminal Law Commons,
Criminology Commons, and the
Criminology and Criminal
Justice Commons
This Criminology is brought to you for free and open access by Northwestern University School of Law Scholarly Commons. It has been accepted for inclusion in Journal of Criminal Law and Criminology by an authorized editor of Northwestern University School of Law Scholarly Commons.
Recommended Citation
9901-4169/78/6904-0604$02.00/0
THE JOURNAL OF CRIMINAL LAW & CRIMINOLOGY Vol. 69, No. 4
Copyright © 1978 by Northwestern University School of Law Pn'nted in U.S.A.
CRIMINOLOGY
MANDATORY PRISON SENTENCES: THEIR PROJECTED EFFECTS ON CRIME
AND PRISON POPULATIONS*
JOAN PETERSILIA** AND PETER W. GREENWOODt
INTRODUCTION
Reform of sentencing statutes has recently emerged as a major issue of national debate. New legislation is being considered at both federal and
state levels to modify criminal proceedings, partic-ularly sentencing. At the beginning of 1977, the
federal government and the legislatures of thirty states were contemplating major revisions of their criminal codes.'
Two concerns have apparently prompted this interest in sentencing reform. First, criminologists, legal scholars and political leaders have expressed discontent with excessive disparities in the sen-tences imposed and served under present statutes. It has been repeatedly shown that persons of similar criminal history convicted of similar crimes are treated differently by the courts. For example, the average prison sentence for persons convicted of bank robbery is eleven years nationwide, but five and one-half years in the Northern District of Illinois and seventeen years in Georgia.2 Much of the blame for the disparity has been placed on the wide latitude allowed judges under current
sen-* This paper was prepared under Grant Number
77-NI-99-0053 from the National Institute of Law Enforce-ment and Criminal Justice, Law EnforceEnforce-ment Assistance Administration, U.S. Department of Justice. Points of view or opinions stated in this document are those of the authors and do not necessarily represent the official position or policies of the U.S. Department of Justice. The authors wish to thank Hans Zeisel, James Q. Wilson, Daniel Glaser and Jan Chaiken for reviewing an earlier draft of this article.
** Joan Petersilia is a Research Associate in the Rand Criminal Justice Program, and is the coauthor of CRIMI-NAL CAREERS OF HABITUAL FELONS (1978) and THE
CRIM-INAL INVESTIGATION PROCESS (1977).
t Peter Greenwood is the Director of the Rand Crim-inal Justice Program, and coauthor of CRIMINAL CAREERS
OF HABITUAL FELONS (1978), THE CRIMINAL
INVESTIGA-TION PROCESS (1977) and PROSECUINVESTIGA-TION OF ADULT FELONY
DEFENDANTS (1976).
'Compiled from a recent, unpublished survey con-ducted by the Rand Corporation in 1977.
'CRIME CONTROL DIGEST, June 13, 1977, at 3.
tencing statutes. In addition to obvious jurisdic-tional differences, some empirical evidence suggests that a significant part of the disparity reflects judicial prejudice, conscious or subconscious. For example, a study of sentences for larceny and assault disclosed that in state courts 74% of the blacks convicted of larceny were sentenced to prison, while only 49% of the whites with similar records were imprisoned. Many criminologists
have called for substantial changes in sentencing
on the grounds that the current practice is grossly inequitable.
Second, there is mounting public distress over not only the high rate of violent crimes but also over the rise in property crimes. Encouraged by the
mass media, the public has begun to blame judicial leniency for the high level of such crime. Many
citizens believe that a "get tough" policy in the
courtroom would (1) help protect them against serious criminals by imprisoning such persons for longer periods, and (2) deter other persons from crime because of the harsher sentences they would expect to receive if caught. This notion exists not only in the popular realm but it is also advanced
by respected law enforcement personnel. For
in-stance, former U.S. Attorney General Edward H. Levi recently cited the failure of the courts to imprison enough criminals as a primary reason for
rising crime rates.4
Many advocates of reform are convinced that more certain, more widely publicized and more .severe prison sentences for serious offenders will enhance public protection. They cite recent empir-ical evidence that most serious crime is committed
by repeaters -and that these recidivists, although repeatedly arrested and convicted for serious crimes, are not consistently imprisoned. Statistics compiled by the Rand Corporation reveal that
3
ADMINISTRATION OFFICE OF THE U. S. COURTS,
FED-ERAL OFFENDERS IN THE UNITED STATES DisrRiar COURTS
77 (1971).
MANDATORY PRISON SENTENCES
60% of those arrested for robbery have a prior felony conviction, but only 48% of those with a
prior conviction are sentenced to prison.5
Because of the low probability of incarceration after conviction, many experts believe that the growth of crime can be substantially explained by the fact that, given our present use of sanctions, "crime pays." Therefore, an object of any new sentencing scheme must be to raise the "costs" of committing crime. If offenders were certain tl.at they would surely receive a prison sentence if con-victed for a serious offense, some might judge the penalty too great to risk. In fact, every empirical study relating the certainty of imprisonment to the crime rate has shown that the higher the probabil-ity of imprisonment for a major offense, the lower the rate for that offense 6
Even if the deterrent effect failed to reduce crime, increasing the proportion of offenders who go to prison should reduce the level of crime be-cause more offenders would be unable to commit crimes while imprisoned. Researchers have recently begun to estimate the probable reduction in crime if a larger proportion of convicted felons were imprisoned. The estimates vary widely depending on the assumptions made. For instance, it has been suggested that the rate of violent crimes could be reduced by as much as 80% if every person con-victed of a violent crime were imprisoned for five years.7 But another study has concluded that "in-capacitation makes only a small and modest im-pact on the violent crime rate; a 4.0 percent drop is the highest estimate obtained in this re-search."8 Regardless of the continuing debate over how crime might be reduced by incapacitation, it appears inevitable that policymakers will alterstate sentencing codes in the hope of assuring more certain and equal justice. If this alteration also reduces crime, so much the better.
Two major reform proposals designed to limit the latitude of sentencing judges are receiving
se-5
Based on an analysis of the 1973 California Offender Based Transactional System arrest file, maintained by the California Bureau of Statistics.
6
Tittle & Rowe, Certainty of Arrest and Crime Rates,
5-Soc. FORCEs 455 (1974); Tullock, Does Ihniment Deter Crime? 36 PuB. INTRmr 103 (1974). Although these
findings are not inconsistent with deterrence theory, ther are other possible explanations for these effects that cannot be sorted out with the data currently available.
7 Shinnar & Shinnar, The Effects of the Criminaljustice
System on the Control of Crime A Ojantitatire Appmada, 9 LAw
& Soc'y REv., 581, 605 (1975).
8 Van Dine, Dinitz & Conrad, The Irapacitation of the
Dangerous Offeder. A Statistical Exp iment, 14 J. Rasxic
CRIME & DELNQUENCY 22,31 (1977).
rious attention. In the first proposal, called "flat-time sentencing," the legislature sets a specific sentence for each crime, or degree of crime, to be imposed by the judge and served in full, although reductions for "good behavior" are possible. The second proposal is called the "mandatory-mini-mum' sentence and it requires that a minimum period of incarceration be served. The mandatory-minimum scheme appears to be the more popular of the two. During the Ninety-fourth Congress alone (1975-76), more than thirty separate bills or resolutions calling for mandatory-minimum sen-tences were introduced. Several'states, including Massachusetts and Connecticut, have already
en-acted statutes requiring mandatory-minimum
prison sentences for conviction of certain offenses.
Most of the state reform proposals limit the
mandatory sentencing to specified crimes or
cate-gories of criminals. The most common category is
the repeat criminal because of the general belief that the greater number of crimes an offender commits, the more severe his sentence should be. Some states begin mandatory sentencing with the second offense,9 while others begin it at the third'0 or fourth." Other states have abandoned the "quantity of convictions" punishment principle by focusing on particularly dangerous aspects of a
crime, such as the use of a weapon,2 while a final
group combines the two philosophies and looks for
repetition of more violent crimes.'3 Whether the
prior offense need be a felony or a lesser crime is another point of variation." Similarly, the age of
the defendant at the titne of the prior offense5 and
the time span between offenses'6 are treated
differ-ently in various states.'7
If these reforms are instituted, more criminals
9E g., N.Y.
PENAL LAw (McKinney 1975)
§
70.06.'0Eg., Cowo. REv. STAT.§ § 16-13-101 (1973).
'Eg., VT. STAT. As. tit. 13, § 11 (1974).
'2MAss. ANN. LAws. eh 265, § 18B (Michie/Law. Co-op Supp. 1978).
UjFg., S.C. CODE 17-25-40 (1977); TENN. CODE ANN.
§40-2801 et req. (1975).
' Eg., MAss GrE. LAws ANN. ch. 279, § 25 (West
1968); Mo. ANN. STAT.
§
556.280, 290 (Vernon Supp.1975).
5
Compare Ky. REv. STAT. ANN. § 532.080 (Baldwin 1975) (over eighteen) with OR. REv. STAT. § 161.725 (1975) (sixteen).
'6Compare LA. Rav. STAT. § 15.529.1 (West 1967)
(convictions cannot have occured more than five years
after the maximum sentence for the previous conviction has expired) with Munm STAT. ANN. § 609.155 (West 1964)
(convictions cannot be more than ten years apart). -17Se Note, 45 FoymNntAm L REV. 76 (1976), for further
discussion of the above statutes.
PETERSILIA AND GREENWOOD
will undoubtedly be sent to prison. However, since many state prisons are now filled close to capacity, many prison facilities would probably have to be enlarged. Greater prosecutorial and investigatory resources will likely be required in a system with less plea bargaining and more severe sentences. Thus, the proposed sentencing reform implies greater system costs. It is imperative, therefore, that such reforms be preceded by an evaluation of the potential benefits in reduced crime that would offset these increased costs. Specifically, we must determine how much crime is prevented by impos-ing sentences of varyimpos-ing length on specific classes of offenders and must predict the impact that mandatory penalties will have on the prison pop-ulation. This article attempts to do both.
DATA BASE FOR THIS STUDY
We obtained data on a random sample of de-fendants convicted of serious offenses over a two-year period in the Denver, Colorado District
Court.'8 The sample population consists of 625
persons who were convicted between mid-1968 and mid-1970 of burglary, robbery, rape, aggravated assault, homicide, auto theft, selling drugs and grand larceny. The sample represents 42% of the
population available for study.
For each person in the sample, information was collected on personal characteristics, prior criminal record, court disposition of the current offense, and recidivism during a two year follow-up period. All of the data were obtained from secondary sources, that is, the various criminal justice records. These records included probation files for personal char-acteristics, district court files for the status of cur-rent cases and final court disposition, parole files for the length of time served on prison sentence and the recidivism rates of those released from prison, and police department files for rearrest and reconviction rates.
The collection of data was completed in March 1974; thus four to six years had elapsed since the time of the conviction that placed a person into the sample.
Property-related offenses were the most common type of crime committed by persons in the sample. Over one-third were prosecuted for burglary and another 20% for robbery. About 19% of the sample
1 The data were originally collected for the Denver
High Impact Anti-Crime Program, reported in Charac-teristics and Recidivism of Adult Felony Offenders in Denver (1974). We are grateful to John Carr for giving us access to this data base.
members were charged with assaultive acts, and another 10% with drug offenses. The remaining 18% of the sample were charged with theft (includ-ing auto theft) or miscellaneous offenses. Of the
625 convicted persons, 78.9% were found guilty as
charged; 17.8% were guilty of a lesser offense; 1%
were guilty of a more serious offense; and 2.2% unknown. The average age of the sample was
twenty-six years. Other characteristics are pre-sented in the next section.
CRIME-REDUCTION EFFECTS
In attempting to estimate the effect that man-datory minimum prison sentences would have on
the adult crime rate, we focused on the following questions:
Crime-Reduction Potential. If defendants convicted of
certain felonies were given mandatory prison
sen-tences, how much would the overall crime rate be reduced? The violent crime rate? The burglary rate? Optimal Length of Confinement How long a
sentence-one, three, five, more than five years-is
necessary to reduce significantly the overall level of crime? The violent crime rate? The burglary rate? Optimal "Target Population". Relying on official crim-inal justice records, which characteristics define sub-populations of offenders for whom an incapacitation policy would be justified?
In projecting the impact of a particular man-datory-minimum sentence policy, we assumed that all convicted defendants who meet the criteria specified by the policy will receive at least the mandatory-minimum term. Those who received longer terms in the past will continue to receive longer terms in the future. Moreover, when esti-mating incapacitation effects, we counted only those prevented crimes that are attributable to the extra incarceration time that results from the man-datory-minimum term. We did not include inca-pacitation effects attributable to sentences that would have been imposed in the absence of a mandatory-minimum policy.
METHODOLOGY
Two analytic techniques have been developed for estimating the incapacitative effects of alter-native sentencing policies. The first, a modeling approach, uses some form of mathematical model to estimate the relationship between sanctions and
crime rates. Parameters for these models, such as individual crime or arrest rates, are logically de-rived from aggregate data. Analyses using this
MANDATORY PRISON SENTENCFS
approach have been reported by Clarke,1 9
Green-berg,20 Shinnar and Shinnar,2 1 and Ehrlich,2 and
have been critically analyzed by Cohen.23 While
Clarke, Greenberg and Ehrlich all conclude that incapacitation effects are quite small, Shinnar and Shinnar claim to demonstrate that they are sub-stantial. In her review of these different models, Cohen demonstrates that they all lead to similar conclusions if similar estimates of the parameters describing the offender population are used. Ap-proximately a 5% increase in prison population is required to achieve a 1% reduction in crime.
The second approach, which is the one adopted in this study, relies on career histories to estimate the probable incapacitation effects if offenders had been sentenced differently in the past. The proce-dure takes a cohort of arrested or convicted offend-ers, examines their past convictions and determines case by case whether each offender would have been imprisoned at the time of his current offense if the sentencing policy being examined had been applied at the time of his last conviction.u This is the technique used by Van Dine and his colleagues to support their conclusion that incapacitation strategies, even when the sentences considered are
severe, have a modest impact on violent crime25
For our analysis, we proceeded as follows:
1. The sample was divided into three "offense co-horts" based on the offense with which they were
19 Clarke, Getting 'Em Out of Circulation: Does Incarceration
ofjuvenile Offenders Reduce Crime? 65 J. CRIU. L. & C. 528 (1974).
' Greenberg, The Intcapacitative Effect of Imprisonment: Some Estimates, 9 LAw & Soc'Y REv. 541 (1975).
21 Shinnar, supra note 7, at 581.
' Ehrlich, Participation in Illegitimate Activities: An Eco-nomic Analysis, 81 J. PoL ECON. 521 (1973); reprinted in
ESSAYS IN THE ECONOMICS OF CRIME AND PUNIsHMENT 68
(1974).
' Cohen, The Incapacitative Effect of Imprisonment: A
Crit-ical Review of the Literature, in DETEReNcE AND INCAPACI-TATION: ESTIMATING THE EFFECTS OF CRIMINAL SANCriONS ON CRIME RATES 187 (1978).
2 We will sometimes speak of preventing the "cohorts'
crimes." Those crimes reflect the offenses for which the defendants were originally charged-although approxi-mately 20 percent did not result in conviction. It is
assumed that persons in the cohort, whether found guilty
or not, did in fact commit the charged crime. Thus, a
person officially charged with burglary who was con-victed of grand theft is assumed to have committed the burglary. If he had been given a mandatory prison sentence on his immediately preceding conviction of a felony, the resulting imprisonment was counted as having prevented the burglary.
2 Van Dine, supra note 8, at 29.
officially charged in the 1968-1970 period: Violent: offenders charged with robbery, rape,
aggravated assault, homicide, and
kidnap-ping.
Burglay: offenders charged with burglary. Other Felonies: offenders charged with auto theft,
drug offenses, grand larceny, forgery, and miscellaneous offenses.
2. Each offender's criminal record was examined to determine whether he fell into. one of several subgroups of interest. For example, did he have one, two, or three or more prior adult felony convictions? Did he have any prior adult convic-tions for violent crimes?
3. For each offender, the time interval between the
immediately preceding adult felony conviction and the arrest date for the current crime was determined.
4. Several possible sentencing options were hypo-thetically applied to the defendant's immediately preceding conviction. For example, every person convicted of a robbery who had at least one prior adult conviction was hypothetically given a one-year mandatory prison term for the prior convic-tion. Then we ascertained whether or not these offenders would have been in prison at the time of their current offense. If so, the current offense was counted as having been prevented by that sentencing policy.
The diagram below illustrates the analytic tech-nique employed for an offender convicted of rob-bery on January 1, 1966, and January 1, 1967, and indicted for robbery on April 1, 1969.
5-year sentence
3-year sentence
1-year
I
I
I
I
I
I
I
I
Age 1966
18 Con-victed Jan. 1
1967
Con-victed Jan. 1
1968 1969 1970
Indicted-Apr. 1
1971 1972
This offender's 1969 robbery would be counted as not having been prevented by the 1-year sentence but having been prevented by a 3- or 5-year sen-tence since he would have been in prison on April
I, 1969!7
' We sometimes refer to the sample as a whole as the
all-felonies cohort.
'7 For those defendants with more than one prior
man-PETERSILIA AND GREENWOOD
SAMPLE CHARACTERISTICS
In dividing the sample into cohorts based upon the charge of their current crime, we might expect
that the persons in the cohorts would differ signifi- o
cantly with respect to prior criminal record or court disposition of the current offense. Tables I and 2
show the criminal history and disposition of the c E
case for each offense cohort. The tables show that q 1 c ,
the average offender in the burglary cohort was -'<
slightly younger than his counterpart in the other
cohorts; that the "other felonies" cohort was .
slightly more likely to have a adult record, proba- .) g . o
bly because it was the oldest group; and that the <
t-violent cohort received the most severe sentencing "
treatment by the courts. The other differences were
'-insignificant.. -
-
0 0
--FINDINGS ^
The Violent Cohort
We measured the extent that the violent cohort's -*. _
crimes would have been prevented by the imposi- C <
-tion of mandatory prison sentences for their pre-
-ceding adult felony conviction. Seven hypothetical
sentencing policies were considered: co- o -In C -<0
Sentencing Option I: Each offender convicted of an 1 Z-u
adult felony, violent or not, is sentenced to a 0 c-V
mandatory prison term of one, three, or five L%
0
years. <
Sentencing Option II: Each offender convicted of an
-adult felony whose criminal record shows at least 0 -t- i -- 'i
one previous adult conviction is sentenced to a
-mandatory prison term of one, three, or five <
years on each conviction after the first. On the - E,
first adult conviction the penalty structure re- 1 E E C) 2.
mains as under present law. ,t <
EC
Sentencing Option III: Each offender convicted of an 0c
adult felony whose criminal record shows at least cq -0
two previous adult convictions is sentenced to a 0
mandatory prison sentence of one, three, or five -,
years after the second conviction. On the first - 0-,. - .5
two convictions the penalty structure remains as j .. -0 -c 'a
under present law.
Sentencing Option IV.- Each offender convicted of a ' ._ _ _
violent felony is sentenced to a mandatory prison ", 0 -R
term of one, three, or five years. .
. 0 C) u u C)
datory-minimum policy had been in effect over the de- ".R
,C7C)-fendant's whole career, the second prior conviction might -U w
have been prevented by a sentence imposed on the first prior conviction. Thus our simplification will result in a slightly inflated estimate of the true incapacitation effect.
MANDATORY PRISON SENTENCES
Sentencing Option V." Each offender convicted of a violent felony whose criminal record shows at least one previous adult conviction (not neces-sarily for a violent crime) is sentenced to a mandatory prison term of one, three, or five years after the first conviction. On the first adult conviction the penalty structure remains as un-der present law.
Sentencing Option VI: Each offender convicted of a violent felony whose criminal record shows at least two previous adult convictions (not neces-sarily for violent crimes) is sentenced to a man-datory prison term of one, three, or five years after the second conviction. On the first two convictions the penalty structure remains as un-der present law.
Sentencing Option VII: Each offender convicted of a
violent felony whose criminal record shows at least one previous adult conviction for a violent crime is sentenced to a mandatory prison term of one, three, or five years after the first convic-tion. On the first adult conviction the penalty structure remains as under present law.
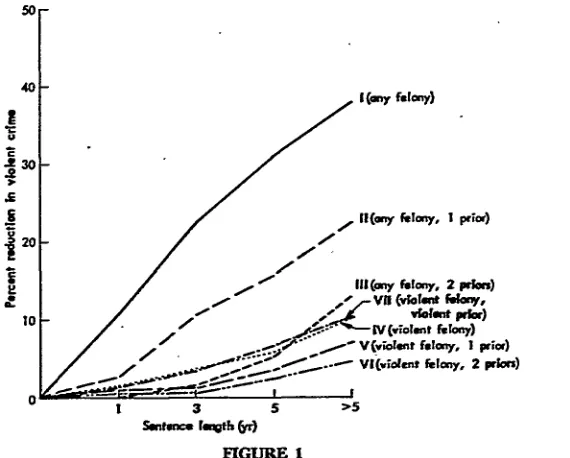
Figure 1 shows the percentage of the violent cohort's offenses that would have been prevented if the offender had been sentenced alternatively under each of the seven mandatory sentencing options for his immediately preceding felony con-viction.
Under option I, 10.9% of the cohort would have been prevented from committing their violent of-fense in the 1968-1970 period by a one-year man-datory prison sentence; 22.2% would have been prevented by a three-year sentence, and 31% by a
TABLE 2
DISPOSmON OF CURRENT OFFENSE, BY COHORT
Cohort Percentage of Specified Cohort Av. Length of Incar-ceration (years)* Convicted on Given Given Given Given Given
Cohort Charges Probation Jail Reformatory Prison Other
Violent 96 27 9 25 36 2.5 1.3
Burglary 69 28 8 34 25 4 1.1
Other felonies 71 6 25 32 28 8 .9
All felonies 79 22 13 32 30 4 1.1
'These averages represent a combination of the percentage of persons who were convicted but did not serve any institutional time, and the average time served by those sentenced to jail, reformatory, and prison.
50
40 1(ay felony)
.30 .2
. |l(arr fIony, I prir)
120
12
/ IIl(any futony, 2 pion)
- _-vIa (,fofy. f.l,
[image:7.454.84.369.390.619.2]- 1 3 5 >5
FIGURE 1
Percentage of violent cohiort offenses prevented by mandatory sentencing options
PETERSILIA AND GREENWOOD
five-year sentence. The data suggest that the inci-dence of violent crime might be lessened by one-third if every adult defendant convicted of a felony, regardless of prior record, were imprisoned for a period of five years. The maximum crime reduction effect possible under such a sentencing scheme is
40%. The "> 5 years" category on each of the
graphs can be interpreted as the maximum benefit derived under the different policies.
The less stringent sentencing options, options II through VII, impose mandatory prison sentences only on defendants whose criminal records contain previous adult convictions. For example, option II mandates imprisonment for persons previously convicted of at least one adult felony; under this option, a five-year sentence would have prevented
15.8% of the violent offenses.
Even more restrictive sentencing options-for example, those that require the defendant to pos-sess two priors or have convictions for violent of-fenses-prevent many fewer crimes. Such policies, even with a five-year imprisonment, reduced the violent crimes of the cohort by less than seven percent.
On the surface, these data tell us only that a certain percentage of the crimes for which the members of this cohort were officially charged would have been prevented by a particular man-datory-minimum sentence. Given the existing low rates of crime clearance and conviction, this num-ber represents a very small proportion of the total adult crime reported in a given period. However, the use of this small percentage as a measure of incapacitation implicitly assumes that each of the offenders in the sample committed only one crime-the crime for which he was officially charged. It further assumes that other active of-fenders, not arrested during the two-year period in question, did not experience earlier convictions that would have resulted in their incapacitation during the period.8s The use of these extremely conservative assumptions clearly leads to a large downward bias in the resulting incapacitation es-timates.
A more appropriate assumption would be that
the offenders in this sample represent a random
2' In other words, if we use only the crimes for which the offenders in our sample were convicted as a measure of incapacitation, we would be ignoring the crimes of defendants who were released and not subsequently con-victed during the period (i.e., the "successful" offender). Given the low probability of arrest and conviction for property crimes, there is reason to believe that their number is substantial.
sample, in terms of prior record characteristics, of
all offenders who were criminally active during the period of the study. In other words, if 30% of our sample have prior felony convictions, we assume that 30% of the crimes which were not cleared by arrest were also committed by offenders with prior felony convictions.
Theoretically, there are two reasons to suspect that a random sample of persons arrested or con-victed is not truly representative of all persons who are engaged in crime in a particular period. On the one hand, any random group selected on the basis of an arrest or conviction will tend to overrepresent offenders with higher crime rates; by definition they have a greater likelihood of entering the
sam-ple. This biasing effect would tend to make the
"random sample" assumption conservative, over-representing the high-rate offender. On the other hand, we know that arrestees and convicted persons overrepresent the offenders who commit crimes against victims who can identify them and who therefore have a higher probability of arrest.2 This bias would tend to make the "random sample" assumption too liberal, in overrepresenting the less sophisticated offender. Since the available evidence is inadequate for sorting out these two conflicting effects, we cannot be sure in which way the final estimate will be biased. Yet, the "random sample" assumption appears to provide a more reasonable basis for interpreting those results than any other assumption that we can make at this time.
In the rest of this article we will adopt the "random sample" assumption and will refer to the percentage of cohort crimes prevented as the per-centage of all reported crimes prevented. Also, in the model adopted here, there are no assumptions concerning the criminal lifetime of offenders or of a Poisson process for crime commissions, as in most studies of incapacitation effects.
The Burglary Cohort
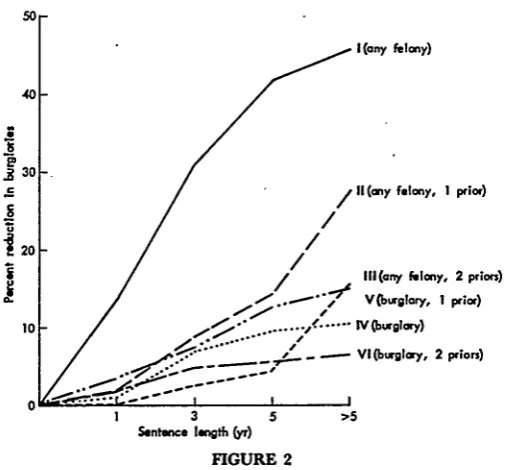
The sentencing schemes applied to the burglary cohort resembled those imposed on the violent cohort. Options I, II, and III were identical; options IV, V, and VI substitute burglary convictions for violent convictions as follows:
Sentencing Option IV. Each offender convicted of a burglary is sentenced to a mandatory prison term of one, three, or five years.
2 See VERA INSTITUTE OF JUSTICE, FELONY ARRESTS:
THEIR PROSECUTION AND DisPosmON IN NEw YORK CITY'S COURTS (1977).
MANDATORY PRISON SENTENCES
Sentencing Option V- Each offender convicted of a burglary whose criminal record shows at least one previous adult conviction (not necessarily for burglary) is sentenced to a mandatory prison term of one, three, or five years after the first conviction. On the first adult conviction the penalty structure remains as under present law.
Sentencing Option VI: Each offender convicted of a burglary whose criminal record shows at least two previous adult convictions (not necessarily for burglary) is sentenced to a mandatory prison term of one, three, or five years after the second conviction. On the first two convictions the pen-alty structure remains as under present law.
No option VII was applied to the burglary cohort. Figure 2 shows the percentage of the 1968-1970 burglary cohort offenses that would have been prevented by each of the six mandatory sentencing schemes. Comparison of the effects of the identical options I, II, and III in Figures 1 and 2 suggests that mandatory sentencing may have greater po-tential for reducing the incidence of burglary than of violent crimes.
Under option I, 42% of the offenders in the burglary cohort would have been prevented from committing their current burglaries if they had been imprisoned five years for their last adult felony conviction; 31% would have been prevented
by a three-year imprisonment; 14% because of a
one-year imprisonment. The most stringent option (option I, five-year imprisonment) would have pre-vented nearly one-half of the burglaries.
Option II, which limits mandatory prison sen-tences to offenders with at least one prior adult felony conviction, would have prevented few bur-glaries with one- or three-year imprisonments (1.9% and 8.5%, respectively). Options IV-VI, which are more conservative, also would have prevented only a few of the burglaries (approximately 1-12%).
Entire Sample
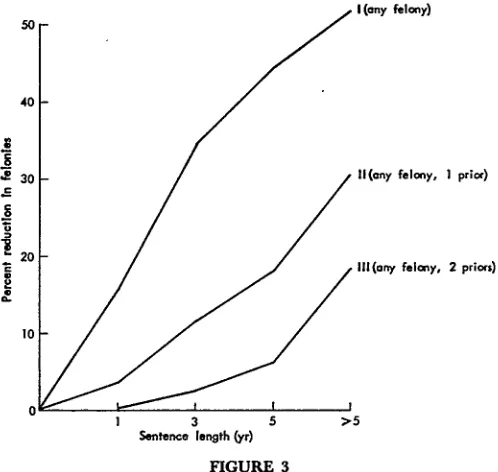
Figure 3 presents the percentage of all 1968-1970 felonies that would have been prevented if man-datory prison sentences had been imposed under options I, II, and III for the defendants' immedi-ately preceding adult conviction.
It has been suggested that every person convicted of a serious felony should receive some imprison-ment. Sentencing option I measures"the number of the entire sample's crime that would have been prevented under this principle. In applying the
most stringent form of this option (sentencing every
person convicted of a felony to five years' imprison-ment), we found that only 45% of the crimes committed by our sample would have been pre-vented. Option II, which sentences only persons previously convicted of an adult felony to five years
[(any felony)
/
II(cmy felony, I prior)/
/
/
/
--/ ,(any felony, 2 prior,) [image:9.454.87.345.373.608.2]V(burglary, I prior)
... IV(bglry)
. - VI(burglry, 2 priors)
I 3 5 >5 Sentence length (yr)
FIGURE 2
Percentage of burglary cohort offenses prevented by mandatory sentencing options
. .. .. 611
PETERSILIA AND GREENWOOD
I (any felony) 50
40
X 30 II (any felony, I prior)
20
u20 I1l(ony felony, 2 priors)
10
3 5 >5
Sentence length yr)
FIGURE 3
Percentage of entire sample's offenses prevented by mandatory sentencing options
in prison, would have prevented only 18% of the crimes.
These results cause us to doubt that
mandatory-minimum sentences can easily reduce the crimes
committed by adults. To reduce the level of crime in half, every person convicted of a felony, regard-less of prior criminal history, would have to be imprisoned for five years. If the length of imprison-ment were three years, the crime level could be reduced by a third; if it were one year, the reduc-tion would be 15%. Moreover, to reduce violent crime by one-third, every person convicted of a robbery, rape, aggravated assault; homicide, and kidnapping would have to be imprisoned for five years. Even if violent offenders were imprisoned for more than five years, violent crimes would only be reduced by about 40%. Finally, the burglary rate could be reduced by nearly half (42%) if all de-fendants were imprisoned five years for their pre-ceding adult conviction. With a three-year im-prisonment, crime would be reduced by 31%.
Some may regard the policy of sentencing every convicted person to prison as too harsh, since it does not take into account the offender's prior involvement in crime. However, these data suggest. that if only defendants who have a prior adult conviction are imprisoned, the crime-reduction ef-fect would be just about one-half that of the re-duction produced by sentencing every convicted
felon to prison. The crime reduction effects dis-cussed here may not be-as large as one would have expected. But, it must be remembered that the figures presented above represent only the effects due to incapacitation and do not take into account additional benefits resulting from deterrence or rehabilitation. Additionally, the policies considered deal only with adult sentencing, ignoring any al-ternative policies aimed at juveniles.
EFFECT ON PRISON POPULATION
Before opting for sentencing reforms, policymak-ers must weigh their projected benefits in crime reduction against their likely costs in increased prison population. Advocates of new mandatory sentencing schemes have generally ignored the likely extra burden on the correctional system. In this section, we consider the effect that the hypo-thetical sentencing options discussed in the preced-ing section would have on the prison population.30
30 For simplicity, we do not consider the total prison population but only that deriving from our sample of offenders. Our calculations measure the additional man-years of p. *son time to be served by the offenders sampled. For convenience, we translate these additional man-years into increases in the prison population. This translation assumes that enough time passes to achieve a new steady-state prison population, and that the prior offense char-acteristics of persons convicted do not change signifi-cantly.
[image:10.454.102.351.37.273.2]MANDATORY PRISON SENTENCES
Specifically, we estimate the percentage increase in the prison population if every convicted felon in the sample had been given a prison sentence of one, three, and five years, and we predict the percentage increase if every convicted felon with at least one prior adult conviction had been given a one, three, or five year prison sentence.
In projecting the impact of these mandatory minimum policies on future prison populations, one should take into account that some offenders would have received sentences in excess of the minimum mandated by the new policy. Therefore, applying these mandatory sentences to them would tend to reduce rather than increase the prison population. We have made no attempt to predict the "reduction" effect here. For the most part, the effect would be minimal, as the hypothetical sen-tences are considerably harsher than those nor-mally imposed.
METHODOLOGY
To estimate the percentage increase in prison population, we proceeded as follows:
1. For each hypothetical sentence (&g., all persons
convicted of a violent felony with one prior adult conviction will receive a three-year sentence), we distinguished three parts of the Denver sample: Those offenders who did not qualify for the sentence (not convicted of a violent felony or had no prior record).
Those offenders who qualified for the sen-tence but who were already sensen-tenced to terms longer than the mandatory-mini-mum, and hence would be unaffected by the new policy.
Those offenders who qualified for the sen-tence, had currently received less than the mandatory-minimum sentence, and who would be assumed to serve exactly the man-datory-minimum.
2. Members of the third group were the only ones whose sentences would be increased under the new mandatory-minimum policy. The total (minimum) increase in time to be served by this group is the difference between the mandatory minimum and the average time now served (S - T3), multiplied by the number of offenders in
the group (N3).
No attempt is made to distinguish between prison and jail time. Since some mandatory prison terms would result in a transfer of prisoners from jail to prison, the actual percentage increase in prison population will be larger than estimated. And since jails contain mostly misdemeanants and detentioners awaiting trial, the ac-tual increase in total incarcerated population will be less than estimated.
3. The percentage increase in prison population
owing to the third group can be estimated as the increase in time to be served (calculated in step 2), divided by the total time to be served by the entire sample, i.e.,
(S -T)N3
TiNt + T2N2 + T.N.'
where S = mandatory minimum sentence length
Ti = average time served by inmate in group i
Ni = number of inmates in group i.
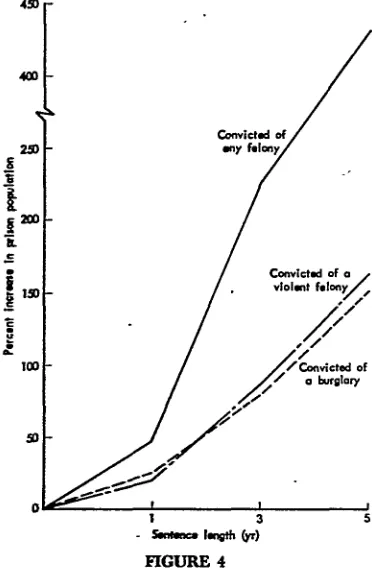
FINDINGS
Figure 4 shows the percentage increase in the prison population if the entire sample, regardless of prior criminal history, had been given a man-datory minimum sentence of one, three, or five years. The results are shown separately for those convicted of a violent felony, burglary, and all felonies. At the extreme, if every person convicted of a felony had been sentenced to a minimum of five years, the prison population would have in-creased by 450%; if each were sentenced to a
three-1 3 5
- , , Ien th (yr)
FIGURE 4
Increase in prison population with mandatory
[image:11.454.235.411.35.182.2] [image:11.454.230.416.316.601.2]PETERSILIA AND GREENWOOD
year minimum, a 230% prison increase would have occurred; and if each were sentenced for only one year, a 50% increase would have resulted.
If every person convicted of a burglary had been sentenced to a minimum of five years, the prison population would have risen by 150%; if each were sentenced to three years, there would have been a
75% increase; and if each were sentenced for one
year, a 25% increase would have occurred. Finally, if every person convicted of a violent felony had been given a five-year mandatory minimum sen-tence, the prison population would have risen by
160%; if each were given a three-year sentence,
there would have been an 80% increase; and if each received a one year sentence, a 25% increase would have resulted.
Figure 5 shows the impact of a more selective policy, under which those who had been convicted of at least one prior adult felony received manda-tory prison sentences. As the figure shows, limiting the mandatory-minimum sentence to persons pre-viously convicted seems to be a more plausible policy option because the impact on prison popu-lations is more reasonable. If every person in the sample who had at least one prior felony conviction had been sentenced to one year in prison, the prison population would have risen about 15%; if each were sentenced to three years, an 80% increase would have occurred; and if each were sentenced to five years, there would have been about a 190% increase.
CONCLUSIONS AND POLICY IMPLICIATIONS
We have analyzed the impact of various man-datory-minimum sentences on the adult crime rate
1 3
Sentence length (yr)
FIGURE 5
Increase in prison population with mandatory mini-mum sentences for at least one prior conviction
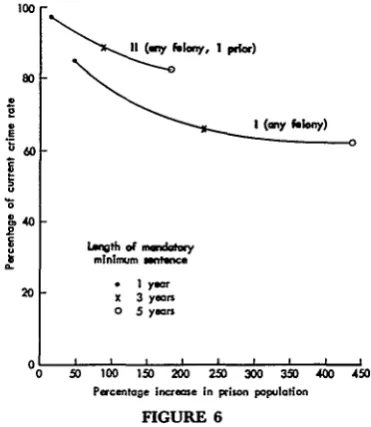
and on the prison population. The results are summarized in Figures 6 and 7 for the all-felonies cohort and for the violent cohort respectively. In Figure 6, the lower curve is generated by varying the mandatory-minimum prison term (one year, three years, five years) under sentencing Option I, which imposes the mandatory-minimum term on all convicted felons regardless of prior record. The upper curve corresponds to Option II, which im-poses the mandatory-minimum term (ofaltemative
100
00
I-I(..y lony, I p"l)
any fo )
Length of mwentoy
mInimun sentence
o I yer
0 5 years
o Sy t i t
0 50 100 150 200 250 300 350 400 450 Percentage increase in prison population
FIGURE 6
Effect on crime rate and prison population of sentenc-ing options I and II and a range of mandatory minimum sentences-all felonies cohort
00 V (violent felony, I prioer)
IV (Violet relony)
90
1 (oy felony, I prior)
~70
S Length -inimum sant e-aof maondotory
* year
60 3yer
0 5 years
0
50 10O 150 200 250 300 350 400 450 500 Parenotog. increase in prisn poplatIon
FIGURE 7
Effect on crime rate and prison population of sentenc-ing options I, II, IV and V and a range of mandatory minimum sentences-violent cohort
[image:12.454.238.424.150.364.2] [image:12.454.237.425.404.601.2] [image:12.454.33.216.429.611.2]MANDATORY PRISON SENTENCES
lengths) only on convicted felons- having at least one prior felony conviction.
Figure 6 clearly reveals the trade-offs between crime rate and prison population under the sen-tencing alternatives considered. For example, the crime rate would be reduced 15% (compared to 85% for the current level) and the prison popula-tion would (eventually) increase 50% if every per-son convicted of a felony were impriper-soned for one year (Option 1). To lower the crime rate by the same 15 percent under Option II, it would be necessary to impose a mandatory-minimum term of approxiamtely four years on felons with a prior conviction, which would raise the prison popula-tion by 125%.
Figure 7, showing the relation between crime rate and prison population for the violent cohort, addresses four sentencing options. We see that the more restrictive the prior-record condition that defines the group to which the option applies, the smaller its effect on crime rate. For example, a three-year mandatory-minimum term produces a 22% reduction in crime rate under Option I, and
11% reduction under Option II, a 3% reduction
under Option IV and 1% reduction under Option V-with the corresponding increases in'prison pop-ulation being, respectively, 225, 87, 87, and 27%. Contrast these results with those in Figure 6, which showed that a three-year mandatory-minimum term reduces the crime rate by 34% under Option I and 12% under Option Il-while raising the population 225 and 87%, respectively.
-This finding-that a better crime-reduction/ prison population trade-off would result from im-prisoning all felons for a short period regardless of prior record, may go against expectations that crime could be most effectively controlled by con-centration on the offenders with prior convictions. At this time, we can only speculate as to why this relationship is found. We know that under current sentencing policies, convicted offenders are much more likely to be sentenced to prison if they have a prior criminal record. Within this sample, only 57% of those defendants convicted with no prior record were incarcerated, while 90% of those with prior records were incarcerated. We also know that although the recidivism rate increases with any prior record, this increase is minimal when com-pared with the increase in likelihood of prison commitment.
We have referred earlier to the disparity in the sentences received by defendants with similar crim-inal records, convicted of similar crimes. Some of the disparity reflects the different philosophies held
by different judges. However, disparity is found in
the sentencing decisions of even a single judge. With respect to a series of similar defendants con-victed of similar crimes, he may give some defend-ants a straight probation, others a prison term, and still others a combination of probation and jail time. In making his sentencing decisions, a judge tries to assess the risk an offender will pose to the community if he is not confined and the impact that imprisonment would have on him and his future behavior. In so doing, the judge avoids an unjustly mechanical application of sentencing laws based only on the convicted charges and prior record.
For example, not all convicted armed robbers with prior records receive a prison sentence. In distinguishing the cases in which a prison term was imposed from those in which it was not, we would be likely to find systematic differences related to the judge's appraisal of the risk to the community. Those not sentenced to prison would have less serious prior records or better family and commu-nity ties, better employment records, etc., than those given prison terms. If there is a positive correlation between the risk estimated by thejudge and the actual risk posed by the defendant, we would expect to find that, on the average, defend-ants with serious prior records who are not given prison sentences have a lower recidivism rate than those convicted of similar offenses with minor prior records who are not given prison sentences. While we cannot prove that the relationships hypothe-sized above are in fact true, they are at least consistent with the crime reduction prison popu-lation curves in Figures 6 and 7 and they do deserve attention in future studies.'
In summary, mandatory-minimum sentence pol-icies can reduce crime through incapacitation ef-fects, but substantial increases in prison popula-tions will be required to achieve modest reducpopula-tions in adult crime. Our analysis indicates that for a one percent reduction in crime, prison populations must increase by three to ten percent, depending on the target population to be sentenced. These figures are consistent with the five to one ratio estimated by Cohen in her review of other inca-pacitative models.3 1 Our analysis suggests further that mandatory-minimum sentencing policies that focus only on defendants with prior records, al-though they may accord better with the notion of just deserts, are less efficient. Such policies result in less crime reduction for a specified increase in prison population than those policies that apply regardless of prior record.