Integrated Sci-Tech :
The Interdisciplinary Research Approach
Volume 1
Editorial board:
Ardian Ulvan
Irza Sukmana
Publisher :
Integrated Sci-Tech :
The Interdisciplinary Research Approach
Volume 1
ISBN
978 --- 602 --- 73260 --- 1 - 9
Editorial board:
Ardian Ulvan
Irza Sukmana
Cover and Layout :
IC-STAR Team
Publisher :
UPT. Perpustakaan Universitas Lampung
Photo :
Backcover :
Pegadung Gigi Hiu Beach, Lampung - photographer : Lukman Hakim
i
Editors/Reviewers
Trio Adiono
Deni Noviana
Denni Kurniawan
Diding Suhandy
Warsito
Shirley Savetlana
ii
Preface
This book is all about the interdisciplinary research that integrates engineering, life and applied
sciences, medical and biomedical engineering, agriculture engineering and food sciences. The aim was
to provide the initial roadmap at a cross section basic research, technological and social developments,
processes development, applications integrity, and real-world usage. The genuine motivation for the
book was to provide a suitable reference text for those who interested in the multi and inter
disciplinary studies which might be beneficial for basic and advance researches, enhancing the
curriculum and enriching teaching and learning materials, mostly in the level of postgraduate studies.
In addition, the book was also planned to provide advanced orientation and understanding for related
industries and governments to looking across industrial partnerships, business strategic, and policy and
regulations. In general, the book is expected to be beneficial for a wide range of readers.
This book consists of twenty five chapters divided into four sections i.e., engineering, life and applied
sciences, medical and biomedical engineering, agriculture and food science. Each chapter is a
completely self-directed contribution in chained discussion which aims to bring academia, researcher,
practitioners and students rise to speed with the novel developments within the particular area.
In order to enhance the reader experience, each book chapter contains its own abstract, instruction,
main body, as well as conclusion sections. Moreover, bibliography resources are available at the end
of each chapter.
To achieve all these aims and goals, the book should deliver a breadth of information. We are pleased
and thankful for all distinguish authors and reviewers for their contribution that have made this book
possible. We do hope that you will enjoy this book and find it as a useful guide and reference.
Editorial board:
Ardian Ulvan
iii
Table of Contents
Editors/Reviewers ... i
Preface ... ii
Table of Contents ...iii
SECTION 1 : ENGINEERING ... 1
Special Contribution ... 2
Interdisciplinary Research Activities on Disaster Prevention and Mitigation at Kobe University
by Forming Collaboration COE ... 3
Mechanical Characterization of Cells Exposed to Mechanical Loading ... 4
Analyses of Mobile Positioning Data ... 5
Chapter
1
... 6
The Utilization of Sorghum Rod Powder as Filler to Enchance Mechanical Strength In
Bioplastics Synthesis
Chapter
2 ... 13
Radiometric Correlation to Sulphur and Iron Content at BM-179 Kalan-West Kalimantan
Uranium Ore
Chapter
3 ... 21
Masterplan Road Network in the Border Region of Nunukan Regency of the North Kalimantan
Province
Chapter
4 ... 31
Migration in The Rural Impact : A Case Study of Bulupitu and Sepanjang Village,
Malang Regency, Indonesia
Chapter
5 ... 37
Ba
0.5Sr
0.5TiO
3based Photodiode Application as Light Sensor for Automatic Lighting
Control Switch
Chapter
6 ... 44
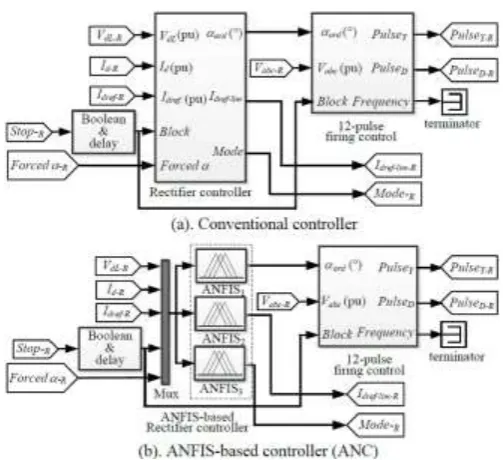
Regulation of 12-pulse Rectifier Converter using ANFIS-based Controller in a HVDC
Transmission System
Chapter
7 ... 54
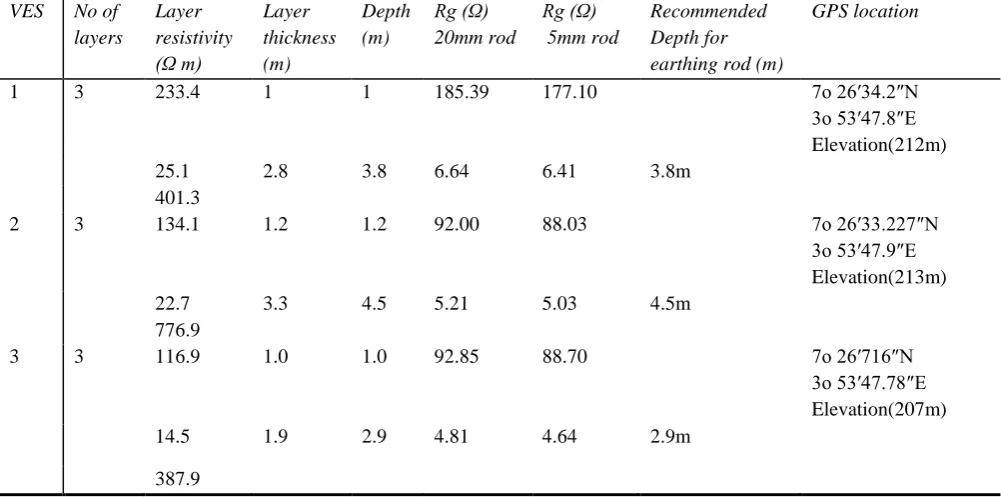
Estimation of Ground Rod Depth for Effective Performance during Installation in
Different Soil Types in Ibadan, South – West Nigeria
Chapter
8 ... 64
iv
Chapter
9 ... 71
Design of The Innovative Clothes Dryer by using “Triz” Approach
Chapter
10
... 77
Hydrofoil Boat For Indonesian Waters
Chapter
11
... 83
Urban Community Behavioral on the Traffic Light and Implementation of Intelligence
Traffic Control System
Chapter
12
... 91
K-Means Analysis in Mapping Concept Based on Geographic Information System
Chapter
13
... 99
Dynamics of A Re-Parametrization of Two Dimensional Map
Chapter
14
... 104
Characterization of Methyl Ester Obtained from Nanochloropsis Occulata and
Tetraselmis Chuii by using In-situ and Conventional Method
Chapter
15
... 111
Making Photodiode Based on Ba
0.5Sr
0.5TiO
3Thin Film on P-type Si (100) Substrate
with Chemical Solution Deposition (CSD) Method
Chapter
16
... 115
Designing Direct Current Electric Circuit for Foster Creative Thinking
Chapter
17
... 121
Smart Monitoring Data Centre base on Mini Single Board Computer BCM 2835
Chapter
18
... 129
Vocational High School E-Learning Readiness: A Survey for Industrial Knowledge Transfer
Chapter
19
... 136
Modeling and Simulation of Solar PV Array Emulator Utilizing Buck Converter
with Adaptive Control Base on Neural Network
Chapter
20
... 146
Line Balancing by combining given Work Cell and single tasks, a Small Scale Industry case
Chapter
21
... 153
Simulation of Type PWR (Pressurised Water Reactor) Reactor Water Temperature
using Optimal Discrete Control and D-Pole Assignment Method
Chapter
22
... 158
A Game of Arranging Scrambled Letters into Meaningful Words for Young Children
using FSA Method
Chapter
23
... 165
v
Chapter
24
... 170
Design of Boiler Controller with LAN Based Data Logger
Chapter
25
... 182
Tensile Strength Analysis of Concrete-Cellulose Composite from Coconut Coir
SECTION 2 : AGRICULTURE AND FOOD SCIENCE ... 190
Special Contribution ... 191
Bacterial Enzymes with Special Characteristics for Biotechnological Applications ... 192
Chapter
26
... 193
A Preliminary Assessment for The Presence of a Crushing Plant in Lampung Timur Regency
Chapter
27
... 200
Food Technopreneur A Design of New Curriculum in Indonesia’s Higher Education
Chapter
28
... 205
Establishing Working Relationship of Food Supplier as Part of effectiveness Food Safety
Assessment: Case Study in Indonesia Global Chain Restaurants
Chapter
29
... 211
Effect of Manure and Urea on Chemical Properties of Sandy Soil and Physiological
Properties of Aloe Vera L. Plant Cultivated in Coastal Sandy Area
SECTION 3 : MEDICAL SCIENCES AND BIOMEDICAL ENGINEERING ... 219
Special Contribution ... 220
A Begin of Robot Supported Human Programming ... 221
Chapter
30
... 222
Application Brain Wave for Wheel Robotic Movement using Mindflex
SECTION 4 : LIFE AND APPLIED SCIENCES ... 228
Special Contribution ... 229
Some Examples of Designing Integrated Heterogeneous Catalyst System ... 230
Chapter
31
... 231
Mitigation of N
2O and CH
4emissions from Corn Field using Urea Granulated with
Nitrification Inhibitors and Zeolite
Chapter
32
... 238
vi
Chapter
33
... 244
Histopathology of gill of Pangasius sutchi infected with Aeromonas hydrophila and
are cured using Curcumin
Chapter
34
... 250
Homeschooling in Lampung Province
Chapter
35
... 255
Education as an Earthquake Disaster Mitigation Efforts to Improve Safety in Children
Through State Primary Media Comics in The Village New District Labuhan Ratu
Bandarlampung Lampung
Chapter
36
... 269
Hipotetic Model of Continuous Professional Development of Vocational Lecturer in
The Higher Vocational Education In Lampung
Chapter
37
... 274
2
3
Interdisciplinary Research Activities on Disaster Prevention and Mitigation at
Kobe University by Forming Collaboration COE
Prof. Atsushi Iizuka 1,a
1
Research Center for Urban Safety and Security, Kobe University, 1-1 Rokkodai, Nada, Kobe 657-8501, Japan
a
Abstract. Disaster prevention and mitigation researches are essentially interdisciplinary and have to be practical. The ultimate objective of the researches is to protect lives and living spaces from natural hazards and their contents widely vary from scientific areas to social affairs; i.e. emergency disaster rescue and life-saving, evacuation, shelter, crisis management, damage estimation, victim care during recovery and reconstruction, resilient living infrastructure, industrial infrastructure, temporary housing and reconstruction residential development, disaster tolerant promotion, methods of volunteer support, disaster preparation, damage estimation, hazard maps, disaster prevention education and so forth. How can the linkage and cooperation be realized between them? How can they be made converge on the ultimate objective? Here, introduced is a trial made to achieve the interdisciplinary researches at the stage of the disaster prevention and mitigation COE at the Kobe University Research Center for Urban Safety and Security, which has been established through collaboration with AICS, JAMSTEC and E-Defense with cooperation from the Kobe City Office, the Hyogo Prefectural Government and Kobe Shimbun (newspaper publisher).
4
Mechanical Characterization of Cells Exposed to Mechanical Loading
Prof. Toshiro Ohashi1,a
1
Faculty of Engineering, Hokkaido University, Kita 13, Nishi 8, Kita-ku, Sapporo, Hokkaido 0608628, Japan
a
5
Analyses of Mobile Positioning Data
Robert Bestak1,a
1
Departement of Telecommunication Engineering, Faculty of Engineering, Czech Technical University in Prague, 166 27 Praha 6, Technická 2, Czech Republic
a
Abstract. Progress in the field of information sources, their digitization, visualization and analytical data extraction makes possible to enhance data about society behavior, demographic characteristics, etc. Mobile devices apart from their main purpose to support and provide various applications to their users also in
parallel generate a big amount of signaling data that reflect the devices’ usage and movement in a network. Due to high penetration and massive usage of mobile devices, these devices become then a unique source of information describing the behavior of users in space and in time. Positioning data allows data owners (mobile operates) to develop and to provide new innovative services that can be used in decision-making processes. In this talk, we will discuss how mobile users can be classified and mapped into an area of interest based on mobile positioning data. Furthermore, a utilization of such data to detect people traveling in public transport like busses and trains, and to determine where people get on and get off will be outlined.
6
Chapter
1
The Utilization of Sorghum Rod Powder as Filler to Enchance Mechanical
Strength In Bioplastics Synthesis
Yuli Darni1,a, Darmansyah1, Lia lismeri1, Binur1
1
Departement of Chemical Engineering, University of Lampung, Bandar Lampung-35145, Indonesia
Abstract. This research aimed to utilize sorghum as a filler rod using variations of sorghum starch-chitosan formulations-filler with 10 wt% glycerol as a plasticizer. The physical and mechanical characteristics of bioplastics then analyzed by using Low Density Polyethylene (LDPE) as a reference. Variation of sorghum starch-chitosan formulations used were 10:0, 9.5:0.5, 8.5:1.5, 7.5:2.5, 6.5:3.5 and 5.5:4.5 (w/w), variations of the addition of sorghum stem powder filler were 0.25:0.5:1 g with gelatinization temperature on 95 , stirring speed of 375 rpm and temperature drying in an oven was 60 for 11 hours. Starch granule was sieved in 63 micron and stirred for 35 minutes. The best conditions obtained by variation of formulation starch: chitosan 7.5:2.5 (g/g) with 0.25 g filler addition and best tensile strength test was13.9957 Kpa.
Keywords: bioplastic, filler, glycerol, modulus young, sorghum starch
I. Introduction
Bioplastic made from starch still has a low mechanical strength properties. When starch was combined with a filler, it will form a biocomposite, and will affect the properties of the composites formed [1]. The addition of filler from cassava powder was intended to produce the strengthen film and able to fill the air bubbles appear in the film [2].The filler would increase the mechanical strength of the starch. Rod sorghum is one of the materials that can be used as a filler which has a composition of sucrose (10 to 14.40% sorghum liquor), sugar reduction (0.75 to 1.35% sorghum liquor) and starch (209-1764 ppm [3]. Except the starch and the amplifier, glycerol was needed as a plasticizer which can increase the flexibility of bio-composites and produce bioplastic with optimal mechanical properties, morphology and biodegradability.
II. Materials and methods
A. Materials
The materials used in this research include: Sorghum flour, sorghum rod powder, Chitosan, Glycerol, distilled water, acetic acid. Analytical equipment used: Universal Testing Machine, digital calipers, and Fourier transform infrared spectroscopy (FTIR) brand Shimadzu 8400 to identify function groups.
B. Methods
7
While the addition of sorghum rod powder filler variation were 0.25, 0.5 and 1 (g). the speed of stirring used was 375 rpm. Glycerol concentration was 10% of the total dry weight from 10 grams of starch and chitosan, where the mixing stirring time was 35 minutes. After the stirring and mixing then followed by drying in an oven at 60 for 11 hours. The particle size of starch granules and sorghum rod powder filler used was 63 micron
sieve escaped.
1) Preparation of sorghum starch
First sorghum washed and drained. After that sorghum dried in the sun until its gain constant weight. Then it was grinded with a soybeans grinding machine to become a sorghum flour. Afterwards dried sorghum flour back with the oven until its weight was constant. The dried sorghum flour was sifted with 63 micron sieve size and packaged in plastic bags to prevent any fungus or lice.
2) Preparation of sorghum rod powder
At first, sorghum rod was heated on the sun so that the water content of sorghum rod constant. Later, chopped the sorghum rod then grinded with grinder machine [5]. After becoming powder, then sieved with a 63 micron sieve size and packaged in plastic bags to prevent any fungus or lice.
3) Synthesis of bioplastics
Step for synthesis of bioplastics in this research follow the method from Weiping Ban [4] as follows: a mass of starch and chitosan with a ratio of 7.5: 2.5 (g/g) and the addition of fillers with a variation of 0.25 grams weighed using digital scales. Starch solution and chitosan solution made by adding distilled water in accordance with the amount of volume that has been calculated on a separate measuring cup. Hot Plate was turned on and
set the temperature at 60oC, sorghum solution in a 500 ml measuring cup was placed inside the hot plate, then
chitosan solution was added to sorghum solution, and sorghum rod powder filler. After the hot plate was turned on, heat starch sorghum-chitosan solution mixture in hot plate for 35 minutes, after that added glycerol to starch sorghum-chitosan solution. Afterwards, bioplastics solution lifted and moved to the top of hot plate.
Temperature and speed of hot plate set according to which will be used, it is on the T gelatination = 95 and
the speed = 375 rpm. Then a magnetic stirrer was inserted into the solution and the hot plate was turned on.
During stirring and heating the mixture, mixing temperature should be controlled at 95 . After 35 minutes, the
hot plate was turned off, a measuring cup containing the solution was removed from the hot plate, and then the solution was ignored a minute until reach the room temperature. Solution of 25 ml was poured into the mold,
then placed it into an oven for drying at 60oC for 11 hours. After drying in oven, the mold was removed and put
into a desiccator (conditioned for 24 hours), after that, the plastic was released from the mold and stored in a zip lock bag, and plastic was ready to analyze. These steps were repeated for variations of comparison mass (g/g) sorghum starch to chitosan were 10: 0, 9.5: 0.5, 8.5: 1.5, 6.5: 3.5, 5.5: 4.5.
4) Mechanical properties analysis
Characteristics of the mechanical properties of a material was influenced by many factors, one of them was the ratio of starch-cellulose. Shown by the difference in the value of tensile strength, percent elongation, and Young's modulus which is diverge in every bioplastics. Sample of plastic film was tested by using Universal Testing Machine (UTM) INSTRON. The test was carried out by the standard of ASTM D 882-97 [6] and also
test was executed at 23oC, 50% humidity, and the cross head speed was 20 mm.min-1.
5) Water absorption analysis
8
6). Density analysis
By using a digital balance, weigh a mass, m (g) sample which will be tested. Then fill 5 ml of water and weighed sample into 10 ml measuring cup. After 15 minutes, note the new water volume (v). The actual plastic volume calculated by the difference between the final volume of water and its initial. Analysis of Function Groups by FTIR, samples iwas cut into small piece and crushed together with KBr until smooth to form pellets.
III. Results and Discussion
A. Result
Fig. 1. Shows the best results of bioplastic films which have physical and mechanical properties resemble wih conventional plastics LDPE (Low Density Polyethylene). The differences of structure, color, and level of mechanical strength on a sheet of bioplastics due to various factors, including the addition of a different filler ratio and imperfect stirring. The best conditions was obtained in starch: chitosan: filler formulation variations was 7.5: 2.5: 0.25 (g/g).
The test results of mechanical properties of bioplastics was shown in Table 1. Ratio starch-chitosan affects the characteristics of the bioplastic films, such as mechanical properties, physical properties, and biodegradability, so these need tests, and it aimed to get optimum conditions in the synthesis of bioplastics which resembles LDPE (Low Density Polyethylene). Testing of mechanical properties consist of tensile strength test, elongation, and Young's modulus. Testing of the physical properties consist of density test and solubility test, and other testing against bioplastic films such as FTIR.
Fig. 1. Bioplastic with ratio starch-chitosan-filler formulation7,5 : 2,5 : 0,25 (g/g).
Table 1. Result of Research Data Tabulation
Ratio of Starch: Chitosan: Filler
(g/g)
Water Absorption (%) ρ (g/mL) Tensile Strength (kPa) Elongation (%) Young’s Modulus (kPa)
10:0:0,25 11,11 0,389 0 0 0
9,5 : 0,5 :0,25 61,53 0,248 0,4675 11,75 3,97
8,5:1,5:0,25 79,61 0,468 4,4343 18,82 23,55
7,5:2,5:0,25 83,67 0,291 13,9957 10,8 129,36
6,5:3,5:0,25 89,33 0,254 11,4612 20,6 55,61
5,5:4,5:0,25 48,75 0,478 8,5285 8,59 99,26
9
B. Effect of starch-chitosan formulation and filler on mechanical properties of bioplastics
In Fig. 2, It can be seen the influence of the ratio of starch-chitosan-filler to the tensile strength bioplastic films. Tensile strength is one of the test to determine the maximum stress of a material. The highest tensile strength values in the variation of starch-chitosan formulations and filler at 7.5: 2.5: 0.25 (g/g) is 13.9957 Kpa.
It can be deduced that with the addition of chitosan will be able to increase the tensile strength values in the sample of bioplastics. This is based on that the more chitosan given so that the better affinity which causes the chemical bonds of bioplastics increasingly strong and difficult to cut because it requires large energy to break the bond [4].
There is also a factor that can affect the value of tensile strength of bioplastic sample, it is sorghum rod powder filler. In this research, the tensile strength is affected by the starch-chitosan formulations and filler. The strong intermolecular forces in chitosan makes it difficult to interact with other components.
Fig. 2. The relationship between variation of starch: chitosan (g/g) and tensile strength of bioplastic with filler 0,25; 0,5; 1 gr.
Besides the combination of chitosan to starch are limited because chitosan is difficult to spread (dispersed), so that in addition of a lot of chitosan to the bioplastics solution, the value of tensile strength decreased due to the stronger intermolecular forces in chitosan makes it difficult to interact with other components.
Bioplastics which are made does not have the standards of LDPE tensile strength values. Percent extension is part of the mechanical properties which indicates elasticity or tenacity of a material when it is pulled up to break. Fig. 3 shows the effect of chitosan concentration against strains or percent extension of bioplastic films.
Based on the image, there is the best value of percent extension in the formulation 7.5: 2.5: 0.25 (g/g) with a value is 10.8%. It can be concluded that there are many factors that affect the value of the percent extension of bioplastics sample. One of them is the addition of chitosan factor which is proportional to the percent extension of the bioplastics sample.
Fig. 3. The relationship between Variation of Starch : Chitosan (g/g) and strain of Bioplastic with filler 0,25; 0,5; 1 gr.
te
ns
ile
st
re
ght
(
Kpa)
starch - chitosan formulation (gr/gr) 0,25 gr
0,5 gr 1gr
St
rai
n
(%
)
10
Young's modulus is obtained from the ratio between the tensile strength toward the percent extension (elongation at break). Young's modulus is often said as the size of the stiffness of a material.
Based on the Fig.3, It can be seen that the highest value for the Young’s modulus is in the formulation of starch-chitosan-filler 7.5: 2.5: 0.25 (g/g) with a value is 129.36 kPa. Young's modulus values are vary greatly with the increase or decrease value by the formulation.
Fig. 4. The relationship between variation of starch: chitosan (g/g) and Young’s Modulus of bioplastic
with filler 0,25; 0,5; 1 gr.
C. Effect of starch-chitosan formulation and filler on Physical Properties of Bioplastics
The physical properties are properties that can be seen from the results and can change, for example, density,
viscosity, and others. Physical properties test aim to determine the
value of bioplastics solubility in water
and the density of the bioplastics sample which is produced.
Fig. 5. . The relationship between ratio of starch : chitosan (g/g) and filler on water absorption of bioplastics
Based on Fig. 5, it can be seen that the best conditions on the water resistance test is in the formulation of starch-chitosan-filler at 6.5: 3.5: 0.25 (g/g) obtained in value at 89.33%. While for the value of the water resistance test that produces some water absorption is on starch-chitosan-filler formulations at 10:0:0.25 (g/g) obtained a value at 11.11%.
It can be concluded that the factors causing the high quality value of bioplastics sample against water absorption caused by the components. Chitosan with its hydrophobic characteristic is capable to give a great influence because they do not like water so it can modify the starch by grafting process or transplanting chitosan molecules into the starch molecules so chitosan is able to reduce the starch because of the hydrophilic characteristic.
Therefore the more chitosan given so the strength of bioplastic sample for absorption value will increase. Besides the addition of filler in the fabrication of bioplastic sample formulations are also able to affect the strength of the samples in the water absorption. Value test of the water resistance will increase along with adding the filler. In other cases, the addition of filler does not always increase the value of water resistance of
m o du lus y o un g (Kpa)
starch - chitosan formulation (gr/gr) 0,25 gr 0,5 gr 1 gr w at er a b so rp tio n (% )
starch - chitosan formulation (gr/gr) 0,25 gr
11
bioplastic sample. There is also the fact that with the addition of filler then the value of the water resistance is reduced. It is based on other factors, for example in the process of drying in the oven, where sometimes there are technical problem that the death of the electrical energy from PLN’s channel. It has consequences in drying the bioplastics samples which are uneven so the initial sample weight will be different from other bioplastics sample.
Density (mass/volume) is the physical properties of a polymer. The more tightly a material, the better mechanical properties where the plastic film which is produced has a good tensile strength. This bioplastic density was determined using the increasing of fluid in the measuring cup. Effect of chitosan concentration on the density can be seen in Fig. 7.
Fig. 6. The relationship between variation of starch: chitosan (g/g) and filler on density of bioplastics
Based on Fig. 6, it can be seen that there are the best conditions obtained from a density test ofbioplastics sample. Best condition on the formulation of starch-chitosan-filler are 7.5:2.5:0.25 (g/g) with values obtained at 0.291 (g/ml). From the result is density test of a bioplastics sample can be concluded that there are various factors in influencing the density of a bioplastics sample. This is based on the more dense molecular structure of the material, it will be stronger.
D. Fourier Transfer Infra-Red (FTIR) analysis
Based on the results of functional groups bioplastic samples test at various ratios of starch-chitosan, obtained the information several peaks appear. The emergence of a lot of peak indicates that in bioplastics there are many types of functional groups. Based on IR spectra bioplastics formulation of starch-chitosan-filler 7.5:2.5:0.25
(g/g) there is also a hydroxyl group (-OH) on the absorption area from 3567.04 to 3446.79 cm-1, this group
shows the breaking point. There is a group (C-OH) the absorption area is at 1078.02 cm-1 and there is also a
amide group (C=0) the absorption area is from 1651.42 to 1561.43 cm-1. And to the lowest point at 779.63 cm-1
the absorption area is phenyl group. The difference lies in the lowest point that there are group (C-Cl) for the variation of 10:0: 0.25 and phenyl group for variation of 7.5: 2.5: 0.25.
Fig. 7. Bioplastic FTIR Spectrum with Ratio Starch-Chitosan-Filler 6,5 : 2,5 : 0,5 (g/g)
de
ns
it
y
(g
r/m
l)
starch - chitosan formulation (gr/gr) 0,25gr
12
IV. Conclusions
Characteristic of bioplastic that have resembled with LDPE is obtained on the starch: chitosan formulation variations 7,5 : 2,5 (g/g) with the addition of 0,25 g filler. The best tensile strength as mechanical strength characteristic of bioplastic film is 13,9957 Kpa.
List of Notation
Sym. Definition Unit
τ Tensile Strength MPa
Fmax Maximum Strain N
A Wide of Surface (mm2)
ε Percent Elongation %
L1 Length of Bio Film mm
L0 Initial Length Film mm
σ Tensile Strength MPa
W Sample Weight G
W0 Int. Sample Weight G
ρ Density g/ml
m Sample Mass g
v Volume ml
Acknowledgments
On this occasion, the authors would like to acknowledge the Head of Mathematics and Sciences Laboratory in University of Lampung for all the facilities support that had been given to complete this research. The authors also would like acknowledge all people who have helped in completion of this research.
References
[1]. Bayandori,M.A., Badraghi,T.N., & Kazemzad, (2009). Synthesis of ZnO nanoparticles and
elecrodeposition of polyrole/ZnO nanocomposite film. Int J Electrochem Sci, 4, 247-257.
[2]. Yusmarlela. (2009). Studi Pemanfaatan Plastisiser Gliserol Dalam Filler PatiUbi Dengan Pengisi
Serbuk Batang Universitas Sumatera Utara Medan,Thesis Master.
[3].
Suarni. 2004.
Evaluasi Sifat Fisik dan Kandungan Kimia Biji Sorgum Setelah Penyosohan.
Jurnal Stigma xii(1): 88-91.
[4]. Ban, Weiping, Song, Jianguo, Dimitris S. Argyropoulos, Lucianus A. Lucia. (2006). Improving The
Physical and Chemical Functionally of Starch – Journal of Applied Polymer Science 2006 Vol. 100. P 2542-2548, Published online in Wiley www.interscience.wiley.com United States.
[5]. B2PT-BPPT. (2011). Proses Powdering Batang Sorgum. Negara Bumi Ilir, Anak Tuha. Lampung
Tengah. Lampung
[6]. ASTM D882-97, Standard Test Method for Tensile Properties of Thin Plastic Sheeting.
13
Chapter
2
Radiometric Correlation to Sulphur and Iron Content at BM-179 Kalan-West
Kalimantan Uranium Ore
Rachmat Sahputra1,a
1Department of Mathematics and Science Education, Tanjungpura University
Ahmad Yani Street in Pontianak, Indonesia
Abstract.The research aims to determine the correlation radiometeric against sulphur and iron content and its association with uranium content of BM-179-Kalan-West Kalimantan’s uranium ore. The sample selection method using a ROS tool–NF-SPP; enrichment of sulfide minerals using flotation preparation; Iron content determination using with AAS-Spectr-AA-20(λ=248.3 nm) analysis; uranium content through spectral uranyl-Br-PADAP (λ=574 nm) analysis; sulphur content determined by ESCHKA modification method. Results of the study is a linear correlation between the radiometric uranium content to follow the equation
y1=3,5408x+1867.3; sulphur content decreased with radiometric increasing with the equation y1
=-0,8345x+18926; iron content decrease to radiometric increase with the equation y2=-1,351x+31261. Increased
sulphur content followed by iron content increase with trendline y1 = 1,3175x2 + 5601. The results can be found
that the ore will have a high uranium content with a minimum sulphur content in radiometric ≥ 4000 cps, and a high uranium content with a minimum iron content at radiometric ≥ 6000 cps.
Keywords: BM-179-Kalan uranium ore, ESCHKA, radiometric correlation, iron, sulphur.
I.
Introduction
BM-179 uranium ore is an ore sampel from the tunnel at a depth of 179 meters that are in Kalan, Ela Sub-district, Melawi District, West Kalimantan Province. The ore is precisely located in the hill Eko-remaja sector. To reach this location can be reached by air or land as far as ± 500 km to the East from Pontianak to Nanga Pinoh City, followed by ground vehicle through the timber company road along ± 70 km to the south.
Uranium ore from the Eko-Remaja-Kalan sector is still not used by the Indonesian government for various purposes related to energy, whereas in this sector have a high enough uranium reserves with a reserve of about
more than 12409 tonnes of U3O8 [17].
BATAN has made exploration tunnel along the 618 meters at the Eko-remaja sector for the purposes of research and development of nuclear energy. BATAN has succeeded in processing BM-179 ores becomes "yellow cake"
(U3O8) at various stages of processing, starting from the physical preparation, leaching, solid-liquid separation,
purification and precipitation.
14
Research related to the physical chemistry characteristics of the transition and sulfide elements present in the BM-179 Kalan-West Kalimantan uranium ore has not been widely known and yet to be published. Therefore, this study was intended to determine the radiometric correlation against sulphur and iron content and its relevance to the content of uranium in BM-179 Kalan-West Kalimantan uranium ore.
By knowing the correlation between the elements content present in the BM-179 Kalan uranium ore, the next benefit of the data results obtained can be used to assist decision-making related to uranium exploration in Kalan-West Kalimantan and streamline all phases of exploration and exploitation activities in the future.
Implementation of this study to analyze and find correlation to the content of potential elements such as uranium, iron and sulfide through ROS (radiometric ore sorting) on BM-179 Eko-remaja Kalan West Kalimantan uranium ore.
The method used for the sample selection used ROS (radiometric ore sorting) by means of SPP-NF, for the enrichment of sulphide mineral conducted with flotation preparation method, to determine the iron element content is analyzed by atomic absorption spectroscpy (AAS) method, and to observe the uranium content used spectrophotometers, as well as for the sulphur content determination is used gravimetric method.
II.
Procedure
2.1. Equipment and material experiment
The equipment used is a furnace, metal / glass pipe / heat-resistant rubber, condenser, thermometer, oven, ph-meters, glassware (test tube, beaker Glass, measuring cup, erlenmeyer, pipette, etc.), heater, grandsaw, jaw crusher, disk milk, mortar grinder, -65 mesh sieve, flotation apparatus, goach cup, spectrophotometers, AAS.
Materials used are examples of BM-179-Eko remaja-Kalan uranium ore, oxygen gas, pure sulphur, litmus paper, Whatman filter paper # 42, ascorbic acid, triethanolamine, ethyl xantat 10%, NKY-SNB, fine oil , coarse
filter paper, asbestos, methyl isobutyl ketone, HNO3, concentrated sulphuric acid, TOPO, Fe2 (SO4)3, U3O8 and
H2O2, amyl xanthat, Na2CO3, ZnO, BaCl2 10%, 2,5N KOH, HNO3 (6: 1), HF concentrated, universal litmus
paper, alcohol, 2.5 N HNO3, ascorbic acid 5%, 2% NaF, Br-Padap 0.05%, concentrated HClO4, HCl (1: 1), the
standard elements of the brand Titrisol (U, Fe), asetilene.
1) Flotation preparation: A total of 500 grams of BM-179 ore with mesh size 65, added water to produce
pulp percent solid 30%, included in the German Wedag flotation tool using rpm 1400. Pulp stirred while at pH 8 with 10% sodium carbonate. Furthermore added promother xanthat reagent much as 0.15 mL Ana amyl and fronther pine oil as much as 0.05 mL and left stirred for 5 minutes. Float concentrate separated carefully at the reservoir. The time of separation is done 10 minutes. Furthermore, the concentrate was filtered, the solids are heated in an oven and weighed and analyzed further.
2) Sample Preparation: A sample is analyzed are BM-179 ores with radiometric <150 cps, 150-500 cps,
500-1000 cps, 1500-3000 cps, 3000-5000 cps, and 5000-15000 cps. Examples with each radiometric weighed as
much as 1 gram, put in a Teflon beaker, added 12 mL HNO3 for 30 minutes (do not boil) with a hot plate on
200oC temperature, left 5 minutes, the solution was removed, added another 12 mL HF concentrated and 4 mL
HClO4 concentrated, evaporated to dryness. The solution was removed and allowed to cool, added another 4
mL HClO4 concentrated, heated to dry. Furthermore, the temperature is lowered to approximately 100 °C and
added 4 ml of HCl (1: 1) and 10 mL distilled water, heated on a hot plate until solved. The solution was put in a 100 mL volumetric flask is diluted with distilled water, pipette 1 ml is inserted in a flask of 100 ml from 100
mL sample solution, added 2 ml HCl concentrated, added 10 mL 10% CsCl2, diluted with distilled water to
15
2.2. Iron analysis using an atomic absorption spectroscpy
1) Preparation of standard solution: Fe standard solution is made of standard elements Titrisol brands.
Standard Fe dissolved in 1000 mL volumetric flask with distilled water.
2) Analysis of iron: Created standar solution series in 0; 0.5; 1; 2; and 5 ppm of iron standard solution
parent, measured by AAS Varian Spectr AA-20 Plus using Fe lamp
56-100027-00 No.JT574 series, photomultiflier 421.8 volts, the wavelength of 248.3 nm, slit width of 0.2 nm , flate-asetilene air, asitilene flow of 1.5 L / min with a flame oxidation.
2.3. Product Specification and Controls
1) Preparation of solution: (a) TOPO weighed 19.28 grams of TOPO dissolved in Cyclohexane, diluted to
1 liter, so get 0.05 M TOPO solution; (b) 5% solution of ascorbic acid; (c) Complex solution I: 25 grams titriplex IV, 5 grams NaF and 65 grams sulfosalicilat acid dissolved in 800 ml of distilled water while stirring. Added NaOH solution is added gradually until pH = 8.35, then the solution is diluted to 1000 ml with aquadees; (d) Solution Complex II. One part of complex solution diluted with one part distilled water, then the pH is set to be 8.35 with 40% NaOH; (e) buffer solution pH=8.35: as much as 149 grams (134.04 ml) of triethanolamine
dissolved in 800 ml of distilled water, neutralized with HClO4 to pH 8.35 and kept overnight, next day pH was
adjusted back to 8.35 with HClO4, diluted with distilled water to 1 liter; (f) Br-Padap 0.05%: Br-Padap 0.5
grams dissolved in one liter of alcohol.
2) Analysis of Uranium: (a) Weighed 2 g sample of ore that has been finely ground, put in a teflon beaker.
Added 30 ml HClO4 + HNO3 (6: 1), and concentrated HF. The solution was slowly heated on a hot plate for 1
hour while closed. Then dried at temperature 250 °C to form a paste. Paste dissolved with 2.5 N HNO3, put in a
50 mL volumetric flask; (b) 1 mL pipette inserted into the shake flask, added 2 mL 5% ascorbic acid, 2 mL 2% NaF and 5 mL of 0.05 N TOPO. The mixture was shaken for 2 minutes, then allowed 5 minutes to separate the organic phase from the aqueous phase well; (c) pipette 2 ml of the organic phase, put in a 25 mL volumetric flask, then added 1 ml solution of complex II, 1 ml of buffer solution pH 8.35, and 2 ml of Br-Padap 0.05%. At each addition of the reagent, the solution was shaken well. After 10 minutes, added alcohol so that the solution exactly 25 mL. Uranyl spectrum-Br-Padap measured with a spectrophotometer at a wavelength of 574 nm, blank worked as an example.
2.4. Sulphur Determination by the modification ESCHKA method
Weighed 1 g sintering reactant (a mixture of Na2CO3 and ZnO ratio of 3: 2) inserted into an empty porcelain
cup. Weighed 2 g ore sample was mixed with 15 g of sintering reagent, then insert it into the cup that has been filled sintering reagent. Added another 2 g of a mixture of sintering sprinkled on the sample in the cup.. The cup is closed, then heated in a furnace at a temperature 800 ° C for 2 hours. Once cool, put in a glass beaker containing distilled water approximately 200 mL and then heated to boiling approximately 10 minutes. The solution is filtered, the residue washed with hot water several times so that the volume of approximately 400
mL. Filtrate added with concentrated HCl dropwise until the CO2 depleted, then added HCl excess. The solution
is heated to approximately 350 mL. Added 15 mL of 10% BaCl2 while stirring to form a precipitate, sediment
16
III.
Equations
Absorbance was measured using Atomic Absorption Spectroscopy using the equation:
A = -log T (1)
Where
A = Absorbance T = Transmission
Beer's law states that the absorbance is directly proportional to the thick solution
− ∫IoI dII = ∫0ndSS (2)
Where
I = Reduction intensity
S = cross-sectional area that absorbs particles
Absorptivity and molar absorptivity measured by the equation:
A =*b.*c (3)
Where:
A = Absorbance
= constant absorption
b = bold solution
c = concentration of the solution
In the settlement equation using non-homogeneous linear equation:
a1x1 + ... +akxk = b (4)
With a1, ... , ak value of R, to be able to determine menentukan x1, ... , xk with values of R, and, if present, will give an answer. The results are obtained if b belongs to the ideal value generated by a1.
Sulphur content can be obtained from the determination of the weight of BaSO4 prior with ESCHKA
modification method, further calculations are:
Contents of (SO4)2- (in %) = [((SO4)2- / BaSO4) x Weight BaSO4 x 100%] / Heavy example.
Contents of S (in %) = [Weight Atom S / Molecular Weight (SO4)2-] x % (SO4)2- (5)
IV.
Results and Discussion
17
The results showed that the higher the radiometric of BM-179 Kalan ore have greater uranium content, while the sulphur and iron content showed that the higher the radiometric BM-179 ore containing lower sulphur and iron content.
Such correlations can be presented in Figure 1 where the x-axis is the uranium content and the y-axis is the sulphur and Iron content.
Fig 1. Graph uranium content of the sulphur and iron in BM-179 Kalan-West Kalimantan uranium ore
Figure 1 shows that the rise in uranium content will be followed by a decrease in sulphur and iron with trendline
follow linear line equation y1 = -0,3918x + 32098, where y1zz is the iron content and x is uranium content with
a constant of iron content is 32098 ppm, whereas for the content sulphur follow trendline follow linear line
equation y2 = -0,2508x + 17328, where y2 is sulphur and x is uranium content with the constant of sulphur
content is 19549 ppm.
Correlation between sulphur and iron content in BM-179 Kalan West Kalimantan uranium ore show the relationship is directly proportional, meaning that the higher sulphur content and the higher the iron content contained in the ore. The relationship between sulphur and iron can be presented as Figure 2.
Fig 2. The sulphur content correlation of the iron content in the BM-179 Kalan West Kalimantan uranium ore
y = -0,2508x + 19549 y = -0,3918x + 32098
-10000 0 10000 20000 30000 40000 50000
C o nt ent o f Sul fur an d Ir o n( pp m ) Uranium (ppm) Sulfur (ppm) Iron (ppm) Linear (Sulfur (ppm)) Linear (Iron (ppm))
y = 1,3175x + 5601
0 5000 10000 15000 20000 25000 30000 35000 40000 45000 50000
0 5000 10000 15000 20000 25000 30000
18
Figure 2 shows that the higher sulphur content will be followed by an increase in iron content by following the
trendline linear line equation follows y1 = 1,3175x2 + 5601, where y1 is the iron content and x2 is the sulphur
content, with constant of iron concentration is 5601 ppm.
The linear equation indicates that, in the BM-179 Kalan West Kalimantan uranium ore has a tendency relationship between the sulphur and iron content is the iron content has 1.3175 times larger than the content of sulphur. This indication may give the hypothesis that the BM-179 uranium ore has an iron compound which is quite high. There are many possibilities existing iron compounds, in addition to combining with sulphur to form
pyrite and iron (II) sulfide, can also form oxides in the form of hematite, limonite and magnetite, or to form carbonate compounds such as siderite, but it can form compounds such as silicates like taconit. Existing sulphur compounds can also be fused with uranium to form uranyl disulfide.
Radiometric relations with uranium content, sulphur and iron can be presented as Figure 3 below.
Figure 3. Graph relations of radiometric (cps) with a content of uranium, with sulphur and iron, and with sulphur and uranium.
Figure 3 shows that the content of uranium radiometric direct proportion to the equation y = 3,5408x + 1867.3, where y is the content of uranium and x is large radiometric, the higher radiometric information will be higher levels of uranium. Sulphur content follows the equation y=-0,8345x + 18926 against radiometric number, the higher radiometric provide information that will be even lower sulphur content. And Iron content to follow the equation y = -1,351x + 31 261 to the number of radiometric, meaning that the higher radiometric provide more information to low iron content. Figure 3 also provides information that intercept uranium and sulphur content shown on radiometric 4000 cps, so as to obtain a high uranium content in BM-179 Kalan West Kalimantan ores to minimize sulphur is at radiometric greater than or equal to 4000 cps. Intercept between uranium and iron content shown on radiometric 6000 cps, so as to obtain a high uranium content in the BM-179 Kalan West Kalimantan ore with an iron lies in the radiometric far greater than or equal to 6000 cps.
Please refer to the equations, tables and figures are as follows: (1) Equation (1), an excerpt made in accordance reference [1]; (2) Equation (2), an excerpt made in accordance references [2] - [4]; (3) Equation (3), an excerpt made in accordance reference [4] - [7]; (4) Equation (4), quotations in accordance with references [8]; (5) Equation (5), an excerpt made in accordance with references [1]; (6) Figure 1, Figure 2 and Figure 3, an excerpt made in accordance reference [8] - [17]; and (7) Table 1, an excerpt made in accordance references: [1] - [11].
y = 3,5408x + 1867,3
y = -0,8345x + 18926 y = -1,351x + 31261
0 5000 10000 15000 20000 25000 30000 35000 40000 45000
0 2000 4000 6000 8000 10000 12000
19
V.
Conclussion
The higher radiometric of BM-179 Kalan West Kalimantan uranium ore showed increased levels of uranium, therefore radiometric of BM-179 is directly proportional to the uranium content follows the equation y = 3,5408x + 1867.3, where y is the content of uranium and x is large radiometric.
The lower the sulphur content with increasing radiometric follow the equation y = -0,8345x + 18926. The iron content reduction of the radiometric will follow the equation y=-1,351x + 31261. The higher sulphur will be
followed by an increase in iron content by following linear trendline equation y1 = 1,3175x2 + 5601, where y1 is
the iron content and x2 is the content of sulphur, with constant iron content is 5601 ppm.
High uranium content in BM-179 Kalan West Kalimantan ores with to minimize sulphur is at radiometric greater than or equal to 4000 cps, high uranium content to minimize iron can be obtained at radiometric greater than or equal to 6000 cps.
Apendix
Appendix of results radiometric data of the analysis correlation with uranium, sulphur and iron content in bm-179 kalan west kalimantan uranium ore
The elements are analyzed in this study are the elements that are considered potential of major mineral include: sulfur, iron and uranium. Data analysis has been done may look like Table 1. Appendix A.
Table 1. Appendix A. The results of radiometric data and the uranium content, sulphur and iron in BM-179 Kalan-West Kalimantan ore
No
Central point Radiometric (cps)
Uranium (ppm)
Sulphur (ppm)
Besi (ppm)
1 75 470 23452 40309,6
2 225 1421 19648 24374,6
3 750 4919 12373 26413,7
4 2250 10595 18781 31552,3
5 4000 19213 13413 23055,7
6 10000 35842 11450 18489,2
References
[1]. Douglas A. Skoog; Donald M. West; F. James Holler; Stanley R. Crouch, “Fundamentals of
Analytical Chemistry”, 8th Ed, 2003
[2]. Dean Calloway, “Beer-Lambert Law”, J. Chem. Educ., 1997, 74 (7), p 744.
[3]. Herman A. Liebhafsky and Heinz G. Pfeiffer; “ Beer's law in analytical chemistry”, J. Chem.
Educ., 1953, 30 (9), p 450
[4]. D. F. Swinehart, “ The Beer-Lambert Law”, J. Chem. Educ., 1962, 39 (7), p 333
[5]. Ingle, J. D. J.; Crouch, S. R.,” Spectrochemical Analysis”. New Jersey: Prentice Hall, 1988.
[6]. L. Liua and I. Neretnieksa, “Sensitivity Analysis of Uranium Solubility Under Strongly Oxidizing
20
[7]. Owen T. Butler,; Warren R. L. Cairns; Jennifer M. Cook and Christine M. Davidson, “2014
Atomic Spectrometry Update – A Review Of Advances In Environmental Analysis”, Journal Anal. At. Spectrom., 2015.
[8]. Geoffrey R. Loftus,; Martin A. Oberg,; and Allyss M. Dillon, “Linear Theory, Dimensional
Theory, and the Face-Inversion Effect”, Psychological Review by the American Psychological Association, Vol. 111 (4), p.835- 863, University of Washington, 2004
[9]. Gribble,C.D., “Rutley’s Elements of Mineralogy”, 27-th Edition, London:Unwin Hyman, 1988.
[10]. John Emsley, “Nature’s Building Blocks: An A-Z Guide to the Elements”, 2nd Edition, New
York: Oxford University Press, 2011.
[11]. Klein, Cornelis and Cornelius S. Hurlbut, Jr., “Manual of Mineralogy”, 20th ed., Wiley, 1985. pp.
307–308 ISBN 0-471-80580-7
[12]. Burns, P.C., and Finch, R, “Reviews in Mineralogy, Uranium: Mineralogy, Geochemistry and the
Environment.”, Mineralogical Society of America, Vol. 38, U.S.A.:Washington D.C., 1999, ISBN 0-939950-50-2
[13]. Anthony, John W.; Bideaux, Richard A.; Bladh, Kenneth W. and Nichols, Monte C. (ed.).
"Uraninite, Handbook of Mineralogy”, Mineralogical Society of America, US: Chantilly, VA, 2011, ISBN 0-9622097-2-4.
[14]. Affandi, K.; Susilaningtyas; Tjokrokardono, S. dan Sastratenaya, A.S., “Laporan Internal Bidang
Pengembangan Teknologi PPBGN: Status Pengolahan Bijih Uranium Eko remaja Kalan”, Jakarta: BATAN, 2001.
[15]. Rifrandiyah, E.; Pudjianto R., “Laporaan Hasil Penelitian BATAN 1992/1993: Penentuan Kondisi
Optimal Pelindihan Bijih Uraium Tipe BM-179 (TS-IV)”. Jakarta: BATAN, 1993.
[16]. Affandi, K., “Scientis Exchange Program 1992/1993: Pretreatment and extraction of Uranium
from Refractory Uranium Minerals”, Japan: PNC, Ningyo Toge Works, 1993.
[17]. Tjokrokardono, S., “Prospek Pengembangan Cebakan Uranium di Kalan, Kalimantan”, Jurnal
21
Chapter
3
Masterplan Road Network in the Border Region of Nunukan Regency of the North
Kalimantan Province
Citra Anggita1,a, Triana Sharly Permaisuri Arifin2,b, Donny Dhonanto3,c
1
Regional and City Planning, Faculty of Engineering, Mulawarman University 2
Systems and Transportation Engineering, Mulawarman University 3
Lab. Cartography and GIS, Faculty of Agriculture, Mulawarman University a
[email protected], [email protected], [email protected]
Abstract. The formation of the North Kalimantan Province especially Nunukan Regency, as one of the efforts in organizing the regional solutions in order to optimize the public service because it can shorten the span of control of the Government, making it more efficient and effective. Based on this, the need for adequate of traffic infrastructure andfacilities are necessary. The infrastructure and facilities in the form of network access roads and bridges in the whole transport system. Road and bridge infrastructure are essential for the realization of national development activities that support the development of production and services. It also support the development of a region to realize the harmony of region growth, urban and rural holistically organized, environmentally sustainable, and empower communities.
Keywords: Master Plan, Roads, Bridges, Nunukan, North Kalimantan
I.
Introduction
Transportation is fundamental to economic development and the development of society and the growth of industrialization. With the transportation led to specialization or division of labor according to the expertise in accordance with the culture, customs and culture of a nation or the region. Where the road network is an important tool in the implementation of the transport. In line with the growth and development, then a region will not be separated from the presence of the transport sector which is the main supporter of the movement of people and goods, so the need for transport will be increased. The transport sector is the most important sector in the life of society and become the backbone of a country's economy in general.
One of the key elements in implementing transportation is the availability of good road network infrastructure and meet the development of the movement of people and goods, in particular in the province of North
Kalimantan. The North Kalimantan province with an area of whole ± 75.467.70 km2 and a total population of
approximately 622.350 inhabitants has a network of road infrastructure that hasn't been fullest in optimizing public services especially in rural and border areas. Coupled with the general condition of the economy of Indonesia in the border region, among others, as follows:
a. Relatively isolated location (remote) with a low level of accessibility
b. Low levels of education and public health
c. The low level of socio-economic welfare of society border area (the number of poor and underdeveloped
villages)
22
Condition of the territoryNorth Kalimantan Province is divided into five administrative regions consist of 1 (one) and 4 (four) districts, which are: Tarakan City, Bulungan Regency, Malinau Regency, Nunukan Regency, and Tana Tidung Regency originally was part of the province of East Kalimantan. Tanjung Selor is the capital city of North Kalimantan Province.
The formation of the province aims to encourage increased services in the areas of governance, development, community, as well as shortening the span of control in the Government especially in the area of the northern border. Expected also in the presence Of North Kalimantan Province can improve the economy of the North Kalimantan residents residing near the borders with neighbouring countries.
Geographically the province borders the countries of North Kalimantan Province Malaysia Sabah (North); West Kutai Regency, East Kutai, Kutai Kartanegara, and Berau (South); The Celebes Sea (East); and some parts of Borneo Malaysia Country Part (West). The area is also located in national and international cruise lines (Indonesia Islands/Sea Groove Archipelagic Sealand Passage) and exit (outlet) to the Asia-Pacific region. In geostrategic, North Kalimantan Provinve was the open gates to Malaysia (Sabah), Southern Philippines, and Brunei Darussalam.
At the time of Regional Expansion on 25 October 2012 by Regulation No. 20/2012, North Kalimantan Province has 38 subdistrictscomprising :
1) Tarakan City (4 sub-districts)
2) Malinau Regency (12 sub-districts)
3) Bulungan Regency (10 sub-districts)
4) Tana Tidung Regency (3 sub-districts)
5) Nunukan Regency (9 sub-districts)
During the period of ±1 (one) year until October 2013, the number of sub-districts undergoing expansion to 47 sub-districts, consisting of:
1) Tarakan City (4 sub-districts)
2) Malinau Regency (15 sub-districts)
3) Bulungan Regency (10 sub-districts)
4) TanaTidung Regency (3 sub-districts)
5) Nunukan Regency (15 sub-districts)
The North Kalimantan province has 2 (two) sub-districts bordering neighboring countries, North of Sabah (Malaysia) to the West, some parts of Borneo (Malaysia). The North Kalimantan area on 2 (two) of border districts namely 56.884,38 km2 comprises the area of the Malinau Regency 42.620,70 km2, and Nunukan Regency with a land area of 14.263,68 km2. Border area of Malinau 26.875, 03 km2 or 63,05% of the Malinau
Regency, and the broad border area of Nunukan 10.928,78 km2 or 76,61% of the area of Nunukan Regency.
Profile of Border Area of Nunukan Sub-district
Nunukan Regency is part of the province of North Borneo Province, along with the expansion of the new province of East Kalimantan province. Nunukan Regency is located in the capital city of Nunukan. The County
23
Table 1. Total area, number of villages and the capital per sub-district in Nunukan Regency
Sub-districts Unit Total Area Number of Villages Capital
Krayan km2 1.834,74 65 Long Bawan
Krayan Selatan km2 1.757,66 24 Long Layu
Lumbis km2 290,23 28 Mansalong
LumbisOgong km2 3.357,01 49 Samunti
Sembakung km2 2.042,66 20 Atap
Nunukan km2 564,50 5 Nunukan Barat
SeiMenggaris km2 850,48 4 Sri Nanti
Nunukan Selatan km2 181,77 4 Mansapa
Sebuku km2 1.608,48 10 Pembeliangan
TulinOnsoi km2 1.513,36 12 Sekikilan
Sebatik km2 51,07 4 TanjungKarang
SebatikTimur km2 39,17 4 SeiNyamuk
Sebatik Tengah km2 47,71 4 AjiKuning
Sebatik Utara km2 15,39 3 SeiPancang
Sebatik Barat km2 93,27 4 Binalawan
Source: BPS Nunukan Regency
II.
Methodology
Road-handling activities are categorized in three types of programs, namely :
a. Programme of rehabilitation and maintenance of roads and bridges
b. Programme of building roads and bridges
c. Road and Bridge Improvement Program
The data is used, collected directly from primary or secondary field either through surveys and observations. Some of the activities of the survey conducted in the field include:
a. An inventory survey of the road network. Intended to provide a framework for priority handling and
maintenance to carry out a systematic survey of the entire road network.
b. Review the previous programs. Before doing a detailed study will be conducted centrally and
redenomination of program development and improvement of roads and bridges that have been done in previous years.
c. The collection of the Data sources. The majority of secondary data which is to be obtained from the
Engineering Department of public works, the local Departments. Such data include the following :
1) Spatial Plan area of North Kalimantan Province (RTRW Kalimantn Utara)
2) Medium-term development plan of the North Kalimantan Province (RPJMD Kalimantan Utara)
3) Master plan of the border regions of North Kalimantan Province
4) Previous researchs and studies
5) National Agency for Border Management (BNPP)
6) Government regulations related to the border
7) Road network inventory data
24
d. Preparation of Base Maps
The main purpose of this category is to correct the map base of the existing road network. These activities are required to photocopy the study area topographic map 1: 50.000 scale whenever possible. If topographic maps 1: 50.000 scale could not be retrieved will be used in a map with a smaller scale or a map of land use but can still be used for the determination of the location of his physical condition precisely, such as the great river, wide and most settlements are not part of the networks are still the same. Improvements and additions to the data can be done during the field surveys and the results will be redrawn on the appropriate scale.
e. Framework of the Population Data
It takes an estimated population served the standards proposed to determine the value of benefits if the roads will be improved from the condition cannot be traversed by vehicles or bad road conditions where vehicular traffic is very low, the road was upgraded into vehicle navigable throughout the year. This activity required to perform topographic maps 1: 50.000 scale indicating the names and approximate boundaries of each village/town sejajarnya with the path to the ruasnya, when possible. On the basic map made estimates of the involvement of each village/town against one or more extensive way based on the reality on the map, as well as the estimated population that can be served by roads and the result ditabulasikan undertook to facilitate the analysis of benefits.
f. Analysis of the Activity Centre
The purpose of this activity is to determine the location, characteristics and the relative size of all markets or events which simply means:
1) Help interpret network data path by specifying the activities of the centres needed to be centre of attraction to travel towards the Centre of the activity.
2) Help in determining the rate of interest on a road that is at the moment berangkali is experiencing traffic barriers according to the size and type of activity centres.
g. Framework of the Socio-Economic Data
To conduct a systematic study of the supporting framework required a form of socio-economic activities of the region information study, along with data on population, activity centers, data traffic and the road network. All this information is necessary to help interpret the data traffic, specify the heavy vehicle traffic that affect the design of the roughness, predict the level of change, and the upcoming traffic composition. Data checklist that can help in obtaining information required is:
1) The general statistics of the socio-economic
2) Project checklist transmigration and plantation data
3) Checklist of activities of the tourism sector data
III.
Results and Discussions
25
Table 2. The Road Length in NunukanRegency
No Description Volume Unit
1 Regency Road Length 522,68 km
2 Province Road Length 273,60 km
3 Villages/Local Road
Length
25,984 km
Source :Nunukan Departement of Public Works
Table 3.The Road Length Based on Condition
No Description Volume Unit
1 Good 409,23 km
2 Middle 187,45 km
3 Light Damage 38,55 km
4 Heavy Damage 59,74 km
Source :NunukanDepartement of Public Works
The construction of the road network is an important transport infrastructure to streamline the distribution of goods between regions as well as the increasing mobility of the population. As already explained above that it plans a major infrastructure network system in Nunukan Regency consists of:
1) Land Transportation Network System
2) Railways Transportation Network System
3) Sea transport Network System
4) Air transportation Network System
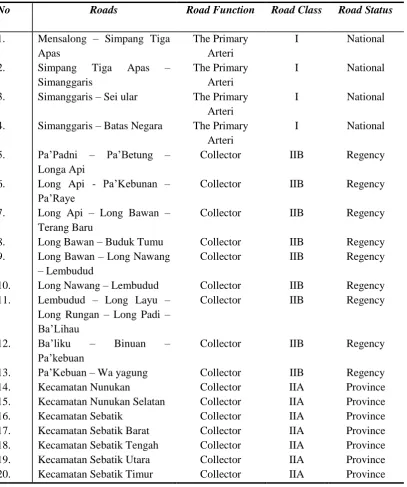
Plan of the development of the road network in Nunukan Regency, as follows:
a. National road network development plans in Nunukan Regency include:
1) National road network that serves artery
2) Segment Sebatik Island ring road is a national road that serves primary collector 1 (K-1).
3) National strategic road network.
4) The development of the National Strategic road network on roads Mansalong - Tau Lumbis and
Nunukan Island Ring Road.
5) The development of theprovincial strategic road network, SeiManggaris - Tau Lumbis.
b. Network development roads plan in Nunukan regency such as construction, improvement and maintenance
of district roads
c. The development plan of the bridge in Nunukan
d. Network Infrastructure Road Transport Traffic
e. The airport feeder in Nunukan is Juvai Semaring airport in sub-district Krayan and Long Layu airport in the sub-district of South Krayan. Special airports in Nunukan.
26
Table 4.The Level Of Travel Based On Intent To Travel
No Purpose of Travel
Number Percentage
1 Family visit 88 28,39
2 Business 18 5,81
3 Work 55 17,74
4 Tourism 28 9,03
5 Shopping 112 36,13
6 Others 9 2,90
Total 310 100,00
Table 5. The level of Travel Based on The Mode Used
No Mode Number Percentage
1 Motorcycle 93 30,00
2 Cars 69 22,26
3 Boat/Speedboat 107 34,52
4 Ship 19 6,13
5 Public
Transport
8 2,58
6 Others 14 4,52
Total 310 100
Table 6. The Level of People Travel Daily
No Number of Trips
Number Percentage
1 1 time 163 52,58
2 2 times 138 44,52
3 3 times 9 2,90
4 4 times 0,00
Total 310 100
Table 7. The Level ofTravel Based On TheTransportationCost
No Transportation Cost
Number Percentage
1 < Rp 50.000,- 89 28,71
2 Rp 50.000,- s/d
Rp 250.000,-
137 44,19
3 Rp 250.000,-
s/d Rp 500.000
45 14,52
4 > Rp 500.000,- 39 12,58
Total 310 100
Based on the results of data processing as shown in the Table 4, Table 5, Table 6 and Table 7, it can be
concluded that the level of most trips by purpose of travel is to shop, amounting to 36.13%. The most