2018 2nd International Conference on Applied Mathematics, Modeling and Simulation (AMMS 2018) ISBN: 978-1-60595-580-3
Correlation Analysis of Gradient and Elevation in Henan Province
Kai-guang ZHANG
*, Ming-ting BA, Hong-ling MENG and Yan-min SUN
Zheng-zhou Normal University, Zhengzhou 450044, China *Corresponding author
Keywords: Elevation, Slope, Gradient, Geo-statistical analysis, Correlation, Henan province.
Abstract. Gradient is an important terrain factor in describing the regional topographic features from elevation and slope. Based on 30m×30m digital elevation model, this paper uses geo-statistical analysis methods to analyze the spatial distribution features of elevation, slope and gradient from the aspect of structure and proportion, and discusses the spatial correlation between gradient and elevation in Henan province, in order to provide some scientific reference for further understanding of its regional terrain. The results show that the topography of the province is dominated by low and medium altitude elevation, the elevation maximum values on longitude lines show 4 ladders, and there is a north-south wind tunnel with average maximum elevation lower than the standard mountain it located in each ladder. On the latitude lines, the elevation maximum values show 3 ladders, the wind tunnel width on the first ladder is the widest, which affects the climate change in the southeast part of the province. The topography of the province is dominated by low terrain slope, the maximum values show 3 ladders on longitude lines, 2 ladders on latitude lines, the change frequency and amplitude of the slope in the southern are significantly smaller than those in the northern part. The slope range on the latitude is extremely higher than that on the latitude. The terrain gradient shows 3 ladders with the decrease average maximums on longitude lines, the change in the second ladder is obviously higher than that in other ladders, it shows 2 ladders on latitude lines, the gradient change frequency and amplitude in the southern are significantly higher than that in the northern part. The varying curve of gradient versus the elevation varying shows a normal distribution, the extreme value appears at elevation 1000m. The gradient standard deviation in different elevation belts are always less than the elevation standard deviation. The gradient has a strong correlation with elevation in the region around 400m. There is significant positive correlation between gradient and elevation in the region above 1430m.
Introduction
Elevation is a intuitive terrain factor that describes the height difference from the point to the datum plane, which determines the relative temperature, the wind speed and the wind direction of the region [1, 2]. Terrain slope and aspect are topographic factors which describe the steepness and orientation of surface units, affect the ability of local ground to receive and distribute solar radiation to a large extent, and determine local climate characteristics, soil moisture, and crop growth suitability, especially has an important role in mountain ecology [1,2,3]. Terrain gradient (topography) is a composite terrain factor of elevation and slope, reflecting the combined effects of elevation and slope [4]. In recent years, the impact researches of elevation, slope (aspect) and terrain gradient on regional economic development have mainly focused on the spatial characteristics of land use and population distribution, as well as their evolutionary patterns, have gotten some valuable results.[5-12]. In fact, there are some correlations between terrain gradient and elevation in a region [9]. There are certain differences in the distribution characteristics of gradients in different elevation belts. The study of correlation between gradient and elevation is helpful to deeply understand the regional geographic features, provide useful references for the effective use of natural resources.
their spatial relationship, in order to provide useful references for deeply understanding Henan topography.
Data and Research Methods
Research Area Overview and Data
Henan province (31°23'N-36°22'N, 110°21'E-116°39'E) is located in the transition zone of China's terrain from the second to the third ladder, with the total area of 167 thousand km2. Its three sides as the north, west and south are semi-circular surrounded by Taihang, Funiu and Tabie mountains[9]. The central and east regions are Huanghuaihai alluvial plain. the data used in the study mainly includes 30m×30m DEM provided by Computer Network Information Center (http://www.gscloud.cn).
Research Methods
Terrain slope describes the degree of steepness of a surface unit, is defined as the angle between the normal direction of the surface unit and the vertical direction. for the calculation of slope based on the digital elevation model, firstly for one cell on the surface, extracting the elevation values of 49 cells in its 90m neighborhood, and using the bi-cubic polynomial surface interpolation method to fit the region surface equation [12,13]
3 3
0 0
( , ) i j
ij i j z f x y a x y
(1)For arbitrary P x y( ,0 0)belongs to the cell, its tangential equation and normal equation respectively
are
0 ( ,0 0)( 0) 0 ( ,0 0)( 0) ( 0) 0
x y
f x y xx f x y yy z z (2)
0 0
1 1
0 0 0 0 0 0 0
( , )( ) ( , )( ) ( )
x y
f x y xx f x y yy z z (3) its normal direction is
0 0
1 1
0 0 0 0
(fx( ,x y ),fy ( ,x y ), 1) , The cosine of the angle with the vertical direction is
0 0
1
2 2 2
0 0 0 0
( x ( , ) y ( , ) 1)
con f x y f x y , (4) the slope of the cell is
0 0
1
2 2 2
0 0 0 0
arccos(fx ( ,x y ) fy ( ,x y ) 1)
, [0,90 ]o . (5)
Gradient Gij, reflects the composite effects of elevation and slope, defined as [7, 8, 10]
lg[(1 )(1 )]
ij ij ij
G E E S S , (6) where Eij,Sij, EandS respectively are the elevation of ( , )i j , the slope of ( , )i j , the elevation mean
and the slope mean in the study area .
When the study region is determined, E and S are fixed values. Tijis a increasing function of
ij
E orSij, this is, the terrain gradient Tij increase with the values of EijorSij increasing. In the same
elevation belt, the terrain gradient in the large slope region is large, in the same slope region, the terrain gradient in the high elevation region is large.
Suppose ( ,x yi i), i1, 2,3 n is the observations of two-dimensional random variable( , )X Y , and
x, y, D X( )and D Y( ) respectively are the mean and variance of Xand Y, the correlation coefficient ofXand Y is defined as [14,15]
1
( )(y )
( ) ( )
n
i i
i
x x y
D X D Y
(7) belongs to [0,1], the greater means strong relevance, as 1means X and Y is linearly dependence, 0 means Xand Yis mutual independence[13,14].
Correlation Analysis of Gradient and Elevation in Henan Province
[image:3.595.94.501.346.589.2]Distribution Characteristics of Elevation in Henan Province
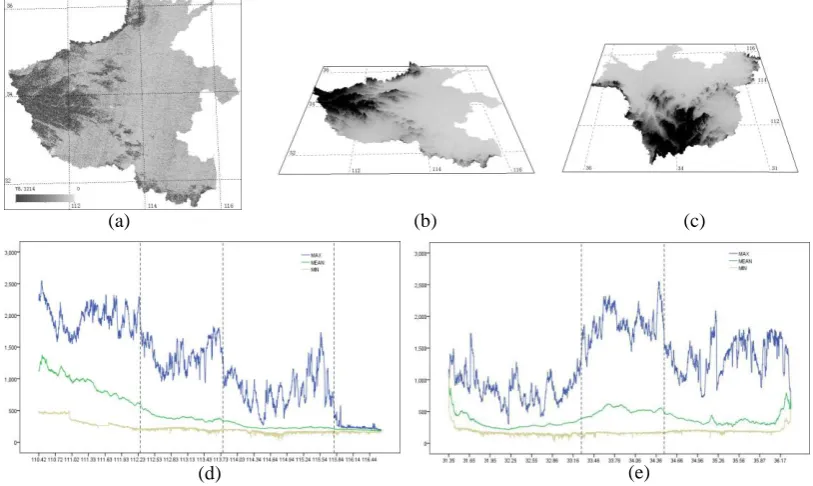
Fig. 1a is the elevation distribution in Henan Province, Fig. 1b and Fig.1c respectively are the 45°side view of the elevation distribution from the south and the west focusing on the province centroid, in order to show the elevation difference, the z-value is magnified by 20 times. The elevation of the province (WGS84 ellipsoidal plane) is between 23m and 2413m with the average elevation of 403m.
Figure 1. The elevation distributions characteristics in Henan province.
The elevation statistics curve (Fig.1d) versus longitude shows that, the topography of the province presents 4 ladders from the west to the east. The first ladder is the high-altitude region, locates in the west of 112°16'26''E, where the average elevation, the average maximum elevation, the average minimum elevation and the area respectively are 823m, 1950m, 290m and 34.00 thousand km2. Using the standard mountain height[9]as a reference for wind tunnel, here exists a north-south wind tunnel with the average maximum elevation of 1712m between 110°51'50''E-111°10'26''E. The second ladder is middle-high altitude region, locates from 112°16'26''E to 113°46'37''E, here the average elevation, the average maximum elevation, the average minimum elevation and the area respectively are 390m, 1395m, 204m and 47.30 thousand km2, there is a north-south wind tunnel with the average maximum elevation of 1122m between 112°32'28''E and 112°47'20''E. The third ladder is middle-low altitude region, locates from 113°46'37''E to115°47'42''E, here the average elevation, the average maximum elevation, the average minimum elevation and the area respectively are 244m, 808m, 162m
(e) (d)
and 7.84 thousand km2, a north-south wind tunnel exists in 112°32'28''E and 112°47'20''E with the average maximum elevation about 347m. The forth ladder is low altitude region, locates in the east of 115°47'42''E, here the average elevation, the average maximum elevation, the average minimum elevation and the area respectively are 199m, 269m, 161m and 0.73 thousand km2.
The elevation statistics curve (Fig.1d) versus latitude shows that, with latitude increase, the topography of the province presents 3 ladders. The first ladder locates in the south of 33°16'44''N, here the average elevation, the average maximum elevation, the average minimum elevation and the area respectively are292m, 835m, 147m and 53.80 thousand km2, exists two east-west wind tunnels with the average maximum elevation of 458m and 473m respectively in 32°10'44''N-32°13'23''N and 32°40'41''N-32°44'31''N. The second ladder locates between 33°16'44''N and 34°28'55''N, with the average elevation, the average maximum elevation, the average minimum elevation and the area respectively are 520m, 1889m, 161m and 65.05 thousand km2, exists a east-west wind tunnel with the average maximum elevation of 1348m in 33°20'06''-33°22'22''. The third ladder is in the north of 34°28'55''N, with the average elevation, the average maximum elevation, the average minimum elevation and the area respectively are 367m,1335m, 189m and 48.20 thousand km2, exists three east-west wind tunnel with the average maximum elevation of 783m, 912m and 922m, respectively in 35°00'25''-35°04'23'', 35°14'24''-35°15'47'' and 35°52'48''-35°53'31''.
[image:4.595.92.501.370.613.2]In general, the province elevation shows the characteristics of west high and east low and middle high side low. The elevation differences in the latitude lines are obviously higher than that in longitude lines.
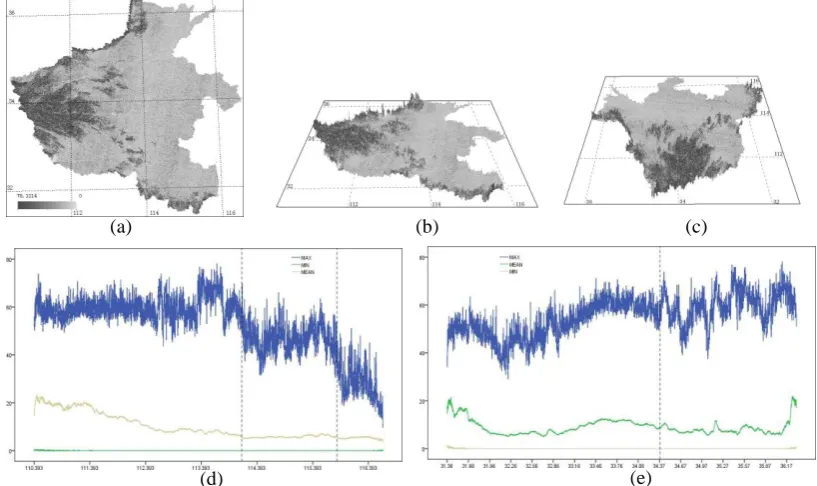
Figure 2. The slope distributions characteristics in Henan province.
Distribution Characteristics of Slope in Henan Province
Using the Eq.1- Eq.5 calculate the slope in the province, the results are showed in the Fig.2a, Fig. 2b and Fig.2c respectively are the 45°side view of the slope distribution from the south and the west focusing on the province centroid, in order to show the slope difference, the slope value is magnified by 1 thousand times. The slope of the province is between 0.33° and 78.12° with the average slope of 8.75°.
On the longitude line(Fig.2d), from west to east the slope maximum shows 3 ladders with 114°07'16''E and 115°49'52''E as the dividing line, and 60.05°, 46.50° and 29.78° as the average maximums. On the latitude line(Fig.2e), the slope maximum increases gradually with latitude, the fluctuating amplitude in the south of 34°22'16'' N is significantly less than that in the north. The mean
(e) (d)
values of the slope shows two connecting concave parabolic characteristic with 34°25'16''N as their contact point, the slope mean of the first parabolic is less than that of the second.
In general, the slope of the province is characterized by west high and east low, north high and south low. The slope differences in the latitude lines are obviously higher than that in longitude lines.
Distribution Characteristics of Gradient in Henan Province
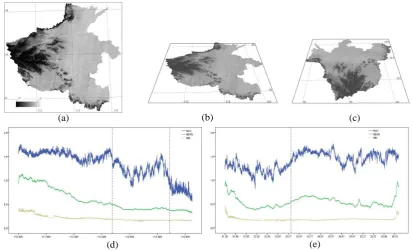
Using Eq.6 calculate the gradient in the province, the results are showed in the Fig.3a, Fig. 3b and Fig.3c respectively are the 45°side view of the gradient distribution from the south and the west focusing on the province centroid, in order to show the gradient difference, the gradient value is magnified by 10 thousand times. The gradient of the province is between 0.12 and 1.76 with the average gradient of 0.54.
On the longitude line(Fig.3d), the gradient maximum shows 3 ladders with 113°48'41''E and 115°50'35''E as the dividing line, and 1.52, 1.21 and 0.82 as the average maximums, the change in the second ladder is obviously higher than that in other ladders, the mean decreases gradually with the increase of longitude. On the latitude line(Fig.3e), the gradient maximum and mean all show 2 ladders with 33°14'20''N as the dividing line, and 1.22 and 1.52 as the average maximums, the mean in the south of 33°14'20''N shows a concave parabolic characteristic, the mean in the north of 33°14'20''N fluctuates around 0.58.
[image:5.595.90.503.378.629.2]On the whole, the gradient composes the distribution features of elevation and slope, the gradient of the province presents the features of west high and east low, north high and south low. The gradient difference in the latitude line is significantly higher than in the longitude line.
Figure 3. The gradient distributions characteristics in Henan province.
Correlation Analysis of Gradient and Elevation in Henan Province
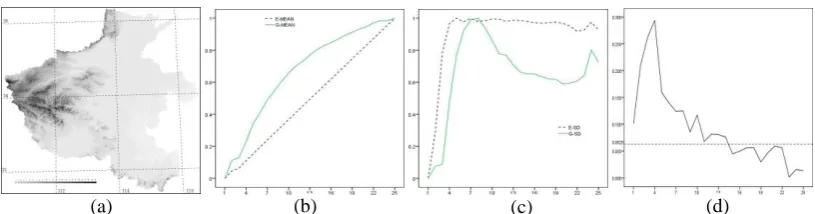
In order to study the relevance between gradient and elevation, according to the characteristics of elevation distribution in the province, this study divides the elevations into 25 classes at interval of 100m, and the ith class includes the elevation belongs to [100(i-1), 100i) (Figure 4a). According to Eq.7, by using raster algebra calculate the correlation coefficient of gradient and elevation in each class , the results are showed in Table 1.
(a) (b) (c)
Table 1. The statistics analysis of elevation and gradient on the elevation belt.
Class 1 2 3 4 5 6 7 8 9 10 11 12 13
EM/100 0.84 1.94 2.33 3.43 4.48 5.48 6.49 7.48 8.49 9.49 10.50 11.49 12.49
ESD 16.71 20.27 26.37 28.59 29.00 28.72 28.99 28.74 28.81 28.94 28.92 28.74 28.85
GM 0.234 0.369 0.389 0.509 0.644 0.729 0.821 0.890 0.959 1.022 1.073 1.110 1.157
GSD 0.095 0.101 0.102 0.134 0.157 0.169 0.175 0.176 0.171 0.164 0.158 0.157 0.152
CC% 10.10 21.00 26.20 29.38 15.94 14.00 12.39 12.49 8.56 11.68 6.78 8.14 8.04
Class 14 15 16 17 18 19 20 21 22 23 24 25
EM/100 13.48 14.48 15.47 16.46 17.45 18.46 19.46 20.45 21.43 22.42 23.41 24.42 ESD 28.81 28.75 28.65 28.61 28.65 28.70 28.59 28.39 27.99 28.10 28.67 28.10
GM 1.197 1.227 1.249 1.277 1.305 1.327 1.350 1.370 1.397 1.413 1.414 1.433
GSD 0.148 0.147 0.147 0.146 0.145 0.145 0.142 0.143 0.144 0.147 0.160 0.153
CC% 7.63 4.46 4.96 5.60 5.62 2.93 4.69 5.94 5.56 0.12 1.56 1.30
Fig. 4b is the gradient mean value curve(GM, solid line) and the elevation mean value curve (EM, dotted line) , after range normalization transformation, versus elevation belt. The elevation mean value presents a linear growth characteristic, and its linear regression equation is,
0.042070 0.05246
EM CLASS , with the sum of squared residuals R0.286,( which indicates this
elevation zoning is relatively reasonable). the gradient mean value gradually increases, but there is a significant difference in the trend with the elevation mean value increase, the projection of the gradient mean value on the elevation mean value shows a normal distribution characteristics
[image:6.595.94.502.425.532.2]N(0.1738,0.0093). the variability of the gradient mean value below 1000m (10th elevation belt) is obvious higher than that of the elevation mean value.
Figure 4. The correlation analysis of gradient and elevation on the elevation belts in Henan Province.
Fig. 4c is the gradient standard deviation curve(GSD, solid line) and the standard deviation curve (ESD, dotted line) , after range normalization transformation[14,15], versus elevation belt. The standard deviation of the gradient is always less than that of elevation, the elevation standard deviation increases gradually with the elevation increase to 300 m (3rd elevation belt), and then remains at a high level, indicating that the elevation variation increases with the elevation belt, the gradient standard deviation increases gradually with the elevation increase to 700m (7th elevation belt), in the region of 700m-1900m, the gradient standard deviation gradually decreases with the increase of elevation.
Fig. 4e is the correlation coefficient (CC) versus elevation belt. with the increase of elevation, the correlation coefficient gradually increases, reach the maximum 0.29 on the 4th elevation belt, then decreases to 0.0012 of 25th elevation belt. the correlation coefficient in the region below 1430m is greater than the relevant critical value of 6.25% [9,14], here the gradient and elevation is positive correlation.
Conclusion
This paper, based on 30m×30m digital elevation model (DEM), utilizes geo-statistical analysis methods to analyze the spatial distribution characteristics of elevation , slope and gradient, explores their spatial relationship. The results show that:
(1) The topography of the province is dominated by low and medium altitude elevation, the elevation maximum values on longitude lines show 4 ladders, and there is a north-south wind tunnel with average maximum elevation lower than the standard mountain it located in each ladder, on the latitude lines, the elevation maximum values show 3 ladders, the wind tunnel width on the first ladder is the widest, which affects the climate change in the southeast part of the province.
(2) The topography of the province is dominated by low terrain slope, the maximum values show 3 ladders on longitude lines, the maximum values show 2 ladders on latitude lines, the change frequency and amplitude of the slope in the southern are significantly smaller than those in the northern part. the slope range on the latitude is extremely higher than that on the latitude.
(3) The terrain gradient shows 3 ladders with the decreased average maximums on longitude lines, the change in the second ladder is obviously higher than that in other ladders, it shows 2 ladders on latitude lines, the gradient change frequency and amplitude in the southern are significantly higher than those in the northern part.
(4)The varying curve of gradient versus the elevation varying shows a normal distribution, the extreme value appears on elevation 1000m. The elevation standard deviation increases gradually with the elevation increase to 300 m, and then remains at a high level. The gradient standard deviation is proportional to elevation in the region below 700m, and inversely proportional in other regions. The gradient standard deviation in different elevation belts are always less than the elevation standard deviation. The correlation coefficient between the gradient and elevation gradually increases with the increase of elevation in the region below 400m, then decreases. There is a significant positive correlation between gradient and elevation in the region above 1430m.
References
[1] Fan Xingang, Ma Zhuguo, Yang Qing, et al. Land use/land cover changes and regional climate over the Loess Plateau during 2001–2009. Part II: Interrelationship from observations. Climatic Change, 2014, 129(3/4): 441-455.
[2] Fan Xingang, Ma Zhuguo, Yang Qing, et al. Land use/land cover changes and regional climate over the Loess Plateau during 2001-2009 Part I: Observational evidence. Climatic Change, 2014, 129(3/4): 427-440.
[3] Salazar Alvaro, Baldi Germán, Hirota Marina, et al. Land use and land cover change impacts on the regional climate of non-Amazonian South America: A review. Global and Planetary Change, 2015, 128(5): 103-119.
[4] Sun Peiling, Xu Yunqing, Wang Shuo. Terrain gradient effect analysis of land use change in poverty area around Beijing and Tianjin. Transactions of the Chinese Society of Agricultural Engineering, 2014, 30(14): 277-288.
[5] K.G. Zhang, M.T. Ba, H.L. Meng. Spatial pattern and forest analysis of urbanization growth rates in Henan province. Adcances in engineering research, 2016, 56:45-49.
[6] Pachauri A K, Gupta P V, Chander R. Landslide zoning in a part of the Garhwal Himalayas. Environmental Geology, 1998, 36(3-4): 25-334.
[8] Y. Liu, W. Deng, X.X. Song, et al. Population Density Correction Method in Mountain Areas Based on Relief Degree of Land Surface: A Case Study in the Upper Minjiang River Basin. Scientia Geographica Sinica, 2015, 36(4):464-469.
[9] K.G. Zhang, M.T. Ba, H.L. Meng, el al. Characteristics analysis of land use spatial distribution on terrain gradient in Henan province. DEStech Transactions on Computing Science and Engineering, 2017, 96-102.
[10] T.T. Chen, L. Peng, S.Q. Liu, et al. Relationships of relief degree of topography with population and economy in Hengduan mountain area based on GIS.Journal of University of Chinese Academy of Sciences, 2016, 33( 4): 505-512.
[11] T.Z. Shu, X.H. Wang. Research for the correlation between relief amplitude and regional soil erosion based on 3S technolog. Research of Soil and Water Conservation, 2017.4(24):127-132.
[12] A.l. Liu, H. Ding, D. Tian. A dct DEM digitial watermarking algorithm based on the analysis of slope and aspectGeomatics. Geomatics and Information Science of Wuhan University, 2016, 7(41):903-910.
[13] Guo Renzhong. Spatial Analysis. Beijing: Higher education Press, 2011.
[14] Chen Yanguang. Mathematical Methods for Geography. Beijing: Science Press, 2017.