2018 2nd International Conference on Applied Mathematics, Modeling and Simulation (AMMS 2018) ISBN: 978-1-60595-580-3
Investigation on Influence of Reflectivity of the Film on Interference
Fringes and its Optimization with Theoretical Analysis
Sheng-wen QI
1,2*, Xue-ping CHENG
1, Peng LI
1, Xiao-ping Qin
1,
Qing-wei WANG
1and Hong-guang LU
31School of Mathematics, Physics and Information Science, Zhejiang Ocean University, China
2Key Laboratory of Oceanographic Big Data Mining & Application of Zhejiang Province, China
3Affiliated Hospital, Guiyang Medical University, Guiyang, China
*Corresponding author
Keywords: Interference, Fringe visibility, Measurement.
Abstract: In view of the problem that the low visibility of interference fringes of interferometer affects the accuracy of measurement, the intensity distribution of the interference of thin film is investigated with theoretical calculation. The influences of the reflectivity of the film on the intensity distribution and the visibility of the fringes are discussed and the relation between the reflectivity and the visibility is deduced. The results show that the optimal numerical range of the reflectivity with high clarity of the fringe is in the vicinity of 0.5.
Introduction
In an optical measuring instrument, such as interferometer adopting wedge-shaped plate interference, the visibility of the fringe is related to the reflectivity of the film surface. If the experimental instrument does not optimize the reflectivity on the surface of the film, the contrast of the stripes is not high, which affects the accuracy of the measurement. The multi-beam thin film interference taken as an example, the non-localized interference of two pointolites or that of multiple pointolites, is less discussed in the literature and the latter exhibits some especial properties, such as very thin and sharp fringes.
The non-contact methods for measuring the minute wedge angle or other physical quantity have been developed, which are more effective than the contact methods, in particular for the real-time checking. The optical method, one of them, is based mainly on light interference and by measuring
only interference fringe [1-3]. Besides, the measurement accuracy by means of the multi-beam
interference is superior to the one of the conventional double-beam interference [4–6]. In fact, the
conclusion is true only if the reflectivity of film reaches a certain value. In this paper, based on the interference theory of light, the multi-beam and double-beam interference are all discussed, furthermore the reflectivity of the surface of the film is optimized by calculation and analysis so as to obtain clear interference fringes and to ensure the accuracy of the measurement.
The Relationship between the Intensity Distribution and the Reflectivity
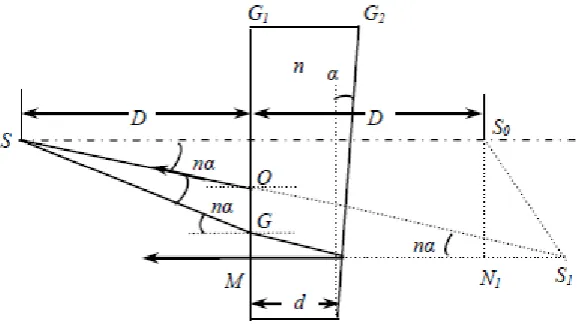
In Fig. 1, G1, G2 is the surface before and after of the parallel plate (refractive index n) respectively.
Laser beams reflected by G1, G2 form interference fringes (a set of concentric circles) on the screen
and they will change by changing the distance between G1 and G2 or between G1, G2 and the screen,
or non-parallelism between G1 and G2. If the parallel plate is made of ordinary glass, due to its very
low reflectivity, just the two reflected beams are needed to consider and so it can be seen as two-ray interference; if the coated glass (high-reflection rate) is used, the contribution of multiple reflections of the beam can’t be ignored, thus it is necessary that interference effects be regarded as multi-beam. By determining the virtual source of all reflected light we discuss multi-beam interference on the
condition of that the angle α between G1 and G2 is minute. In Fig. 1, the angle of incidence (emitted
Figure 1. Positions of virtual light sources of the setup.
S is reflected by the G1 and its virtual light source locates at S0. We can find its position of virtual
light source, S1, reflected once by G2. The ray SG with incident angle nα is incident to G1, and the
corresponding angle of refraction is α. Because the angle between the G1 and G2 is α, so the angle
of incidence to G2 changes to 0 and the ray returns along the same route after reflected by G2; the
ray with incident angle 2nα is refracted at G1 and corresponding reflection angle is 2α; at G2 the
incident angle is α, and the ray is reflected and exits at the direction of vertical to G1. The
intersection, S1, of reverse extension line of the mentioned above two rays is exactly the virtual light
source reflected once at G2. From Fig.1 we can get S0N1=2nαD+2αd and N1S1=2d/n.
The distance between virtual light source S0 and S1 is
2 / 1 2 2
0 ) ]
2 ( ) 2 [(
n d D n
d
, (1)
and the angle between S0S1 and optical axis is
d D n n d D
n
2 2
. (2)
Similarly, if the angle between the ray and optical axis is 3nα, the ray reflected twice at G2
returns at the direction of perpendicular to G2 and the angle changes to be nα; if the angle is 4nα,
the ray reflected twice at G2 returns at the direction of perpendicular to G1 and the angle changes to
be 0;…if the angle is (2k-1)nα, the ray reflected k times at G2 returns at the direction of
perpendicular to G2 and the angle changes to be nα; if the angle is 2knα, the ray reflected k times at
G2 returns at the direction of perpendicular to G1 and the angle changes to be 0. Accordingly, we
can use each pair of rays to determine the position of other virtual sources.
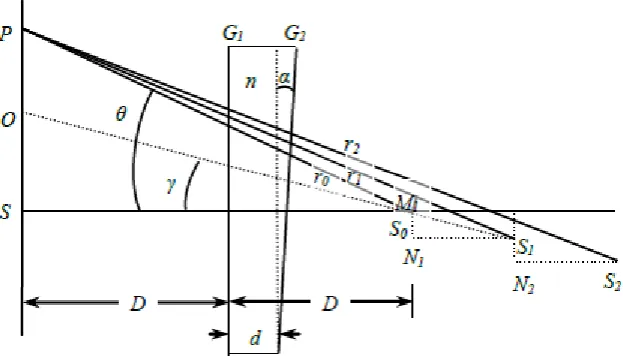
Let S0, S1 and S2 be the virtual light sources of S reflected at G1 and G2 in Fig. 2 (for simplicity
only S0, S1 and S2 are drawn). It can be deduced that the distance between any adjacent virtual
sources in horizontal direction is 2d/n but in vertical direction it increases slow with an increment in
the number of reflections, as follows:
d k k D kn N S
k
j k
k
1
1 2 2 ( 1)
, (3)
The distance between each virtual source Sk and P is
2 / 1 2 1
2 [2 2 2(2 1) ] }
) 2 2
{( D kn D k d
n kd D r
k
j
k
Figure 2. Multiple-beam interference.
Let A be the amplitude of the incident light, R, R’ the reflectivity of amplitude at G1 and G2, and t,
t’ the transmissivity of amplitude at G1 and G2, respectively. On the condition of that the refractive
index of surroundings of G1 is equal to the one of G2, then R=-R’, and
1 '
2tt
R . [7] (5)
For simplicity, R, R’, t, t’ all as absolute value, so the amplitude of each reflected beam is
AR
A0 , A1Att'R,
3 2 Att'R
A , … , 2 1
'
k
k AttR
A , … (6)
So the light intensity at P is
2 2
y x A
A I
, (7) where 2 / 1 2 1 2 1 1 2 2 / 1 2 } ] ) 1 2 ( 2 2 2 [ ) 2 2 {( 2 cos ] ) 1 ( 2 2
cos[
k j k k
x D kn D k d
n kd D r t At D Ar
A
(8) ) } ] ) 1 2 ( 2 2 2 [ ) 2 2 {( 2 sin ] ) 1 ( 2 2
sin[ 2 1/2
1 2 1 1 2 2 / 1
2
k j k k d k D kn D n kd D r t At D Ar
Ay
(9)
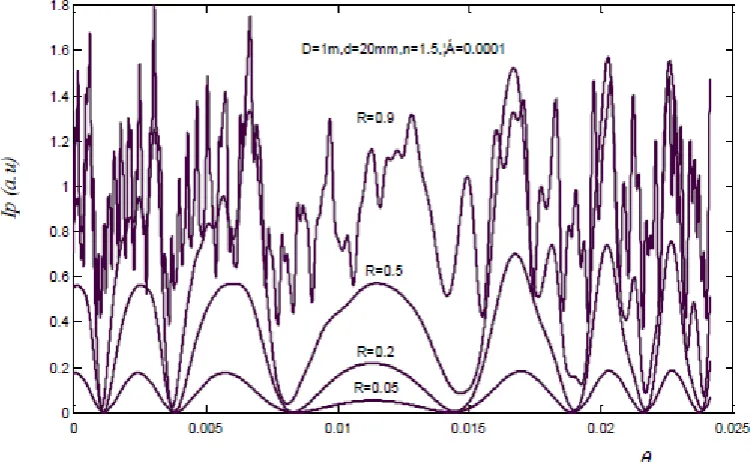
By Eq. (7)-(9) the light intensity at P can be obtained and its curve can be drawn. According to
Eq. (7), intensity distribution curves of the reflected light interference with different reflectivity
(D=1m, d=20mm, α=0.0001, n = 1.5, =633nm) is shown in Fig. 3.
As long as R is not too large (e.g. R<0.5), Eq. (7) can be regarded as intensity distribution of
interference between two virtual light source S0, S1, and no matter how R changes the extreme
position of intensity is always the same, which indicates that whether interference is caused by two
virtual light sources or by multiple ones, its fringe shape is the same. So on the condition of that R
is not too large, double-beam interference can be substitutedfor multi-beam interference.
The Distribution of Light Intensity and Fringe Contrast under Double-beam Superposition
For simplicity, let the reflectivity r at the two surfaces A and B, of the film be the same. By using Eq.
(5) and Eq. (6), A0 being the amplitude of incident light to A surface, the amplitude of refraction
light and reflection beam is respectively [7]. Under the condition of R being small, the interference
can be treated as double beams, so fringe intensity distribution is
) cos 2 1 ( ) 1
( 2 2
2 0
2
R R R A
Figure 3. Curves of intensity distribution (α=0.0001).
The maximum intensity of the fringe
2 2 2 0
max A (1 R )
I , (11)
and the minimum of the one
4 2 0 min A (1 R)
I , (12)
So the fringe visibility
2
1 2
R R V
(13) Let R be different value, according to Eq. (12) and Eq. (13), the intensity distribution and visibility can be obtained. It is obvious that in the case of very low reflectivity (such as R=0.006 is equivalent to the condition that the plate glass is filled with water and no coating, R=0.05 is equivalent to the non-coating situation), the difference between the maximum and the minimum is very small, and the fringe is not easy to observe in spite of the visibility being large. With the increase of the reflectivity, the difference between the maximum and the minimum increases significantly, so the fringes become clear, thin, sharp and easy to observe. However, as the reflectivity increases, such as R>0.5, the visibility decreases obviously and the fringe becomes very bright and is not easy to observe (e.g. R=0.9). In addition, if R>0.5, only considering the interference of double-beam is not accurate enough and it is necessary to calculate with multi-beam, so in the case of larger R, the above conclusions need to be corrected.
Conclusions
The results of calculation and simulation show that the intensity distribution and visibility of the fringes are related to reflectivity R: the larger R is, the larger the peak intensity of fringes is, the sharper bright fringe becomes; its intensity is even more than that of incident light. In the case of
definite R, the peak values are the same; as for minimum of intensity of fringes, in the case of
smaller R, if R increases, the minimum value indistinctively changes, but when R exceeds 0.5, it
increases significantly; the difference between minimum and maximum becomes very small and some new sub-maximum appear so as to fringes become very close, which results in too low
too large, no matter how R changes the positions of extreme values of intensity is always fixed. [8] So by using the coated glass to choose the appropriate reflectivity of the film in interferometer, the quality of the interference fringes can be obviously improved, which is beneficial to the clear observation of the fringes and the accurate measurement.
Acknowledgements
This work is financially supported partly by the National Natural Science Foundation of China (No.11505154) and the Natural Science Foundation of Zhejiang ( LQ16A010003).
References
[1] Heavens OS, Gingell D., Film thickness measurement by frustrated total reflection fluorescence, Opt. & Lase Tech. 23(1991)175-179.
[2] Jung R., Rhee K., Simultaneous determination of thickness and optical constants of polymer thin film by analyzing transmittance, Appl. Opt. 41( 2002) 3861-3865.
[3] X. Wang, H. Cao, Z. Zhai, Measurement of two-dimensional small angles based on interference fringes, Proc. Inte. Cong. Imag. & Sign. 1( 2009)4784-4788.
[4] Ishikawa K, Yamano H, Kagawa K, Asada K, Iwata K, Ueda M., Measurement of thickness of a thin film by means of laser interference at many incident angles, Opt. & Lase. Engi. 41(2004)19-29.
[5] R. Tadmor, N. Chen, N. Jacob, Thickness and refractive index measurements using multiple beam interference fringes, J. Coll. & Inte. Sci. 264(2003)548-553.
[6] V. D. Lizunov, V. V. Kopytov, Method of improving the accuracy of measurement of a plane angle by interference goniometers, Meas. Tech. 41(1998)417-421.
[7] K. Zhao, X. Zhong, Opt., third ed., Peki. Univ. Press, 1984.