2019 International Conference on Computation and Information Sciences (ICCIS 2019) ISBN: 978-1-60595-644-2
A Machine Learning Classifier Based on
Statistical Method for Small Number
of Samples
Lin Xu and Yan Li
ABSTRACT
Due to the small number of train samples, the classifier with ideal generalization ability for small sample size is not easy to obtain. However, the problem of constructing small sample classifier exists widely in the real world, especially in the field of biological medicine. Therefore, building a classifier based on small number of samples has become a research hotspot. In this study, we proposed a machine learning classifier based on statistical methods to solve this problem. In this method, Bootstrap, chi-square test and other statistical methods were firstly combined to solve the performance evaluation of multiple machine learning classifiers under small sample sizes dataset. Then, the application of Youden index in machine learning classifiers was optimized to meet the requirements of clinical application. The simulation experiment on the UCI breast cancer data set shows that this method is more stable and accurate for the performance evaluation, and at the same time, optimized Youden index in machine learning classifier is able to flexibly meet the application requirements of small number of samples in the medical research field.
1. INTRODUCTION
How to train an accurate classifier for small number of sample attracts more attention in the era of big data, which results in the small sample problem as well. The so-called small sample problem refers to how to learn and build appropriate models from a small number of samples. As is well known to all, deep learning-based methods often require a large number of labeled samples, but there
are often lack of sufficient sample data in many fields. For example, in the field of biological medicine, it is difficult to obtain high-quality labeled medical images, the high cost of manual labeling makes the training sample size small [3]. Therefore, small sample problem has become one of the important research directions in the field of machine learning [4]. In recent years, small sample challenges have emerged in many machine learning problems, especially in the field of medical research. At present, researches on small sample problem mainly focus on two orientations. One is to combining statistical methods from statistical community, the representative one is the small sample data analysis methods based on bootstrap which was proposed in [5]. The other methods train small sample model by using supervised or unsupervised learning method [3]。
Breast cancer is the second most common cancer in the world, with nearly 2 million new cases are reported each year. According to the data of China cancer center in 2018, the number of new cases and related deaths of breast cancer is 304,000 and more than 70,000 respectively, and the number of disease-carrying survival is predicted to reach 2.5 million by 2021 [17]. Therefore, the research on breast cancer has strong scientific research and clinical application value.
In this study, we proposed a new classifier for small sample dataset, which combined a few statistical methods and supervised machine learning algorithms to solve problems with them in medical research. Firstly, this proposed method applied Bootstrap, chi-square test, stratified random sampling and other statistical methods to solve performance evaluation of the classifier, and then by optimizing Youden index to improve the flexibility of the classifier.
This paper is organized as follows: Section 2 introduces our proposed approach which gives the foundation of our method. Experiments results from UCI breast cancer dataset are shown in Section 2. Conclusions and future directions are given in Section 4
2. MATERIALS AND METHODS
2.1 Data Preprocessing
The breast cancer data set came from UCI and was donated in 1988 by m. Zwitter and m. Soklic who were with the institute of oncology, university of ljubljana, Yugoslavia [13].There were 286 instances in the data set, among which 81 relapse cases and 205 non-relapse cases. Each instance has 10 attributes, all of which are enumerated types. The specific meanings of attributes may refer to [13].
to ensure a high-quality data set, so as to improve the quality and efficiency of subsequent during the following data mining analysis.
2.2 Sample set partitioning
This dataset has sample imbalance problem which is a common problem in small sample model construction. We adopts stratified random sampling to complete the training/testing sample set, namely the data set D is divided into two mutually exclusive sets according to outcome variables. One set is treated as training set S, another as a test set T, namely 𝐷 = 𝑆 ∪ 𝑇, 𝑆 ∩ 𝑇 = 0. (Sample size ratio, S: T=7:3 (in order to evaluate the fidelity of the results: the common ratio of 2:1 ~ 4:1) [1] [2]. After the model on S is obtained, T is used to evaluate its test error as the evaluation of generalization error. Since it is for partition of small sample sets, we specially introduces independent iso-distribution test (chi-square test for classification variables and KS test for continuity variables) to ensure the consistency of data distribution of training set S and test set T, and avoid the impact of sampling error on the results.
2.3 Model Construction
In this paper, four traditional machine learning algorithms are selected to test the experimental model, which are random forest, nearest neighbor method, support vector machine and naive bayes. Grid search and 10-fold cross-validation were used to train all models [13]. So as to ensure the parameter tuning of the model and reduce the over-fitting of training process.
Date imbalance is a normal condition in medical research, so conventional machine learning evaluation indexes is inappropriate for this kind of dataset [2]. For example, there are 80 positive samples and 20 negative samples. If all samples are directly identified as positive samples, the accuracy rate is 80%, but this is obviously meaningless. Receiver Operating Characteristic (ROC) curve is commonly used in medicine to evaluate the performance of the model. Each point in the ROC curve reflects the sensitivity to the same signal stimulation [14].
In this paper, the Youden index is chosen as the standard for the selection of threshold value. Youden index is also known as the correct index, which is a method for medical evaluation of the authenticity of screening tests and can represent the total ability of screening methods to find true patients and non-patients [11]. The higher the index, the better the effect of screening experiment and the greater the authenticity [11]. In this paper, the probability values of each category are output by adjusting the model parameters, and then the threshold (cut-off value) of the dichotomies is selected according to the maximum Youden index in the ROC curve of the classifier, and finally the classification results are predicted according to the threshold value [16]. Assuming that false negative (missed diagnosis rate) and false positive (misdiagnosis rate) are equally harmful, youden index can be directly applied [11]. However, in clinical medical research, it is often necessary to select the threshold flexibly according to the characteristics of diseases and expected purposes. Based on different disease characteristics, when the disease is serious and treatable, false positive results will not cause serious psychological pressure and economic loss, and improper treatment will not cause serious consequences, the model should not be missed, and the model should have high sensitivity [7]. On the contrary, the model should be highly specific when the disease is severe but not treatable, and the false positive results may cause severe psychological stress or economic loss. Depending on the intended use of the model, in general, screening models must be highly sensitive to ensure true positive results. Although false positives are usually produced, it is better than false negatives which resulting in transmission or delayed treatment; the diagnostic model should have good sensitivity and specificity due to the requirement of timely treatment in clinic. Confirmation models should generally have high specificity and high positive predictive value [7].Therefore, the calculation formula of youden index is adjusted, so that it can flexibly meet different requirements without affecting the performance of classifier.
If N is the total number of observed cases, A is the number of patients predicted to be positive, i.e., true positive; B. The number of non-patients predicted to be positive, i.e., false positive; C is the number of patients predicted to be negative, i.e. false negative; D the number of cases in which non-patients were predicted to be negative, i.e., true negative.
Sensitivity: also refers to the proportion of people who are actually sick that can be correctly predicted as patients by the model;
Specificity: it means the ratio of actual disease-free people to non-patients can be accurately predicted by the model [16].
As shown in TABLE I, the confusion matrix: The youden index = A/ (A+C) +D/ (B+D) -1;
TABLE I. CONFUSION MATRIX.
Confusion Matrix
Predictive Value
0 1
True Value
0 D B
1 C A
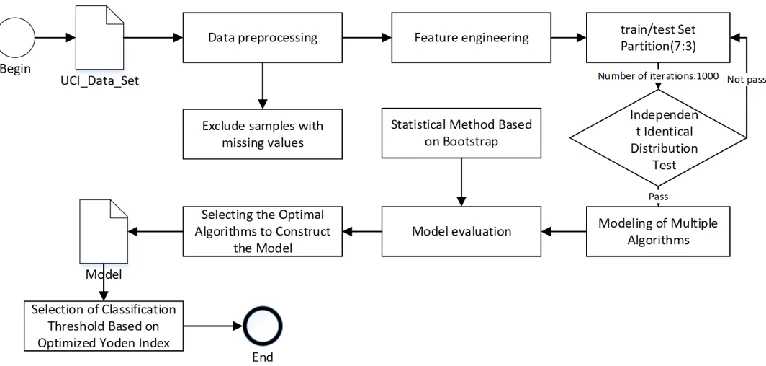
The diagram for our proposed approach is illustrated in Figure 1.
Figure 1. The diagram of the proposed methods.
2.4 Evaluation with Bootstrap model
In order to ensure the stability and reliability of the evaluation results, this paper adopted Bootstrap and hold-out method. Bootstrap is an important statistical method for estimating statistical variability in non-parametric statistics, and can be used to estimate statistical interval [8][10]. In this paper, the AUC of ROC curve is used as the model evaluation index, and the method principle of Bootstrap is integrated.
Specific steps for Bootstrap model evaluation are as follows [9]:
1) 70% of the samples from the original samples are chosen as the training set by adopting the repeated sampling technique, and the rest is the test set.
2) To train the machine learning classification model according to the samples extracted, and calculate the evaluation index AUC according to the prediction of the test centralized model.
[image:5.612.115.498.238.421.2]4) Calculate the mean and variance of the AUC, the evaluation indexes of the N models mentioned above, and estimate the stability and effectiveness of the model.
3. RESULTS
3.1 Experimental environment
The experimental environment of software and hardware adopted in this paper is shown in TABLE II:
TABLE II. EXPERIMENTAL ENVIRONMENT.
CPU Intel(R)Core(TM)i5-6200U Memory 4G
OS Microsoft Windows 10 Software R 3.6.1
3.2 Experimental results
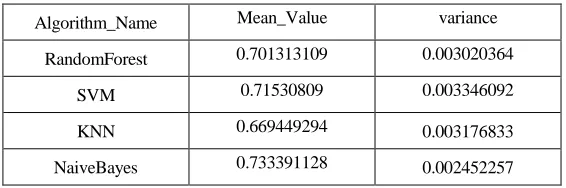
[image:6.612.156.439.494.588.2]In this paper, the model evaluation results are shown in Figure 3 when Bootstrap's N=1000. It can be seen from Figure 2 and TABLE III that the classifier model from NaïveBayes algorithm is superior to other algorithms in both stability and performance, among which the average evaluation index AUC of NaiveBayes model is 0.733391128 and the variance is 0.002452257.
TABLE III. BOOTSTRAP STATISTICS.
Algorithm_Name Mean_Value variance
RandomForest 0.701313109 0.003020364
SVM 0.71530809 0.003346092
KNN 0.669449294 0.003176833
Figure 2. Evaluation effect diagram of 4 machine learning algorithms
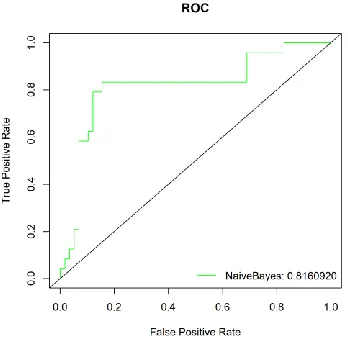
[image:7.612.208.381.100.237.2]According to the above process, NaiveBayes algorithm is selected to build the final classifier model, and the classifier ROC curve is shown in Figure 3:
Figure 3. ROC curve of NaiveBayes classifier.
The confusion matrix of the application model is generated according to ROC curve and youden index, as shown in TABLE IV:
TABLE IV. CONFUSION MATRIX OF NAIVEBAYES CLASSIFIER.
Confusion
Matrix
Predictive Value
0 1
True
Value
0 51 6
[image:7.612.211.385.348.519.2]The performance results of the classifier for breast cancer dataset are as follows: sensitivity: 0.75, specificity: 0.879, Kappa: 0.622, F1:0.735, AUC: 0.816 and accuracy: 0.841. At the same time, three groups test for sensitivity and specificity were performed for verifying the effectiveness and convenience of parameter adjustment, as shown in TABLE V:
TABLE V. PERFORMANCE OF DIFFERENT PARAMETERS COMBINATION.
Parameters Threshold Accuracy Kappa Sensitivity Specificity F1 AUC
a=b=c=1 0.430940 0.8414634 0.6217175 0.75 0.8793103 0.7346939 0.816092
a=3,b=2,c=1 0.074061 0.4634146 0.0998004 0.8333333 0.3103448 0.4761905 0.816092
a=1,b=2,c=1 0.584466 0.804878 0.477707 0.5 0.9310345 0.6 0.816092
It is noted that researchers not only care about the model performance, but also pay special attention to risk factor analysis in medical research [15], thus, achieve the effect of combining prevention and treatment. Through the classification model of small sample sizes proposed in this paper, which is able to calculate significance of different characteristic variables and provide support for clinic and research purpose.
4. CONCLUSIONS
In this study, in order to solve the small sample problem in medical research field, we proposed a new machine learning classifier based on statistical methods. In this approach, Bootstrap, chi-square test and other statistical methods were firstly combined to solve the performance evaluation of machine learning classifiers. Then, Youden index in this classifier was optimized to meet the requirements of clinical application. The simulation experiment on the UCI breast cancer data set shows that the proposed method can steadily and accurately complete the performance evaluation of four kinds of machine learning classifiers and meet the requirements of medical research on the flexible application of small sample classifiers.
REFERENCES
1. Yi-Ju Tseng, Chuanen Huang, Chiao-Ni Wen, Poyin Lai, Min-Hsien Wu, YuChen Sun, Hsin-Yao Wang, Jang-Jih Lu. 2019-06-12. “Predicting breast cancer metastasis by using serum biomarkers and clinicopathological data with machine learning technologies,” International
Journal of Medical Informatics, 79-86.
3. Guojun Qi, Jiebo Luo. 27 Mar 2019. “Small Data Challenges in Big Data Era: A Survey of Recent Progress on Unsupervised and Semi-Supervised Methods,” arXiv: 1903.11260v1. 4. 2018-01-08. “Health and Medicine - Medical Statistics; New Medical Statistics Findings Has
Been Reported by Investigators at Diagnostica Stago (A comparison of confidence/credible interval methods for the area under the ROC curve for continuous diagnostic tests with small sample size),”Biotech Business Week.
5. Alok Kumar Dwivedi; Indika Mallawaarachchi; Luis A. Alvarado. 2017. “Analysis of small sample size studies using nonparametric bootstrap test with pooled resampling method,” Statistics
in Medicine, 2187-2205.
6. Zanetti Miriam Raquel Diniz; Petricelli Carla Dellabarba; Alexandre Sandra Maria; Paschoal Aline; Araujo Júnior Edward; Nakamura Mary Uchiyama. 2016:97-102. “Determination of a cutoff value for pelvic floor distensibility using the Epi-no balloon to predict perineal integrity in vaginal delivery: ROC curve analysis. Prospective observational single cohort study,” Sao Paulo medical journal = Revista paulista de medicina.
7. Guoqiang Yuan, Liang Niu, Yinian Zhang, Xiaoqing Wang, Kejun Ma, Hang Yin, Junqiang Dai, Wangning Zhou, Yawen Pan. 2017. “Defining optimal cutoff value of MGMT promoter methylation by ROC analysis for clinical setting in glioblastoma patients,” Journal of
Neuro-Oncology, Vol.133 (1), pp.193-201
8. Yao Xin. 2015. “Ensemble Approaches to Class Imbalance Learning,”CAC 2015.
9. Qunxiong Zhu,Hongfei Gong,Yuan Xu, Yanlin He.2017. “A Bootstrap based Virtual Sample Generation Method for Improving the Accuracy of Modeling Complex Chemical Processes using Small Datasets,”2017 IEEE 6th Data Driven Control and Learning Systems Conference.
10.Shibo Xin, Bing Ren. 2016. “Application of Regression Analysis for Small Samples Based on Bootstrap Method,” Proceedings of the 2016 International Conference on Education,
Management, Computer and Society.
11. Li; Chen; Qin. 2019-02-26. “Partial Youden index and its inferences,” Journal of
Biopharmaceutical Statistics, 385-399.
12.Cuzick Jack. 2019. “Predicting late recurrence in ER-positive breast cancer,” Nature reviews.
Clinical oncology, 406-408.
13.Alex J. Bowers, Xiaoliang Zhou. 2019-01-02. “Receiver Operating Characteristic (ROC) Area Under the Curve (AUC): A Diagnostic Measure for Evaluating the Accuracy of Predictors of Education Outcomes,” Journal of Education for Students Placed at Risk (JESPAR), 20-46. 14.Floortje K. Ploos van Amstel; Jolien Tol; Kelly H. Sessink; Winette T. A. van der Graaf;;Judith B.
Prins;;Petronella B. Ottevanger, 2017-06-15. “A Specific Distress Cutoff Score Shortly After Breast Cancer Diagnosis,”Cancer Nursing, E35-E40.