Open Access
Research article
Self-medication with over-the-counter drugs and complementary
medications in South Australia's elderly population
Lynn Yeen Goh
1, Agnes I Vitry*
1, Susan J Semple
1, Adrian Esterman
2and
Mary A Luszcz
3Address: 1Sansom Institute, University of South Australia, Adelaide, South Australia, Australia, 2School of Nursing and Midwifery, University of
South Australia, Adelaide, South Australia, Australia and 3School of Psychology and Flinders Center for Aging Studies, Flinders University, South
Australia, Australia
Email: Lynn Yeen Goh - lynnyeen@yahoo.co.uk; Agnes I Vitry* - agnes.vitry@unisa.edu.au; Susan J Semple - susan.semple@unisa.edu.au; Adrian Esterman - adrian.esterman@unisa.edu.au; Mary A Luszcz - mary.luszcz@flinders.edu.au
* Corresponding author
Abstract
Background: A number of surveys have examined use of complementary and alternative medicines (CAM) in Australia. However, there are limited Australian data on use of CAM and over-the-counter (OTC) medicines in the elderly population. The main aims of this study were to examine self-medication practices with CAM and OTC medicines among older Australians and variables associated with their use.
Methods: The Australian Longitudinal Study of Ageing (ALSA) is an ongoing multidisciplinary prospective study of the older population which commenced in 1992 in South Australia. Data collected in 4 waves of ALSA between 1992 and 2004 were used in this study with a baseline sample of 2087 adults aged 65 years and over, living in the community or residential aged care. OTC medicines were classified according to the World Health Organization Anatomical Therapeutic Chemical (ATC) classification. CAM were classified according a modified version of the classification adopted by the Therapeutics Goods Administration (TGA) in Australia.
Results: The prevalence of CAM or OTC use ranged from 17.7% in 2000-2001 to 35.5% in 2003-2004. The top classes of CAM and OTC medicines used remained relatively constant over the study period. The most frequent classes of CAM used were vitamins and minerals, herbal medicines and nutritional supplements while the most commonly used OTC were analgesics, laxatives and low dose aspirin. Females and those of younger age were more likely to be CAM users but no variable was associated with OTC use.
Conclusion: Participants seemed to self-medicate in accordance with approved indications, suggesting they were informed consumers, actively looking after their own health. However, use of analgesics and aspirin are associated with an increased risk of adverse drug events in the elderly. Future work should examine how self-medication contributes to polypharmacy and increases the risk of adverse drug reactions.
Published: 11 November 2009
BMC Complementary and Alternative Medicine 2009, 9:42 doi:10.1186/1472-6882-9-42
Received: 30 June 2009 Accepted: 11 November 2009
This article is available from: http://www.biomedcentral.com/1472-6882/9/42
© 2009 Goh et al; licensee BioMed Central Ltd.
Background
In Australia, the proportion of adults over the age of 65 in 2005 was 13% and this figure is expected to more than double by 2051. South Australia has the highest percent-age of people percent-aged 65 and over of all Australian states and territories, and this age group is expected to make up 26.5% of the state's population by 2031[1].
Increasing age is associated with increased prevalence of chronic medical conditions [2], a higher number of med-icines used, and a higher demand for all medical services, including alternative services [3,4]. High levels of self-medication practices with over-the-counter (OTC) medi-cines and complementary and alternative medications (CAM) have been reported in Australia and comparable countries [5-9]. The most extensive survey of the South Australian population in 2004 found that CAMs were used by 52.2% of the respondents with the greatest use in better-educated, higher income, women in the 25-44 years of age group living in a metropolitan area [6]. Use of OTC drugs and CAM in the elderly is of particular interest because several variables associated with old age such as polypharmacy, multiple comorbid illnesses and physio-logical changes, can increase the risk of adverse drug reac-tions. Most research on use of CAM and OTC medicines has focused on groups of people with specific chronic conditions. The use of CAM and OTC drugs in the general elderly population remains under-studied internation-ally.
The Australian Longitudinal Study of Ageing (ALSA) is an ongoing multidisciplinary prospective study of the older population which commenced in 1992 in South Aus-tralia. People initially recruited in the study were re-inter-viewed at multiple time points and ten waves of data collection have been carried out to date. An earlier assess-ment showed that, at baseline, more than one quarter of the participants were taking at least five medications con-currently [10]. One third of the participants were using non-prescription medications in combination with pre-scribed medicines. Our study aimed to examine self-med-ication practices among older Australians, to ascertain the most commonly used non-prescription medications and variables shown in previous research to be associated with their use (i.e. age, gender, education, income and health).
Methods
ALSA data were used in this study. Methods for inclusion of subjects and survey tools have been described in detail previously [10]. In brief, subjects aged 65 years and over were randomly drawn from the South Australian Electoral Roll. The sample was stratified by age and gender. In this report, 'age' is dichotomized as 65-79 years or more than 80 years of age. Categories for the other background vari-ables of interest are shown in Table 1. Comprehensive
personal interviews were performed in wave 1 (1992-1993), wave 3 (1994-1995), wave 6 (2000-2001) and wave 7 (2003-2004). Participants were asked about all medicines that they had taken or were supposed to take in the last two weeks. For each medicine, the drug name, dose, duration of treatment, indication for use, whether it was prescribed by a doctor and the reason for use was asked. Reasons for use were grouped a posteriori into cat-egories specific to the type of products. Participants were also asked to show the medicine container to the inter-viewer.
OTC medicines were classified according to the World Health Organization Anatomical Therapeutic Chemical (ATC classification). Self-reported OTC medicines belonged to ten ATC categories: analgesics, laxatives, anti-thrombotic agents, antacids, cough and cold preparations, antihistamines, dermatologicals, throat preparations, nasal preparations and antidiarrhoeals. CAM were classi-fied according to the classification adopted by the Thera-peutics Goods Administration (TGA) in Australia [11]. The TGA classification was modified to exclude aromath-erapy products (no reports) and to include two additional categories, probiotics and combination products to account for those medicines containing multiple ingredi-ents that fell into different classes of CAM. The final CAM classification included seven categories: herbal medicines, traditional medicines (products identified as those used in a specific traditional medical system such as Traditional Chinese Medicine), vitamins and minerals, nutritional supplements, homeopathic medicines, probiotics and combination products.
The most common variables associated with use of CAM or OTC medicines were identified through a literature review of relevant studies published between 1985 and 2007. Relevant variables available in the ALSA dataset included age, gender, education level, income level and self-rated health. Pearson's chi-square tests were carried out to determine the statistical significance of the associa-tion between use of CAM and OTC medicines and the var-iables selected. Data were analysed using the Statistical Package for Social Sciences (SPSS) version 14.0. This study was approved by the Ethics Committee of the University of South Australia.
Results
Characteristics of participants
At baseline there were approximately equal numbers of men and women and 84% reported leaving school at age fourteen or over. The percentage of female participants increased from 49.4% in 1992-1993 to 62.2% in 2003-2004. The percentage of participants over the age of 80 years increased from 41.4% in the 12-year period between 1992-1993 to 90.3% in 2003-2004 [Table 1]. Across the waves, the majority of participants rated their own health as good, very good or excellent and about of third of par-ticipants rated their health as fair or poor [Table 1].
Prevalence of self-medication
The range of participants reporting using either at least one CAM or one OTC medicine varied from 19.4% in 1992-1993 to 35.5% in 2003-2004 [Table 2]. Corre-spondingly, when examined separately, the use of CAM and OTC medicines varied from 12.8% to 17.0%, and 8.6% to 24.2% respectively over this time period.
[image:3.612.58.558.98.441.2]Top classes of CAM and OTC use were relatively constant across the waves [Table 3]. Vitamins and minerals were
Table 1: Characteristics of participants at waves 1, 3, 6 and 7
1992-1993 1994-1995 2000-2001 2003-2004
Wave 1 N = 2087 Wave 3 N = 1679 Wave 6 N = 791 Wave 7 N = 487
Variable N % N % N % N %
Age (years)
65-79 1224 58.6 893 53.2 216 27.3 47 9.7
80+ 863 41.4 786 46.8 575 72.7 440 90.3
Gender
Female 1031 49.4 854 50.9 456 57.6 303 62.2
Male 1056 50.6 825 49.1 335 42.4 184 37.8
Education
(Age when left school)
<14 years 336 16.3 262 15.4 105 13.3 65 13.4
≥ 14 years 1725 83.7 1399 84.6 684 86.7 420 86.6
Missing 26 18 2 2
Tertiary education
Yes 700 33.9 570 34.2 278 35.2 177 36.5
No 1367 66.1 1096 65.8 512 64.8 308 63.5
Missing 20 13 1 2
Income Level
<$12,000 686 35.5 559 40.9 165 30.3 116 35.6
$12,000 - $30,000 1083 56.1 719 52.6 312 57.4 146 44.8
>$30,000 161 8.3 90 6.6 67 12.3 64 19.6
Missing 157 311 247 161
Self-rated health
Excellent 191 9.2 129 8.2 64 9.8 16 3.9
Very Good 599 28.8 410 25.9 181 27.7 85 20.5
Good 633 30.4 534 33.8 224 34.3 171 41.2
Fair 477 22.9 403 25.5 147 22.5 113 27.2
Poor 181 8.7 106 6.7 37 5.7 30 7.2
Missing 6 97 138 72
Missing data are not included in the calculation of the percentages
Table 2: Number of participants using either CAM and OTC medicines
1992-1993 1994-1995 2000-2001 2003-2004
Wave 1 N = 2087 Wave 3 N = 1679 Wave 6 N = 791 Wave 7 N = 487
Variable N % N % N % N %
CAM or OTC1 404 19.4 460 27.4 140 17.7 173 35.5
OTC only 268 12.8 278 16.6 79 10.0 83 17.0
CAM only 180 8.6 241 14.4 71 9.0 118 24.2
[image:3.612.54.553.624.718.2]the most commonly used CAM products at all waves (5.4% to 14.0%). This was followed by herbal medicines (2.4% to 5.5%) and nutritional supplements (1.6% to 7.6%). Most of the combination products (2.1% to 5.1%) included different herbal combinations. Multivitamins and vitamin C were the most commonly used vitamins. Garlic, celery and gingko biloba were the most commonly
used herbal medicines and cod liver oil was the most pop-ular nutritional supplement [Table 4].
[image:4.612.57.553.98.375.2]Analgesics were the most common class of OTC drugs at all waves (5.4 to 8.8%), followed by laxatives (2.0% to 5.1%) and antithrombotic agents (low dose aspirin) (1.6% to 2.6%). The most commonly used analgesic was
Table 3: Prevalence of use of CAM and OTC medicines
1992-1993 1994-1995 2000-2001 2003-2004
Wave 1 N = 2087 Wave 3 N = 1679 Wave 6 N = 791 Wave 7 N = 487
Classes of CAM/OTC N % N % N % N %
CAM Vitamins & minerals 113 5.4 155 9.2 53 6.7 68 14.0
Herbal medicines 50 2.4 69 4.1 23 2.9 27 5.5
Nutritional supplements 34 1.6 54 3.2 26 3.3 37 7.6
Homeopathic medicines 4 0.2 5 0.3 0 0.0 1 0.2
Probiotics 3 0.1 4 0.2 0 0.0 0 0.0
Combination products 43 2.1 49 2.9 9 1.1 25 5.1
OTC Analgesics 112 5.4 127 7.6 44 5.6 43 8.8
Laxatives 89 4.3 76 4.5 16 2.0 25 5.1
Antithrombotic agents 34 1.6 43 2.6 17 2.1 10 2.1
Antacids 19 0.9 14 0.8 1 0.1 6 1.2
Cough & cold preps 16 0.8 18 1.1 0 0.0 5 1.0
Antihistamines 7 0.3 4 0.2 2 0.3 1 0.2
Dermatologicals 3 0.1 4 0.2 1 0.1 0 0.0
Throat preparations 4 0.2 0 0.0 0 0.0 0 0.0
Nasal preparations 2 0.1 5 0.3 0 0.0 0 0.0
Antidiarrhoeals 2 0.1 1 0.1 0 0.0 0 0.0
Other1 11 0.5 16 1.0 4 0.5 4 0.8
Unknown2 11 0.5 10 0.6 3 0.4 12 2.5
The percentages show the proportions of participants reporting to use at least one of the classes of CAM or OTC medicines
1 Other CAM and OTC classes that were less commonly reported
2 Non-prescription medicines of unknown ingredients that could not be classified
Table 4: Most commonly used CAM
1992-1993 1994-1995 2000-2001 2003-2004
Wave 1 N = 180 Wave 3 N = 241 Wave 6 N = 71 Wave 7 N = 118
CAM N % N % N % N %
Vitamins and minerals
Multivitamins 40 22.2 57 23.7 22 31 33 28
Vitamin C 32 17.8 47 19.5 8 11.3 23 20.3
Vitamin B 19 10.6 31 12.9 8 11.3 5 4.2
Vitamin E 18 10 43 17.8 16 22.5 9 7.6
Herbal medications
Garlic 24 13.3 22 9.1 3 4.2 2 1.7
Celery 13 7.2 18 7.5 3 4.2 1 0.8
Gingko biloba 2 1.1 5 2.1 10 14.1 9 7.6
Nutritional supplements
Cod liver oil 22 12.2 37 15.4 9 12.7 11 9.3
Fish oil 6 3.3 5 2.1 3 4.2 8 6.8
Glucosamine 0 0 0 0 4 5.6 10 8.5
[image:4.612.58.553.521.719.2]paracetamol, while laxatives were mostly senna, docusate or a mixture of both.
Variables affecting self-medication
OTC use was not associated with age, gender, education level and tertiary education in any of the four waves [Table 5]. Although there was a statistically significant associa-tion between income and OTC use in waves 3 and 6, the pattern of results was inconsistent for the different waves. The same was true for self-rated health.
CAM use was associated with age and gender [Table 6]. The younger elderly people were more likely to use CAM than the older group (80 years and over) in all four waves. The difference in use remained constant over time, with those age 65 to 79 years old being 1.5 to 1.6 times more likely to use CAM than those aged 80 years or more. Females were also found to be more likely users of CAM in waves 1, 3 and 6 (the results were not statistically sig-nificant in wave 7). CAM use was not associated with edu-cation level, tertiary eduedu-cation, income level and
self-rated health in any wave except in wave 7 where use of CAM was higher in participants with tertiary education.
Reasons for using CAM and OTC medicines
The main reasons for using analgesics were headache and pain (Table 7). Low dose aspirin was reported to be used for blood thinning and/or stroke prevention by most par-ticipants (Table 8). However, some respondents reported unlikely reasons for use such as for lowering cholesterol levels, hypertension and for sleep.
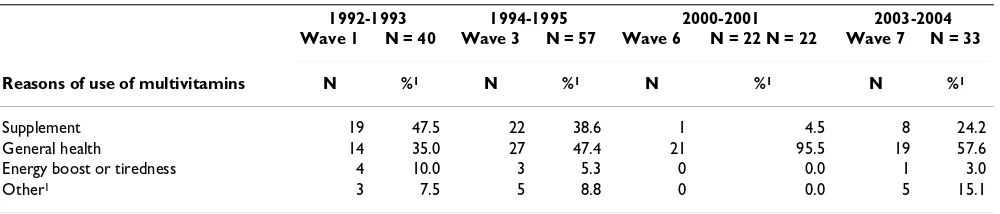
The most common reasons for use of multivitamins were supplementation and maintenance of general health (Table 9). Vitamin C was predominantly used to ward off colds, to boost the immune system and for general health maintenance across all four waves (Table 10).
Discussion
[image:5.612.55.553.357.724.2]Up to a third of older participants in the current study used either CAM or OTC medicines. The study differed from Australian studies conducted earlier in several ways
Table 5: Prevalence of OTC use across variables of interest
1992-1993 1994-1995 2000-2001 2003-2004
Wave 1 N = 268 Wave 3 N = 278 Wave 6 N = 79 Wave 7 N = 83
Variable N % N % N % N %
Age (years)
65-79 159 13.0 148 16.6 27 12.5 8 17.0
80+ 109 12.6 130 16.5 52 9.0 75 17.0
P value 0.809 0.985 0.149 0.997
Gender
Female 146 14.2 149 17.4 52 11.4 51 16.8
Male 122 11.6 129 15.6 27 8.1 32 17.4%
P value 0.075 0.318 0.121 0.873
Education
(Age when left school)
<14 years 47 14.0 47 17.9 14 13.3 11 16.9
≥ 14 years 220 12.8 227 16.2 65 9.5 72 17.1
P value 0.538 0.493 0.223 0.965
Tertiary education
Yes 98 14.0 101 17.7 27 9.7 31 17.5
No 170 12.4 176 16.1 52 10.2 52 16.9
P value 0.316 0.388 0.843 0.859
Income Level
<$12,000 89 13.0 97 17.4 26 15.8 23 19.8
$12,000 - $30,000 137 12.7 111 15.4 26 8.3 24 16.4
>$30,000 25 15.5 27 30.0 5 7.5 8 12.5
P value 0.598 0.003 0.029 0.446
Perceived Health
Excellent 19 9.9 17 13.2 4 6.3 4 25.0
Very Good 63 10.5 58 14.1 25 13.8 13 15.3
Good 96 15.2 105 19.7 21 9.4 25 14.6
Fair 73 15.3 73 18.1 18 12.2 24 21.2
Poor 17 9.4 14 13.2 4 10.8 6 20.2
P value 0.018 0.097 0.438 0.536
Table 6: Prevalence of CAM use across variables of interest
1992-1993 1994-1995 2000-2001 2003-2004
Wave 1 N = 180 Wave 3 N = 241 Wave 6 N = 71 Wave 7 N = 173
Variable N % N % N % N %
Age (years)
65-79 122 10.0 152 17.0 27 12.5 17 36.2
80+ 58 6.7 89 11.3 44 7.7 101 23.0
P value 0.009 0.001 0.034 0.044
Gender
Female 102 9.9 142 16.6 53 11.6 81 26.7
Male 78 7.4 99 12.0 18 5.4 37 20.1
P value 0.041 0.007 0.002 0.098
Education
(Age when left school)
<14 years 30 8.9 39 14.9 10 9.5 16 24.6
≥ 14 years 149 8.6 200 14.3 61 8.9 102 24.3
P value 0.862 0.803 0.840 0.954
Tertiary education
Yes 63 9.0 92 16.1 27 9.7 56 31.6
No 116 8.5 149 13.6 44 8.6 62 20.1
P value 0.694 0.161 0.600 0.004
Income Level
<$12,000 52 7.6 82 14.7 18 10.9 33 28.4
$12,000 - $30,000 101 9.3 120 16.7 29 9.3 34 23.3
>$30,000 12 7.5 13 14.4 10 14.9 12 18.8
P value 0.385 0.581 0.385 0.326
Self-rated health
Excellent 16 8.4 17 13.2 12 18.8 7 43.8
Very Good 58 9.7 64 15.6 17 9.4 24 28.2
Good 56 8.8 90 16.9 23 10.3 43 25.1
Fair 38 8.0 53 13.2 11 7.5 23 20.4
Poor 12 6.6 11 10.4 5 13.5 6 20.0
P value 0.722 0.312 0.152 0.268
The percentages are calculated over the total number of participants in each category of the variable of interest
Table 7: Reasons for use of analgesics
1992-1993 1994-1995 2000-2001 2003-2004
Wave 1 N = 112 Wave 3 N = 127 Wave 6 N = 44 Wave 7 N = 43
Reasons of use of analgesics N % N % N % N %
Headache 35 31.8 41 32.3 5 11.4 6 14
Specific pain 19 17.3 16 12.6 4 9.1 5 11.6
General pain 18 16.4 26 20.5 25 56.8 22 51.2
Other 21 19.1 25 19.7 5 11.4 3 7.0
Arthritic pain 11 10.0 15 11.8 2 4.5 4 9.3
Multiple reasons 6 5.5 4 3.1 3 6.8 3 7.0
Missing 2 0 0 0
[image:6.612.61.553.583.720.2][6,12-14]. Firstly, this study focused on a targeted popula-tion, namely elderly people aged 65 and older in South Australia. The study also sought to provide a broader insight into the self-medication practices of the elderly in examining use of both CAM and OTC medicines and rea-sons for use.
Fewer elderly people in our survey reported use of OTC medicines (10% to 17%) compared to a range of 31% to 97% in other surveys [15-19]. However, these surveys were carried out in the United States (US). The discrepan-cies observed may be explained by differences in the defi-nition of OTC medicines and differences in subsidised accessibility to prescription medicines between Australia and the US. Non-prescription vitamins and minerals are considered as OTC medicines by the US Food and Drug Administration (FDA) and CAM by the TGA [11,20]. Fur-thermore, there is no national subsidisation scheme for pharmaceuticals in the US while in Australia, residents may prefer to get most medicines on prescription due to low co-payment fees. This is particularly relevant for med-icines such as paracetamol which is widely used in both countries and which is available as a subsidised prescrip-tion medicine only in Australia.
The reported use of CAM (8.6% to 24.2%) in our study was lower than in previous Australian studies (37% to 58%) [6,14,21-23]. Several differences in the methods used may account for this variation. All but two of the pre-vious studies included alternative services such as
acu-puncture, massage and chiropractic in their definition of CAM. The time interval over which participants reported has also varied. A 2004 survey in South Australia found 37% of people older than 65 years were CAM users but participants were asked whether they had used any CAM over the past year [6]. A study with a similar definition of use to this current study in terms of time interval and products surveyed reported 43% of CAM use [21]. How-ever, the format of the interview where examples of each type of supplement were provided may have prompted more reports of CAM use [21]. A recent study in Iceland was conducted using similar methods to ALSA where simultaneous recording of herbal and dietary supple-ments (HADS) and prescription medicine use was carried out [24]. This study reported a prevalence of 80% of HADS use among their participants.
The top three classes of OTC drugs used by our respond-ents did not change between 1992 and 2004 and were similar to those described previously in the 1989-1990 Australian National Health Survey [25]. Analgesics were the most commonly used class of OTC medicines, pre-dominantly paracetamol. Painful chronic conditions are prevalent in the elderly and therefore, many are amenable to treatment by OTC analgesics. Other international stud-ies have also found analgesics to be the most commonly reported OTC class, though aspirin and non-steroidal anti-inflammatory drugs (NSAIDs) were more commonly used than paracetamol [7,15,18,19]. It is unclear whether in these studies all aspirin use was grouped under
analge-Table 8: Reasons for use of antithrombotic agents
1992-1993 1994-1995 2000-2001 2003-2004
Wave 1 N = 34 Wave 3 N = 43 Wave 6 N = 17 Wave 7 N = 10
Reasons of use of antithrombotic agents N % N % N % N %
Blood thinning &/or stroke prevention 27 87.0 36 85.7 16 94.1 6 60.0
Unlikely reasons 4 12.9 5 11.6 1 5.9 4 40.0
Other 0 0.0 1 2.3 0 0.0 0 0.0
Missing 3 1 0 0
[image:7.612.56.554.98.206.2]The percentages are calculated over the number of participants that reported use of antithrombotic agents
Table 9: Reasons for use of multivitamins
1992-1993 1994-1995 2000-2001 2003-2004
Wave 1 N = 40 Wave 3 N = 57 Wave 6 N = 22 N = 22 Wave 7 N = 33
Reasons of use of multivitamins N %1 N %1 N %1 N %1
Supplement 19 47.5 22 38.6 1 4.5 8 24.2
General health 14 35.0 27 47.4 21 95.5 19 57.6
Energy boost or tiredness 4 10.0 3 5.3 0 0.0 1 3.0
Other1 3 7.5 5 8.8 0 0.0 5 15.1
The percentages are calculated over the number of participants that reported use of multivitamins
[image:7.612.57.557.604.711.2]sics but in our study, we distinguished between aspirin used at low dose as an antiplatelet agent or at a higher dose as an analgesic agent based on the medicine strength and indication of use. Low dose aspirin was found to be the third most commonly reported class of OTC drugs in our study.
Vitamins and minerals, herbal medicines and nutritional supplements were the three most common classes of CAM reported across all waves. This is consistent with findings reported in other Australian studies [9,21,22]. Multivita-mins accounted for about one-third of all CAM used across the waves, followed by Vitamins C, B and E in agreement with the results of previous studies [21-26]. The most common herbal product to be reported in this study was garlic, also in agreement with other studies [21,26], with gingko biloba, marketed for age-related memory impairment, gaining popularity in the latest waves. Cod liver oil was the most popular nutritional sup-plement across all waves, with glucosamine use emerging as a treatment for arthritis after 2001, consistent with Brownie's prediction in 2000 [21]. One reason for the more recent emergence of this product in the study may be the shift towards inclusion of this product as part of conventional care.
[image:8.612.53.554.98.216.2]None of the demographic variables tested, age, gender, education, tertiary education, income level and self-rated health was found to be associated with OTC use. The rela-tionship of age and OTC use is equivocal in the literature [7,16,27,28]. Greater OTC use was observed in females in the US studies that included multivitamin use [7,16,27,28]. Greater educational attainment and poorer self-rated health have been associated with higher use of OTC in some studies [15,16,27].
Female gender and a younger age were the only variables found to be associated with CAM use in our study, in agreement with previous studies [12,14,15,21,23,26,29]. Possible explanations for CAM use were not available in the data because ALSA participants were not asked about
attitudinal or psychological factors involved in their choice of medicines. A literature review of variables reported to influence the use of complementary medi-cines by consumers suggested that the emergence of post-modern values provided the best explanation of consumers' interest in CAM[9]. Postmodern values involved "a new set of beliefs about nature, science, holis-tic medicine, rejection of authority, individual responsi-bility and consumerism" [9]. A recent survey of attitudes of Australian consumers to complementary medicines found that many consumers saw their CAM use as "natu-ral" and part of a holistic view of health [30].
Reasons reported for using OTC medicines were consist-ent with the indications approved by the Australian med-icines agency with the exception of low-dose aspirin for which between 5.9% and 40.0% of participants reported unlikely reasons. The most common reasons for use of multivitamins were supplementation and maintenance of general health. In a 2004 Australian study that examined beliefs in CAM users, most respondents had no specific medical reason for using CAM but believed they would help their general health. Promotion of general health and prevention of illness were also found the main varia-bles driving the use of CAM in other international studies [9]. Some CAM could also be used for the treatment of symptoms such as glucosamine for arthritis.
There were some potential limitations to our study. Although there was an apparent overall increase of partic-ipants reported use of at least one CAM or OTC from 19.4% at baseline to 35.5% by 2004, we did not attempt to assess statistically the time trend given the large amount of missing data due to the high attrition level at wave 7. Furthermore, slight variations in medication data collec-tion methods in waves 3 and 7, and a higher proporcollec-tion of women in wave 7 could partly explain the higher use of CAM and OTC medicines observed at this wave. Although many of the ALSA participants were from non-English speaking backgrounds, fluent English was essential and thus, the findings may not be a true reflection of the use
Table 10: Reasons for use of vitamin C
1992-1993 1994-1995 2000-2001 2003-2004
Wave 1 N = 32 Wave 3 N = 47 Wave 6 N = 8 Wave 7 N = 23
Reasons of use of Vitamin C N % N % N % N %
Cold prevention and immune stimulation 13 43.3 14 30.4 0 0.0 8 34.8
General health 7 23.3 18 39.1 8 100 8 34.8
Supplement 6 20.0 7 15.2 0 0.0 3 13.0
Other1 4 13.3 7 15.2 0 0.0 4 17.4
Missing 2 1 0 0
The percentages are calculated over the number of participants that reported use of Vitamin C
of CAM or OTC in non-English speaking elderly commu-nity in a multi-cultural country. Finally, but like most other studies, the data we gathered was self-reported. However, unlike other studies, respondents were asked to show the medicine containers, even so some medicines could have been overlooked. The reasons for use of CAM were categorized from self-reported reasons by consumers and the categories were set up to reflect as closely as pos-sible the words used by the consumers themselves. Then, it is not possible to infer from this data whether use of CAM for "general health" or as "supplement" reflect dif-ferent beliefs as regards the therapeutic effect of CAM. The question of whether consumers perceived themselves to be "deficient" in a vitamin or believe that supra-therapeu-tic doses would improve physical or mental performance cannot be determined from the data collected in the ALSA database.
This study focused on examining the types of non-pre-scription medications used by older Australians and the association between use and various demographic and health-related factors. Further work is needed to examine how self-medication amongst older people contributes to polypharmacy and increases the risk of adverse drug reac-tions. Use of NSAIDs and aspirin, for example, are associ-ated with an increased risk of adverse drug events, hospitalization and death, with the elderly being particu-larly vulnerable [31]. Some OTC medicines may also have severe interactions with prescribed medicines [32].
Conclusion
Self-medication among the ALSA respondents ranged from 18% to 36% between 1992 and 2004. The most fre-quent classes of CAM were vitamins and minerals, herbal medicines and nutritional supplements, with younger individuals and women more likely to use them. For OTC medicines, the most commonly used were analgesics, lax-atives and low dose aspirin. Use of OTC medicines seemed to be done in accord with indications officially approved by the Australian medicine agency. Future work should examine risks associated with the concomitant use of CAM, prescription and OTC medicines.
List of abbreviations
ABS: Australian Bureau of Statistics; AIHW: Australian Institute of Health and Welfare; LSA: Australian Longitu-dinal Study of Ageing; ASMI: Australian Self-Medication Industry; ATC: Anatomical Therapeutic Chemical; CAM:
Complementary and Alternative Medicines; FDA: US
Food and Drug Administration; HADS: Herbal and Die-tary Supplements; HIC: Health Insurance Commission;
NPS: National Prescribing Service; NSAIDs: Non-Steroi-dal Anti-Inflammatory Drugs; OTC: Over-The-Counter;
TGA: Therapeutic Goods Administration.
Competing interests
The authors declare that they have no competing interests.
Authors' contributions
LYG wrote the research proposal, did the review of the lit-erature, performed the analysis and wrote the first draft of the manuscript. AV and SS designed the study, partici-pated in the analysis and the interpretation of the data and reviewed the manuscript. ML conducted the ALSA study, provided raw data and reviewed the manuscript. All authors read and approved the final manuscript.
Acknowledgements
This study was supported by funding from a National Health and Medical Research Council/Australian Research Council Ageing Well Ageing Produc-tively (AWAP) Program grant (APP ID 401832). We acknowledge the con-tribution of all the Chief Investigators who assisted with the preparation of this study: Prof. Andrew Gilbert, Associate Prof. Libby Roughead, Prof. Robyn McDermott, Prof. Phil Ryan and Dr. Sepehr Shakib. We thank the ALSA participants, the late Prof Gary Andrews and other staff from the Flinders (University) Centre for Ageing Studies for conducting the study and providing raw data and advice. Grants from the US National Institute of Aging (No. AG08523-02) and the National Health and Medical Research Council (No. 229933) funded the waves included in this report.
References
1. Australian Bureau of Statistics: Australian Demographic Statis-tics: June 2007. Canberra: Australian Bureau of Statistics; 2007. 2. Britt HC, Harrison CM, Miller GC, Knox SA: Prevalence and
pat-terns of multimorbidity in Australia. Med J Aust 2008, 189(2):72-77.
3. Willison KD, Andrews GJ: Complementary medicine and older people: past research and future directions. Complement Ther Nurs Midwifery 2004, 10(2):80-91.
4. Foster DF, Phillips RS, Hamel MB, Eisenberg DM: Alternative med-icine use in older Americans. J Am Geriatr Soc 2000, 48(12):1560-1565.
5. Eisenberg DM, Davis RB, Ettner SL, Appel S, Wilkey S, Van Rompay M, Kessler RC: Trends in alternative medicine use in the United States, 1990-1997: results of a follow-up national sur-vey. JAMA 1998, 280(18):1569-1575.
6. MacLennan AH, Myers SP, Taylor AW: The continuing use of complementary and alternative medicine in South Australia: costs and beliefs in 2004. Med J Aust 2006, 184(1):27-31. 7. Hanlon JT, Fillenbaum GG, Ruby CM, Gray S, Bohannon A:
Epidemi-ology of over-the-counter drug use in community dwelling elderly: United States perspective. Drugs Aging 2001, 18(2):123-131.
8. Bradley C, Blenkinsopp A: Over the counter drugs. The future for self medication. BMJ 1996, 312(7034):835-837.
9. Easton K: Complementary medicines: attitudes and informa-tion needs of consumers and healthcare professionals. Syd-ney: National Prescribing Service Ltd; 2007.
10. Luszcz M, Giles L, Eckermann S, Edwards P, Browne-Yung K, Hayles C, Trezise K, Andrews M: The Australian Longitudinal Study of Ageing: 15 years of ageing in South Australia. Adelaide: South Australian Department of Families and Communities; 2007. 11. The regulation of complementary medicines in Australia
-an overview [http://www.tga.gov.au/cm/cmreg-aust.htm] 12. MacLennan AH, Wilson DH, Taylor AW: The escalating cost and
prevalence of alternative medicine. Prev Med 2002, 35(2):166-173.
13. MacLennan AH, Wilson DH, Taylor AW: Prevalence and cost of alternative medicine in Australia. Lancet 1996, 347(9001):569-573.
14. Zhang AL, Xue CC, Lin V, Story DF: Complementary and alter-native medicine use by older Australians. Ann N Y Acad Sci
Publish with BioMed Central and every scientist can read your work free of charge "BioMed Central will be the most significant development for disseminating the results of biomedical researc h in our lifetime."
Sir Paul Nurse, Cancer Research UK
Your research papers will be:
available free of charge to the entire biomedical community
peer reviewed and published immediately upon acceptance
cited in PubMed and archived on PubMed Central
yours — you keep the copyright
Submit your manuscript here:
http://www.biomedcentral.com/info/publishing_adv.asp
BioMedcentral 15. Amoako EP, Richardson-Campbell L, Kennedy-Malone L:
Self-med-ication with over-the-counter drugs among elderly adults. J Gerontol Nurs 2003, 29(8):10-15.
16. Fillenbaum GG, Hanlon JT, Corder EH, Ziqubu-Page T, Wall WE Jr, Brock D: Prescription and nonprescription drug use among black and white community-residing elderly. Am J Public Health
1993, 83(11):1577-1582.
17. Hanlon JT, Fillenbaum GG, Burchett B, Wall WE Jr, Service C, Blazer DG, George LK: Drug-use patterns among black and nonblack community-dwelling elderly. Ann Pharmacother 1992, 26(5):679-685.
18. Lam A, Bradley G: Use of self-prescribed nonprescription med-ications and dietary supplements among assisted living facil-ity residents. J Am Pharm Assoc 2006, 46(5):574-581.
19. Stoehr GP, Ganguli M, Seaberg EC, Echement DA, Belle S: Over-the-counter medication use in an older rural community: the MoVIES Project. J Am Geriatr Soc 1997, 45(2):158-165.
20. Rheinstein PH: Prescription to over-the-counter drug switches. Am Fam Physician 1997, 56(4):1211-1214.
21. Brownie S: Predictors of dietary and health supplement use in older Australians. Aust J Adv Nurs 2006, 23(3):26-32.
22. Lentile CS, Sorensen L, Lemanski L, Roberts MS: Complementary medicines use by Australian veterans. J Pharm Pract Res 2005, 35(2):110-111.
23. Xue CC, Zhang AL, Lin V, Da Costa C, Story DF: Complementary and alternative medicine use in Australia: a national popula-tion-based survey. J Altern Complement Med 2007, 13(6):643-650. 24. Halldorsdottir V, Almarsdottir AB, Gudmundsson A, Nikulasdottir H, Harris TB, Launer L, Eirksdottir G, Gudnason V: Pattern and Prev-alence of herbal and dietary supplements in an elderly cohort: AGES-Reykjavik Study. Copenhagen: John Wiley & Sons Ltd; 2008.
25. Australian Bureau of Statistics: 1989-1990 National Health Sur-vey: summary of results. Canberra: Australian Bureau of Statis-tics; 1991.
26. Ness J, Cirillo DJ, Weir DR, Nisly NL, Wallace RB: Use of comple-mentary medicine in older Americans: results from the Health and Retirement Study. Gerontologist 2005, 45(4):516-524.
27. Stoller EP: Prescribed and over-the-counter medicine use by the ambulatory elderly. Med Care 1988, 26(12):1149-1157. 28. Sharpe TR, Smith MC, Barbre AR: Medicine use among the rural
elderly. J Health Soc Behav 1985, 26(2):113-127.
29. Astin JA, Pelletier KR, Marie A, Haskell WL: Complementary and alternative medicine use among elderly persons: one-year analysis of a Blue Shield Medicare supplement. J Gerontol A Biol Sci Med Sci 2000, 55(1):M4-9.
30. Williamson M, Tudball J, Toms M, Garden F, A G: Information use and needs of complementary medicines users. Sydney: National Prescribing Service Ltd; 2008.
31. Visser LE, Graatsma HH, Stricker BH: Contraindicated NSAIDs are frequently prescribed to elderly patients with peptic ulcer disease. Br J Clin Pharmacol 2002, 53(2):183-188.
32. Honig PK, Gillespie BK: Clinical significance of pharmacokinetic drug interactions with over-the-counter (OTC) drugs. Clin Pharmacokinet 1998, 35(3):167-171.
Pre-publication history
The pre-publication history for this paper can be accessed here: