doi:10.5194/hess-16-267-2012
© Author(s) 2012. CC Attribution 3.0 License.
Earth System
Sciences
Hydrological response of a small catchment burned by
experimental fire
C. R. Stoof1,2,3,4, R. W. Vervoort3, J. Iwema5, E. van den Elsen6, A. J. D. Ferreira2, and C. J. Ritsema1,6
1Land Degradation and Development Group, Wageningen University, Wageningen, The Netherlands 2CERNAS, Escola Superior Agr´aria de Coimbra. Bencanta, 3040-316 Coimbra, Portugal
3Faculty of Agriculture, Food & Natural Resources, The University of Sydney, Sydney, Australia 4Department of Biological and Environmental Engineering, Cornell University, Ithaca, NY, USA
5Hydrology and Quantitative Water Management Group, Wageningen University, Wageningen, The Netherlands 6Alterra Green World Research, Wageningen UR, Wageningen, The Netherlands
Correspondence to: C. R. Stoof (cathelijne.stoof@cornell.edu)
Received: 17 February 2011 – Published in Hydrol. Earth Syst. Sci. Discuss.: 26 April 2011 Revised: 19 January 2012 – Accepted: 20 January 2012 – Published: 2 February 2012
Abstract. Fire can considerably change hydrological
pro-cesses, increasing the risk of extreme flooding and erosion events. Although hydrological processes are largely affected by scale, catchment-scale studies on the hydrological im-pact of fire in Europe are scarce, and nested approaches are rarely used. We performed a catchment-scale experimental fire to improve insight into the drivers of fire impact on hy-drology. In north-central Portugal, rainfall, canopy intercep-tion, streamflow and soil moisture were monitored in small shrub-covered paired catchments pre- and post-fire. The shrub cover was medium dense to dense (44 to 84 %) and pre-fire canopy interception was on average 48.7 % of total rainfall. Fire increased streamflow volumes 1.6 times more than predicted, resulting in increased runoff coefficients and changed rainfall-streamflow relationships – although the in-crease in streamflow per unit rainfall was only significant at the subcatchment-scale. Fire also fastened the response of topsoil moisture to rainfall from 2.7 to 2.1 h (p= 0.058), and caused more rapid drying of topsoils after rain events. Since soil physical changes due to fire were not apparent, we suggest that changes resulting from vegetation removal played an important role in increasing streamflow after fire. Results stress that fire impact on hydrology is largely af-fected by scale, highlight the hydrological impact of fire on small scales, and emphasize the risk of overestimating fire impact when upscaling plot-scale studies to the catchment-scale. Finally, they increase understanding of the processes contributing to post-fire flooding and erosion events.
1 Introduction
Wildfires can increase a landscape’s vulnerability to major flooding and erosion events (Shakesby and Doerr, 2006). By removing vegetation cover, changing soil properties and in-ducing soil water repellency, fire can increase runoff which can lead to floods and erosion (Cerd`a and Robichaud, 2009). However, the impact of fire is largely affected by scale. Despite this scaling challenge, which is universal across all hydrological problems (Bl¨oschl and Sivapalan, 1995), catchment-scale studies on the hydrological impact of fire are generally only performed in Australia and the USA. Even though controlled fire experiments can give valuable insight into the drivers of fire-induced hydrological changes and ef-fects of scale, to date catchment-scale controlled fire ex-periments have not been performed and particularly nested approaches are rarely used.
Vegetation cover is an important factor in determining runoff and erosion risk. Its removal by fire increases rain-drop impact on the bare soil, and reduces storage of rainfall in the canopy, thus increasing the amount of effective rainfall. Moreover, the removal of vegetation can have major impact on soil moisture status. Exposure of the soil surface to atmo-spheric forcings can considerably increase soil evaporation, which is why vegetation cover is often identified as an im-portant factor protecting the soil from heating up and drying out (Hulbert, 1969; Stoof et al., 2011; Sumrall et al., 1991; White and Currie, 1983). The net change in soil moisture
is highly dependent on depth: the increase in soil evapora-tion can result in drier topsoil, in contrast to subsoils that can actually get wetter because of the marked reduction in plant transpiration (Silva et al., 2006). While this reduced deple-tion of soil water creates favorable condideple-tions for subsurface runoff, changes in topsoil moisture can considerably impact surface runoff in areas prone to soil water repellency because the degree of soil water repellency is strongly related to soil moisture content (Dekker et al., 2001; Leighton-Boyce et al., 2005; Stoof et al., 2011; Thwaites et al., 2006).
High soil temperatures during fire can additionally affect post-fire hydrological processes since the heat of fire can cause considerable damage to the soil system (Cerd`a and Robichaud, 2009; Stoof et al., 2010), Of particular impor-tance in post-fire hydrology is reduced infiltration resulting from, for instance: (1) possible pore-clogging by infiltrated ash (Woods and Balfour, 2008; Onda et al., 2008; Stoof et al., 2010), (2) development of soil water repellency during and after fire (DeBano, 2000b, Stoof et al., 2011), and (3) occurrence of surface sealing due to the increased exposure to raindrop impact (Larsen et al., 2009; Llovet et al., 2008). In addition, pronounced soil heating can reduce soil water retention capacity (Stoof et al., 2010) and also contribute to a changed post-fire rainfall runoff response.
Given the abovementioned changes in effective rainfall, evaporation, transpiration, water infiltration and retention, fire tends to increase the runoff coefficient, or the fraction of rainfall converted to runoff (Onda et al., 2008; Rosso et al., 2007; Rulli et al., 2006; Scott and Van Wyk, 1990). As a result, a number of studies have reported initial increases in overland flow (Beeson et al., 2001; Johansen et al., 2001; Prosser and Williams, 1998) and peakflow volumes after fire (Brown, 1972; Scott, 1993; Seibert et al., 2010), explain-ing the increased vulnerability of burned areas to floodexplain-ing events. Observed increases in annual and dry season stream-flow (Brown, 1972; Hibbert, 1967; McMichael and Hope, 2007) can furthermore contribute to flooding as a cumula-tive effect. Since the hydrological impact of fire is related to soil and vegetation changes, the longevity of the hydrological impact is related to the recovery time of soil and vegetation, which varies between ecosystems and can be as rapid as a few years but also as long as many decades (Shakesby and Doerr, 2006).
As mentioned, hydrological processes are highly affected by scale, both in burned and unburned systems (Bl¨oschl and Sivapalan, 1995; Shakesby and Doerr, 2006; Van der Velde et al., 2011). Due to the effects of mixing and filter-ing (Skøien et al., 2003) and reduced hydrological connec-tivity at larger scales (Bracken and Croke, 2007; Cammer-aat, 2002), changes observed at the plot-scale tend to over-estimate changes occurring at the hillslope- or catchment-scale (e.g. Doerr et al., 2003; Prosser and Williams, 1998). For example, increased patchiness and storage at the catch-ment scale (Ferreira et al., 1997) can facilitate infiltration of runoff downslope, which reduces overland- and streamflow
volumes. Because of the pronounced effect of scale on post-fire hydrology, post-fire effects on flooding risk are best assessed at the catchment scale. Yet, as previously noted, catchment scale hydrological studies assessing fire impact are scarce (Shakesby et al., 2006; Shakesby, 2011).
Although controlled fire experiments are a useful tool for assessment of fire impact in the field, such experiments have to date been restricted mostly to plot and hillslope scales. As a result, (small) catchment-scale fire studies are limited to impact assessment of accidental wildfires in previously or actively monitored watersheds (e.g. Brown, 1972; Meixner and Wohlgemuth, 2003; Scott, 1993), or post-fire assessment of the hydrology of burned catchments (Mayor et al., 2007; Moody and Martin, 2001). In both cases, knowledge of the degree of soil heating during the fire and subsequent impact on soil properties is unknown, thus hindering assessment of all factors contributing to hydrological change. Moreover, despite the high fire occurrence in the European Mediter-ranean (Moreira et al., 2001; Pausas, 2004), catchment-scale wildfire studies have mostly been conducted in the USA (Gottfried et al., 2003; Meixner and Wohlgemuth, 2003; Nasseri, 1989; Seibert et al., 2010), South Africa (Scott and Van Wyk, 1990; Scott, 1993, 1997) and Australia (Brown, 1972; Langford, 1976; Prosser and Williams, 1998), and at just two locations in the European Mediterranean (Lavabre et al., 1993; Mayor et al., 2007). Better understanding of the hydrological impact of fire at the catchment-scale can im-prove understanding and therefore possibly prediction of the risk of flooding in burned areas.
The purpose of the present study was to evaluate the im-pact of fire on hydrological processes and the causes of any changes at the small catchment scale. While investigation of streamflow response to fire can be studied with a solely hy-drologic approach that compares streamflow changes in mul-tiple catchments (see for instance Scott, 1993 and Kuczera, 1987), improved understanding of the underlying processes requires a more interdisciplinary approach, joining the soil, water and fire sciences. In a region of Portugal seriously affected by fires and post-fire land degradation, we there-fore performed a catchment-scale experimental fire in a small catchment in which soils, fire and hydrology were intensively monitored (Stoof, 2011), to study the processes underlying fire-related increases in flooding and erosion risk. This paper focuses on the effects of the fire on (soil) hydrology and dis-cusses the effects of scale and the value of experimental fire research at the catchment scale. Because the greatest effects of fire on hydrology and erosion generally occur shortly af-ter fire (Ferreira et al., 2009), data analysis and discussion is limited to the short-term (≤1 yr) effects.
and to improve understanding of fire-induced hydrological changes, the effects of fire on streamflow and soil moisture were studied using paired catchments, and the importance of rainfall, canopy interception and soil moisture in streamflow generation was assessed. Soil water repellency dynamics were extensively studied throughout the course of the study, and discussed in a separate paper by Stoof et al. (2011).
2 Methods
2.1 Research catchments
The study area is located on the eastern slopes of the Serra da Lous˜a in north-central Portugal (Fig. 1). Precipitation occurs predominantly in winter, with the summer being a pronounced dry period with high wildfire risk. Both re-search catchments, Valtorto (burned, 9.7 ha) and the nearby Espinho (control, 4.9 ha) are characterized by an ephemeral stream and are similar in size, exposure, geology and veg-etation type (Table 1). Moreover, they lack the man-made terraces often found in (abandoned) valleys in this region, which increase soil water storage potential and thus affect streamflow response. Although the Valtorto catchment is nearly twice the size of the control Espinho catchment, pre-fire hydrological data shows that the hydrological processes are similar (Sect. 3).
Soils and vegetation are typical for the region. Soils are formed on schist or quartzite bedrock. They are generally shallow gravelly loamy sands (USDA, 1993), rich in organic matter, with considerable rock fragment content and cover (Table 1). The vegetation consists of dense heathland dom-inated by Erica sp, Ulex sp., Pterospartum tridentatum and Genista triacanthos, regenerated after wildfire burned both catchments in the summer of 1990 and a prescribed fire burned the Valtorto catchment in April 1996. Because of the longer time since the last fire, the vegetation in the Espinho catchment was slightly taller than that in the Valtorto catch-ment (Table 1). Moreover, because of this 1996 prescribed fire, an existing structure of fire breaks confined the burned area in the Valtorto catchment, which closely matched the shape and size of the topographical watershed defined using ArcGIS (Fig. 1c).
2.2 Experimental fire
The Valtorto catchment was burned by a high-intensity ex-perimental fire in winter 2009. The aim was to simulate a wildfire to the greatest extent possible within safety con-straints, in order to get a soil hydrological response similar to natural conditions. Details about how the fire was con-ducted, soil temperature measurements and soil impact as-sessment can be found in Stoof (2011). In short, the area was burned ten days after the last rainfall on the morning of 20 February 2009. Ring ignition was used to maximize con-vection and to reach the maximum potential fire intensity
un-der the prevailing weather conditions. No post-frontal flam-ing combustion was observed, which indicated that flame residence time was low. The fire varied spatially in inten-sity: it was similar in nature to a prescribed fire on the mid- to upper slopes of the catchment but reached a much higher intensity on the valley bottom. While flame tem-peratures reached∼700◦C and fire intensity in some places exceeded 15 000 kW m−1, shrubs were not completely con-sumed throughout the catchment (Fig. 1c) and soil temper-atures remained relatively low: although maximum soil sur-face temperature was locally as high as 800◦C, soils in the majority of the catchment remained below 100◦C. As a re-sult, soil hydrologic properties such as saturated hydraulic conductivity and soil porosity did not change significantly. However, overland flow resistance and soil surface roughness decreased significantly because of the fire and the post-fire exposure of the soil (Stoof, 2011).
2.3 Hydrological monitoring
A paired-catchment design was adopted in order to sepa-rate hydrological effects of the experimental fire from nat-ural hydrological variability. Pre- and post-fire time series of rainfall and streamflow were collected in the burned catch-ment (Valtorto) and in the unburned control catchcatch-ment (Es-pinho). Details of the methodology are given in the follow-ing paragraphs and summarized in Table 2. Effects of scale on post-fire hydrological processes were assessed using a nested approach. For this purpose, streamflow in the Valtorto catchment was not only monitored at the outlet of the main catchment, but also at the outlet of the 0.13 ha unbounded subcatchment halfway up the southeast slope (Fig. 1c). Fi-nally, topsoil moisture content and canopy interception were monitored in the Valtorto catchment only.
Hydrological monitoring started in August 2007 but due to frequent data logger failure, reliable streamflow and soil moisture data was only collected from May 2008 onwards (10 months before the fire). Replicate rain gauges and wa-ter level recorders were installed to ensure continuation of data collection in case of logger failure. In addition, all sen-sors and data loggers were removed from the catchment the day before the fire to prevent fire damage to the monitoring equipment. All equipment was consequently reinstalled the day after the fire.
2.3.1 Rainfall and potential evapotranspiration
Rainfall was recorded at 0.2 mm intervals using tipping bucket rain gauges (Table 2) mounted above the shrub canopy on 1.5 m-high metal stakes. Two rain gauges were installed in Valtorto, and one in Espinho. Because both rain gauges in Valtorto were highly correlated (r= 0.996, RSE 0.67 mm), the catchment rainfall was calculated as the hourly or daily average of the two gauges. Since instrument failure never occurred for both rain gauges at the same time, there
38
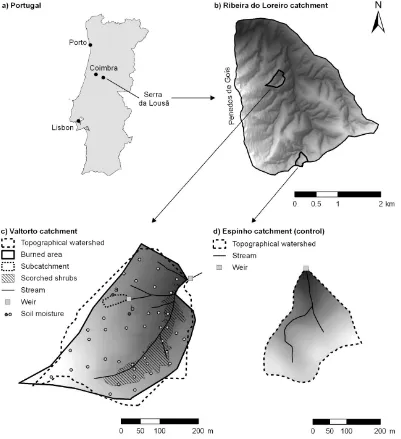
[image:4.595.100.501.63.502.2]Figure 1. Location of the Valtorto and Espinho catchments, showing the sampling design. Letters ‘a’ and ‘b’ in graph c indicate the soil moisture locations nearest to the subcatchment (see Fig. 10). Grey shading in graphs b, c and d represents elevation, enhanced using hillslope shading in ArcGIS.
Fig. 1. Location of the Valtorto and Espinho catchments, showing the sampling design. Letters “a” and “b” in graph (c) indicate the soil
moisture locations nearest to the subcatchment (see Fig. 10). Grey shading in graphs (b), (c) and (d) represents elevation, enhanced using hillslope shading in ArcGIS.
were no periods of missing data in Valtorto. Missing data in Espinho were filled using the Valtorto bottom gauge, which was slightly better correlated to the Espinho data (r= 0.975, RSE 2.1 mm) than the center gauge.
Potential evapotranspiration data was not measured in the catchment but is measured by the Portuguese Meteorological Institute in the city of Coimbra, 50 km NW of the research catchments. Data was acquired from ten-day meteorological bulletins published online at www.meteo.pt.
2.3.2 Canopy throughfall and interception
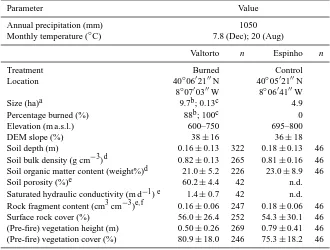
Table 1. Site and soil characteristics of the Valtorto and Espinho catchments, as mapped before the fire. Values are means over the number
of observations (n)±one standard deviation, and “n.d” stands for “not determined”.
Parameter Value
Annual precipitation (mm) 1050
Monthly temperature (◦C) 7.8 (Dec); 20 (Aug)
Valtorto n Espinho n
Treatment Burned Control
Location 40◦0602100N 40◦0502100N
8◦0700300W 8◦0604100W
Size (ha)a 9.7b; 0.13c 4.9
Percentage burned (%) 88b; 100c 0
Elevation (m a.s.l.) 600–750 695–800
DEM slope (%) 38±16 36±18
Soil depth (m) 0.16±0.13 322 0.18±0.13 46
Soil bulk density (g cm−3)d 0.82±0.13 265 0.81±0.16 46 Soil organic matter content (weight%)d 21.0±5.2 226 23.0±8.9 46
Soil porosity (%)e 60.2±4.4 42 n.d.
Saturated hydraulic conductivity (m d−1)e 1.4±0.7 42 n.d. Rock fragment content (cm3cm−3)e,f 0.16±0.06 247 0.18±0.06 46
Surface rock cover (%) 56.0±26.4 252 54.3±30.1 46
(Pre-fire) vegetation height (m) 0.50±0.26 269 0.79±0.41 46 (Pre-fire) vegetation cover (%) 80.9±18.0 246 75.3±18.2 46
aThe size of the topographical watershed was defined in ArcGIS, using a digital elevation model of the area and additional expert knowledge. The 10-m DEM was too coarse to
determine the size of the Valtorto subcatchment, which was instead determined in the field using a GPS.bValtorto main catchment.cValtorto subcatchment.d0–2.5 cm depth.e0–4
cm depth.fRock fragments are defined as particles>2 mm, volumetric values given correspond to a gravimetric rock fragment content of 0.407±0.108 and 0.458±0.108 g g−1 for Valtorto and Espinho, respectively.
Table 2. Monitoring equipment used in the Valtorto (burned) and Espinho (control) catchments. Since there was no power source available
in either catchment, all loggers were stand-alone, had individual batteries, and were downloaded manually.
# Monitoring sites
Parameter Valtorto Espinho Equipment/Probe and data logger Monitoring Time period
(burned) (control) interval
Rainfall 2 1 Tipping bucket rain collector (Davis Instruments, CA, USA) with Odyssey data recorder (Dataflow Systems, New Zealand)
0.2 mm Aug 2007–Feb 2010
Canopy throughfall/ interception
3 n/a 5-l water jugs (25 cm high, 196.5 cm2)using five replicates and one cumulative rainfall measure-ment per site, manual observationa
(bi)weekly Nov 2008–Feb 2009
Streamflow 2b 1 Odyssey capacitance water level probe (Dataflow Systems, New Zealand)
5 min May 2008–Feb 2010
MiniDiver along with BaroDiver for air pressure correctionc(Schlumberger Water Services, UK)
5 min Jul 2008–Feb 2010
Soil moisture 40 n/a EC-5 sensor (Decagon Devices, WA, USA) with SMR 100 data recorder (MadgeTech, NH, USA)
5 min Apr 2008–Feb 2010
a4 out of 180 records (2 %) were deleted because the amount of throughfall exceeded the cumulative rainfall (likely due to stem flow), which made it impossible to estimate the
contributing area.bIn the Valtorto catchment, streamflow was monitored at the catchment and subcatchment scale.cGiven the short distance between the catchments (3 km) and
their similar elevation, one BaroDiver was used for both catchments.
[image:5.595.53.542.451.637.2]a similar jug, and canopy interception was calculated for each jug based on the measured throughfall and the mean cumulative rainfall for that period. Jugs were installed on 17 November 2008 and emptied on 10 occasions until early February 2009. Because air temperatures were low and jugs were emptied during and/or quickly after major rain events, evaporation loss was considered negligible.
2.3.3 Streamflow
Streamflow, also referred to as “flow”, was measured us-ing V-notch weirs at the outlet of the catchments, and wa-ter levels were recorded at 5-min inwa-tervals in a stilling pond upstream of each weir. Two different water level probes were used (Diver and Odyssey type, Table 2). The stage-discharge relationship of each weir was determined from a set of manually measured water levels and streamflow (dis-charge) volumes. Subsequently, the stage-discharge relation-ships for each weir and water level probe were determined by fitting the power function Q= aHb+ c (or Q= aHb in case the intercept was not significant) to the set of measured
Q−H points1, whereQis the discharge andH is the wa-ter level. Diver and Odyssey logger results were highly cor-related (r >0.999 for Valtorto andr >0.982 for Espinho), and streamflow was therefore calculated as the mean when records of both loggers were available.
The weirs were regularly checked and plant material that could possibly block the flow was removed. In addition, data was deleted when flow was observed to be obstructed – which happened in the Valtorto main weir in early Decem-ber 2009. In all cases, large data gaps were left as is, while small data gaps (<2 h) were filled in by linear interpolation.
2.3.4 Soil moisture
Soil moisture content was monitored in the Valtorto catch-ment only, using Madgetech data loggers connected to Decagon EC-5 sensors (Table 2) installed at 2.5 cm depth. Sensors were installed at 40 sites throughout the catchment, and soil moisture contents were recorded at 5-min intervals.
All soil moisture probes were calibrated in the laboratory before installation in the field, and afterwards validated us-ing soil moisture samplus-ing adjacent to the probes in the field. The laboratory calibration was performed using repacked soil columns with known moisture content, using soil from the Valtorto catchment that was sieved (2 mm) and repacked at a dry bulk density typical for the catchment (0.88 g cm−3). To choose the best calibration curve, different curves (linear or polynomial, fitted to all sensors together or to each sensor individually) were validated with field topsoil moisture con-tents sampled within 0.5 m of the probe. Validation sampling
1 n=49 and 54 for Valtorto Diver and Odyssey water level
recorder (WLR), respectively, n=17 for Valtorto subcatchment Diver, andn=17 and 16 for Espinho Diver and Odyssey WLR, respectively.
was performed on five occasions using soil cores (50 cm3, 0–2.5 cm deep,n=209 for all sampling dates together) that were weighed and oven dried (24 h at 105◦C) to determine field moisture content.
The final calibration using a 2nd order polynomial (Eq. 1) resulted in an overestimation of 0.034±0.088 cm3cm−3,
which may be attributed to probe-to-probe and bulk density variations (Parsons and Bandaranayake, 2009; Rosenbaum et al., 2010), temperature variation (Bogena et al., 2007), small scale variability of soil moisture content in the field (Dekker and Ritsema, 2000), and the presence of rock fragments in the soils in the Valtorto catchment (Table 1).
θ=1.59·10−6V2+2.15·10−5V−0.116 (1) with θ= soil moisture content (cm3cm−3) and V= logger output voltage (mV). The 2nd order polynomial fitted the lab calibration points (n=150) with anr2of 0.97.
The present paper discusses the effect of fire on the catch-ment average soil moisture – spatial differences will be analyzed and discussed in a future paper.
2.4 Data analyses
Rainfall, streamflow and soil moisture data was analyzed using R (R Development Core Team, 2010). Since the length of data and the pronounced wet winter seasons made it difficult to distinguish individual storm events, compar-isons of treated and untreated catchments before and after the fire were made using hourly, daily and weekly values of rainfall, streamflow and soil moisture rather than on a storm-by-storm basis.
The effects of vegetation cover on canopy throughfall were assessed following a repeated measures experiment, in which the optimal model was selected using a similar approach as described by Webster and Payne (2002) using the nlme package in R (Pinheiro et al., 2009).
Fire-induced hydrological changes were assessed in a number of ways. Initially, pre- and post-fire rainfall-runoff coefficients were compared for the entire monitoring period. To facilitate visual analysis of changed conditions after the fire, daily pre- and post-fire data of rainfall, streamflow and soil moisture were subsequently plotted as quantile-quantile (QQ) graphs (Becker et al., 1988). In these graphs, the quan-tiles of the pre- and post-fire probability distributions are plotted against each other (rather than the data pairs, which is the case in a scatterplot), and changed conditions post-fire are indicated by deviation of the y = x line.
39
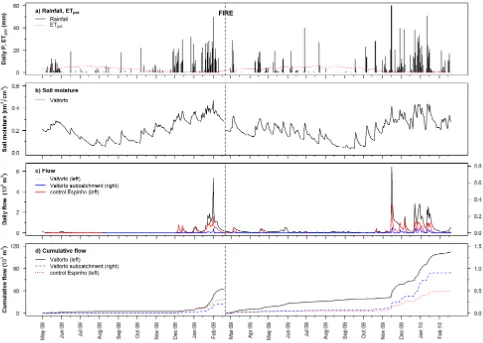
Fig. 2. Time series of (a) daily rainfall (P) and potential evapotranspiration (ETpot), (b) catchment average soil moisture content, (c)
streamflow, and (d) cumulative streamflow before and after the experimental fire on 20 February 2009 (vertical dashed line). Note that only the Valtorto catchment was burned; Espinho is the unburned control catchment. Also note that in the streamflow graphs (c, d), the values on the primary y-axis (left) apply to the Valtorto and Espinho main catchments, while the values on the secondary y-axis (right) apply to the Valtorto subcatchment.
the effects of rainfall, fire, and the interaction between rain-fall and fire. ANCOVA was also used to test for changes in the rainfall-soil moisture relationship in the treated (Val-torto) catchment. Because we had no soil moisture data in the control catchment, this ANCOVA analysis of the rainfall-soil moisture relationship could not be repeated for the con-trol. Given the effects of scale on the delay between rain-fall and streamflow response (i.e. not all rainrain-fall occurring on day 1 flows out on day 1 for a larger catchment) (Skøien et al., 2003) and to reduce the degree of autocorrelation in the data, the ANCOVA analyses were performed using weekly data for the catchment-scale Valtorto and Espinho data, and daily data for the Valtorto subcatchment. Changes in the soil moisture-rainfall relationship were also analyzed using daily data.
To study the timing and the strength of the relationship between streamflow and rainfall in the Valtorto catchment, as well as the relationship between soil moisture and rainfall before and after fire, we performed cross-correlation
analy-ses (following Venables and Ripley, 2002) using hourly data. Results of these analyses were compared by extracting the lagtime of the response (time to peak correlation) and the strength of the maximum correlation. For the soil moisture sensors (n=40), these values were then averaged and tested for significant effects of the fire using ANOVA.
Finally, the role of rainfall and soil moisture on stream-flow generation was more closely evaluated in the Valtorto subcatchment. Here, the absence of a slow-flow component did allow analysis on a storm-by-storm basis.
3 Results
3.1 Rainfall
Time series of rainfall, potential evapotranspiration (ETpot),
streamflow and soil moisture content are displayed in Fig. 2 and summary statistics are given in Table 3.
Table 3. Summary statistics of pre- and post-fire rainfall, potential evapotranspiration (ETpot), streamflow (flow) and the catchment average
soil moisture, which was calculated by taking the arithmetic mean of the moisture records available for each time step.
Parameter Rainfall ETpot Flow Soil moisture
Valtorto Espinho (Coimbra) Valtorto main Valtorto sub Espinho (control) Valtorto % of days % of days % of days % of days % of days % of days n/a Rainfall, Pre-fire 45 53 n/a 64 18 33 n/a flow occurrence Post-fire 45 51 n/a 99 22 48 n/a mm mm mm m3 m3 m3 cm3cm−3 Suma Pre-fire 878 1069 811 44·10
3 195 24·103 n/a
Post-fire 1352 1568 1068 110·103 904 39·103 n/a Daily meanb Pre-fire 3.0 3.6 2.8 148 1.0 84 0.206 Post-fire 3.7 4.3 2.9 308***c 2.5* 108 0.204 Daily median Pre-fire 0.0 0.2 3.1 11.8 0.0 4.5 0.199 Post-fire 0.0 0.2 3.4 100.3 0.0 0.0 0.203
Daily min Pre-fire 0 0 0.4 0 0 0 0.059
Post-fire 0 0 0.5 0 0 0 0.041
Daily max Pre-fire 50 43 5.9 5.3·10
3 52 1.6·103 0.469
Post-fire 60 65 5.6 6.4·103 71 2.7·103 0.438
% % % % % % %
CV Pre-firePost-fire 228236 221234 66.458.7 302194 452344 248251 4646
aNote that the pre-fire monitoring period for the Valtorto subcatchment (199 d from 5 August 2008 to 20 February 2009) is shorter than the pre-fire monitoring period for all other
sites (265 d from 1 March 2008 to 20 February 2009). The post-fire monitoring period is in all cases from 21 February 2009 to 20 February 2010 (365 d).bDaily mean values
include days without rainfall or streamflow. Asterisks indicate where pre- and post-fire means are significantly different atp <0.05(*), andp <0.001(***)cObserved, which is 1.6-fold higher than the value predicted (192 m3)from the rate of change in the control catchment.
Pre- and post-fire monitoring periods are both character-ized by a moderately wet spring, a fairly dry summer with occasional rain events, and a very wet winter period (Fig. 2a). The rainfall patterns in Valtorto and Espinho were highly correlated (r=0.99), despite the fact that total rainfall was considerably higher in Espinho (Table 3), likely because of its ridge-side location. Because the post-fire monitoring pe-riod was 19 % longer than the pre-fire pepe-riod, total rainfall and ETpotwere considerably higher for the post-fire period.
However, rainfall occurrence (the fraction of days with rain-fall) was similar before and after the fire, and daily mean rainfall and ETpotwere not significantly different. However,
the occurrence of large rain events (>20 mm in one day) was higher after the fire than before (Fig. 3a).
3.2 Canopy throughfall and interception
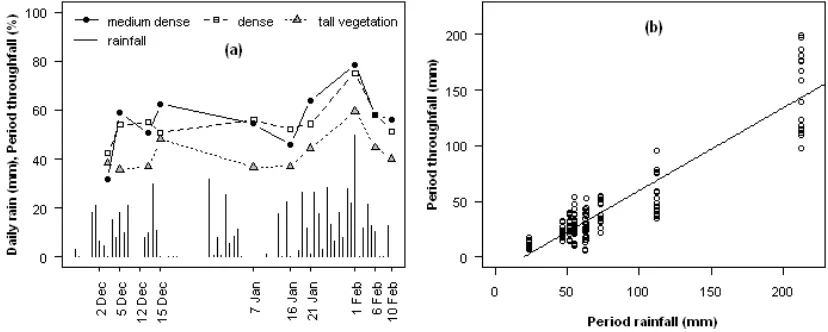
Canopy throughfall of the unburned vegetation in Valtorto was measured in the wet winter period before the fire (Fig. 4), and averaged 51.3±17.8 % of total rainfall, resulting in an estimated canopy interception of 48.7±17.8 %. Post-fire canopy interception of the regenerating vegetation was not measured, but was assumed to be minimal because of the sparseness of the regenerated vegetation cover, that only reached 30 % one year after the fire (Shakesby et al., 2010).
Pre-fire canopy throughfall was not significantly different between the sites in the Valtorto catchment (p=0.065),
al-though it was slightly less for the tall vegetation than for the lower vegetation (“dense” and “medium dense”, Fig. 4a). Al-though throughfall was fairly constant in time, it significantly increased during 15 consecutive rain days mid-January 2009 (p <0.0001, Fig. 4a), indicating that the throughfall fraction increased with increasing rainfall. Following Gash and Mor-ton (1978), total rainfall was plotted against total through-fall, and a linear regression line (Eq. 2, r2=0.84) was fit-ted through the 150 points (Fig. 4b). Both the slope and the intercept were significantly different from zero, withp=0 in both cases. The regression line crosses the y-axis at
x=19.5 mm, indicating that roughly the first 19.5 mm of a rain event was intercepted by the canopy. Because of this offset, the throughfall fraction was not a constant, but in-creased with rainfall, supporting the inin-creased throughfall observed mid-January 2009 (Fig. 4a). Likewise, the frac-tion of canopy intercepfrac-tion decreased with rainfall, empha-sizing that the relative canopy storage was smaller for larger rain events.
TF=0.742∗P−14.4 (2)
41
1
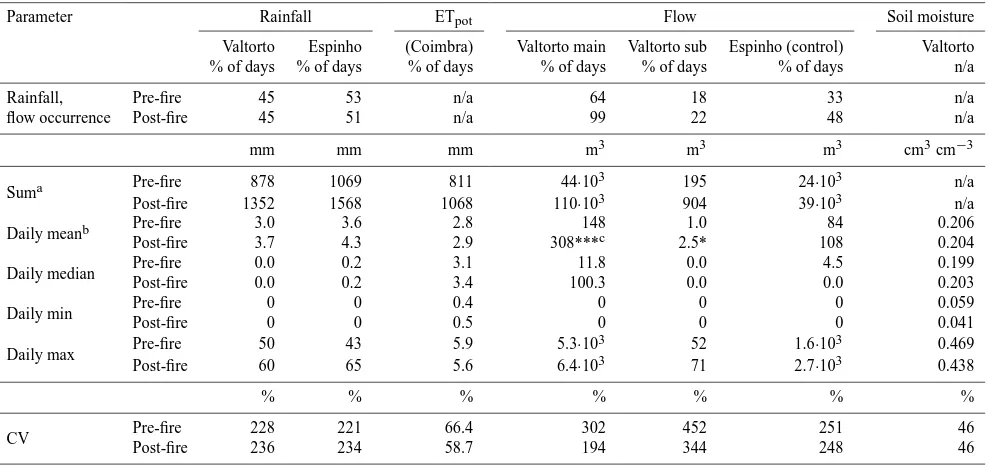
Figure 3. QQ-plots of a) daily rainfall, b) streamflow and c) soil moisture in the Valtorto
2
(burned) and Espinho (control) catchments, comparing the quantiles of pre- and post-fire
3
distributions relative to the
y
=
x
line (dashed). Where plotted data deviate from the
y
=
x
line,
4
pre- and post-fire values are different. The graphs show that post-fire rainfall (a) and flow (b)
5
was higher than pre-fire for all catchments, while the soil moisture distribution (c) remained
6
largely unchanged. To facilitate comparison between the different catchments and scales, flow
7
volumes in graph (b) are given in mm.
8
9
Fig. 3. QQ-plots of (a) daily rainfall, (b) streamflow and (c) soil moisture in the Valtorto (burned) and Espinho (control) catchments,
comparing the quantiles of pre- and post-fire distributions relative to the y = x line (dashed). Where plotted data deviate from the y = x line, pre- and post-fire values are different. The graphs show that post-fire rainfall (a) and flow (b) was higher than pre-fire for all catchments, while the soil moisture distribution (c) remained largely unchanged. To facilitate comparison between the different catchments and scales, flow volumes in graph (b) are given in mm.
42
1
2
Figure 4. December 2008 to February 2009 time series of a) daily rainfall and period total
3
fractions of throughfall for different vegetation density and height, and b) the relation between
4
throughfall amount and total rainfall for each measurement period. Throughfall fraction was
5
defined as the ratio between the amount of throughfall and total rainfall. ‘Medium dense’
6
vegetation was ~0.4 m high and had 44 ± 27% canopy cover, ‘dense’ vegetation was 0.5 to
7
0.6 m high and had 67 ± 24% canopy cover, and ‘tall’ vegetation was 1.5 to 2.0 m high and
8
had 84 ± 21% canopy cover.
9
10
Fig. 4. December 2008 to February 2009 time series of (a) daily rainfall and period total throughfall ratios for different vegetation density
and height, and (b) the relation between throughfall amount and total rainfall for each measurement period. Throughfall ratio was defined as the ratio between the amount of throughfall and total rainfall. “Medium dense” vegetation was∼0.4 m high and had 44±27 % canopy cover, “dense” vegetation was 0.5 to 0.6 m high and had 67±24 % canopy cover, and “tall” vegetation was 1.5 to 2.0 m high and had 84±21 % canopy cover.
3.3 Streamflow
Similar to the rainfall pattern, streamflow occurred mainly in the winter period, and was highly intermittent at the sub-catchment scale. After the fire, the occurrence of streamflow (fraction of days with streamflow>0) was higher for all three sites (Valtorto and Espinho catchments and Valtorto subcatchment), and resulted in almost year-round stream-flow in the main Valtorto catchment after the fire (Table 3, Fig. 2c–d). Because of its larger size, total streamflow in the main Valtorto catchment exceeded that of the control Espinho catchment (Table 3, Fig. 2c–d).
Because of the change in rainfall distribution after the fire (Fig. 3a), changes in streamflow patterns cannot be simply attributed to the effects of fire alone, particularly because streamflow characteristics also changed in the unburned con-trol catchment. However, traditional paired catchment anal-ysis (Fig. 5) showed that the fire significantly increased streamflow volumes in the Valtorto catchment with respect to the unburned control catchment. While the slope of the re-gression remained unaffected (p=0.130), the intercept sig-nificantly increased (p=0.002), indicating that the fire in-creased the volume of baseflow. This flow increase corre-sponds with changes in other measured streamflow parame-ters. Firstly, mean daily streamflow increased significantly in
[image:9.595.66.533.61.218.2] [image:9.595.89.503.300.466.2]43 1
Figure 5 Paired catchment analysis showing a significant (p=0.002) increase in streamflow in 2
the Valtorto catchment after the fire. 3
4
Fig. 5. Paired catchment analysis showing a significant (p=0.002) increase in streamflow in the Valtorto catchment after the fire.
the burned Valtorto catchment, while it did not significantly change in the control Espinho catchment (Table 3). With a mean daily streamflow increase from 148 to 308 m3, post-fire
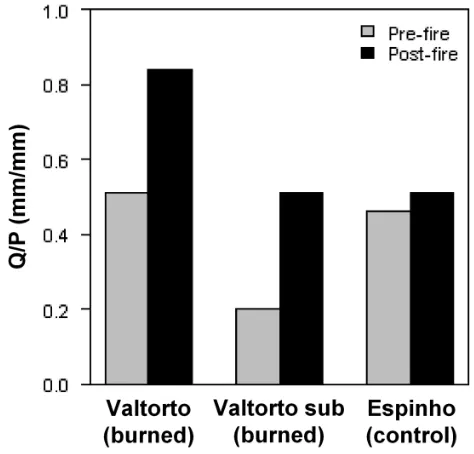
flow in the burned Valtorto catchment was 1.6 times higher than predicted (192 m3)from the rate of change in the control catchment. Secondly, the coefficient of variation for daily streamflow decreased in the burned Valtorto catchment, but remained largely unchanged in the unburned Espinho catch-ment, suggesting that daily flows in Valtorto had become more continuous and less intermittent (Table 3). Thirdly, the streamflow distribution showed a distinct shift upward from the y = x line in the QQ-plot (Fig. 3b), indicating that stream-flow in all catchments was greater post fire than pre fire. However, the upward shift was greater in the burned Valtorto catchment, particularly at the subcatchment scale, than in the unburned Espinho catchment (Fig. 3b). Fourthly, the overall runoff coefficient, the amount of streamflow per unit rain-fall across the entire monitoring period, increased consider-ably more in the burned catchment (1.7 and 2.5-fold increase at the catchment and subcatchment-scale, respectively) than in the control catchment (1.1-fold increase, Fig. 6). And fi-nally, while the lag time between streamflow and rainfall de-creased and the lag 0 correlation inde-creased after the fire in both the burned and unburned catchment, the increase in the correlation (and thus the increase in the immediate stream-flow response to rainfall events) was most clear in the burned Valtorto catchment, particularly at the sub-catchment scale (Table 4).
More detailed statistical analysis to separate the effects of fire and rainfall variability using ANCOVA revealed no significant interactions between rainfall and fire in any of
1
Figure 6. Runoff coefficient (
Q
/
P
) in the Valtorto catchment, the Valtorto subcatchment (sub)
2
and the Espinho catchment, calculated as the total streamflow divided by the total rainfall, for
3
the entire pre- and post-fire monitoring periods.
4
5
6
Fig. 6. Runoff coefficient (Q/P) in the Valtorto catchment, the Valtorto subcatchment (sub) and the Espinho catchment, calculated as the total streamflow divided by the total rainfall, for the entire pre- and post-fire monitoring periods.
the catchments, and indicated (not surprisingly) that rain-fall was the main explanatory variable for streamflow (p=
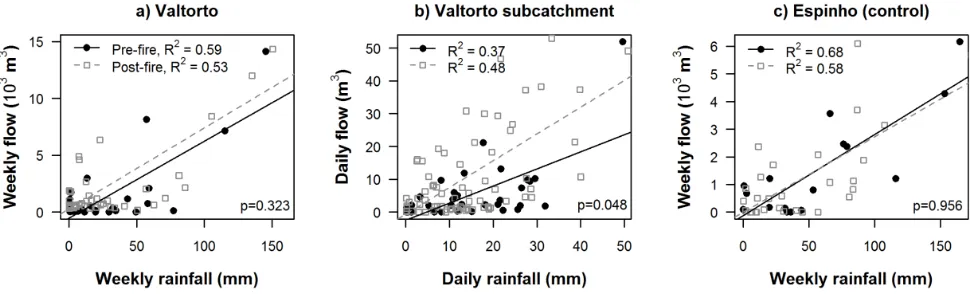
0.000 in all catchments). While the slope of the rainfall-streamflow relationship was not affected by fire in any of the catchments (p=0.903, 0.126 and 0.605 for the Valtorto, Valtorto sub and control Espinho catchments, respectively), and the intercept remained unchanged in the control catch-ment (p=0.955), the intercept in the burned catchment did change, resulting in a shifted rainfall-streamflow relationship (Fig. 7). Although this shift was not significant at the catch-ment scale (p=0.323), it was significant at the subcatch-ment scale (p=0.048) where the shift in the relationship was also the greatest (Fig. 7).
3.4 Soil moisture
Catchment average topsoil moisture fluctuations in the Val-torto catchment were strongly related to rainfall occurrence both before and after the fire (Fig. 2b). Although the av-erage topsoil moisture content appeared to drop consider-ably directly after the fire (Fig. 2b, near dashed line), the daily catchment mean moisture content for the post-fire pe-riod was not significantly different from the pre-fire value (Table 3). The quantile distribution of the catchment average soil moisture content was fairly similar before and after fire (Fig. 3c), however there was a slight increase in the occur-rence of low (<0.10 cm3cm−3)and high moisture contents
(0.40 to 0.45 cm3cm−3)after the fire.
Analysis of covariance (ANCOVA) of the catchment aver-age soil moisture content in the Valtorto catchment indicated
[image:10.595.308.545.62.289.2] [image:10.595.55.285.63.267.2]Table 4. Lagtime of the streamflow and moisture response to rainfall and strength of the correlation between streamflow (flow) and rainfall,
and soil moisture and rainfall, derived from cross-correlation analysis of hourly rainfall, streamflow and soil moisture data.
Rainfall∼Soil
Parameter Rainfall∼Flow moisturea
Valtorto main Valtorto sub Espinho Valtorto
Time to peak (h) Pre-fire 4 1 3 2.7
±1.7
Post-fire 2 1 1 2.1±1.4
Strength of correlation
Pre-fire 0.391 0.513 0.475 0.319±0.047
Post-fire 0.440 0.636 0.536 0.340±0.055
% increase 13 24 13 6
aCross-correlation analysis performed on all moisture sites separately for which good quality moisture records were available (n=39), and changes in lagtime (p=0.058) and
correlation strength (p=0.080) were analyzed using ANOVA.
45
1
Figure 7. Rainfall-streamflow relationships in a) the burned Valtorto catchment (based on
2
weekly data), b) the Valtorto subcatchment (based on daily data) and c) the Espinho control
3
catchment (based on weekly data).
R
2values refer to the goodness of fit of the regression
4
lines, and p-values indicate whether the intercepts of the pre- and post-fire regression lines
5
were significantly different, and thus indicate whether or not the fire significantly changed the
6
rainfall-streamflow relationship.
7
8
9
10
Fig. 7. Rainfall-streamflow relationships in (a) the burned Valtorto catchment (based on weekly data), (b) the Valtorto subcatchment (based
on daily data) and (c) the Espinho control catchment (based on weekly data). R2 values refer to the goodness of fit of the regression lines, and p-values indicate whether the intercepts of the pre- and post-fire regression lines were significantly different, and thus indicate whether or not the fire significantly changed the rainfall-streamflow relationship.
that there was a significant interaction (p=0.0001) between rainfall and fire. This indicated that the response of the average soil moisture content to fire varied with rainfall amount, for example, that fire affected the soil moisture con-tent on dry days differently than on rainy days. To illustrate: mean soil moisture content on dry days decreased from 0.171 cm3cm−3before the fire to 0.157 cm3cm−3after (p=
0.061), while the mean soil moisture content on days with rainfall slightly increased from 0.249 to 0.261 cm3cm−3 (p=0.266).
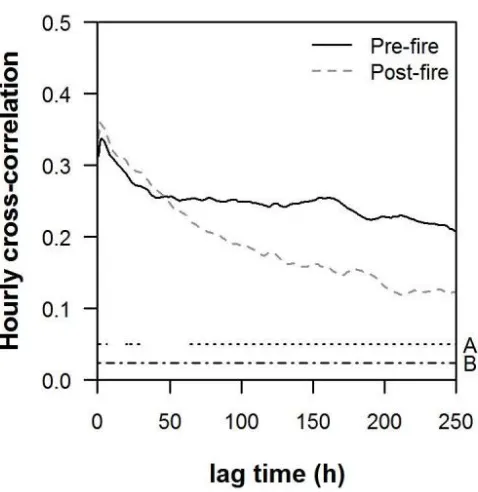
The changed soil moisture response on dry and rainy days was also visible in the cross-correlation analysis between rainfall and soil moisture content (Table 4). After the fire, soil moisture content was more strongly correlated to rainfall at lag 0 than before the fire, which was indicated by an in-crease in cross-correlation from 0.319 to 0.340 (Table 4) and which suggested a stronger general response of soil moisture to rainfall at p=0.080. In addition, a decrease in the lag to the maximum correlation was observed from 2.7 to 2.1 h (p=0.058), suggesting a more rapid response to rainfall af-ter the fire. However, for greaaf-ter lag times, the correlation
between rainfall and soil moisture decreased after the fire for all sites, resulting in a catchment average change depicted in Fig. 8. The initial increased response of soil moisture to rainfall was therefore followed by a long period of de-creased response, suggesting that the burned soil dried out more quickly after rain events.
3.5 Effect of rainfall and soil moisture on streamflow generation
As mentioned previously, rainfall was a significant predictor of streamflow in all catchments (Fig. 7). The role of rainfall and soil moisture on streamflow generation was more closely studied in the Valtorto subcatchment, where the rapid stream-flow response and absence of a slow stream-flow component facil-itated analysis on a storm-by-storm basis. Closer analysis of the subcatchment’s daily rainfall-streamflow relationship indicated that in addition to an increase in streamflow per unit rainfall (Fig. 6, 7b), the fire also decreased the buffer-ing capacity of the catchment for rainfall, i.e. the amount of rainfall stored in the soil, on the soil surface, and in the
[image:11.595.55.540.247.394.2]1
Figure 8. Cross-correlation between hourly rainfall and catchment average soil moisture
2
content in Valtorto, indicating the timing and the strength of the soil moisture response to the
3
occurrence of rainfall. The dotted horizontal line (A) indicates for which lag times post-fire
4
cross correlation is significantly different (
p
<0.05) from the pre-fire value, while the dashed
5
horizontal line (B) indicates the confidence interval.
6
7
8
Fig. 8. Cross-correlation between hourly rainfall and catchment
av-erage soil moisture content in Valtorto, indicating the timing and the strength of the soil moisture response to the occurrence of rain-fall. The dotted horizontal line (A) indicates for which lag times post-fire cross correlation is significantly different (p <0.05) from the pre-fire value, while the dashed horizontal line (B) indicates the confidence interval.
(remaining) vegetation before runoff and streamflow were generated. This resulted in a higher proportion of rainfall events generating streamflow, as shown in Fig. 9a. It fur-thermore slightly decreased the size of the largest daily rain-fall event during which no streamflow was generated, from a pre-fire 22.3 mm to a post-fire 20.7 mm.
Similarly, the fire significantly decreased the rainfall threshold for runoff generation. While pre-fire 7.2±6.3 mm of daily rainfall was buffered without generating streamflow, this reduced to 3.7±4.5 mm post-fire (p=0.005, Fig. 9b). Since streamflow on days with minor amounts of rainfall (<0.5 mm) usually resulted from heavy rainfall the day before, this analysis was limited to rainfall events≥0.5 mm.
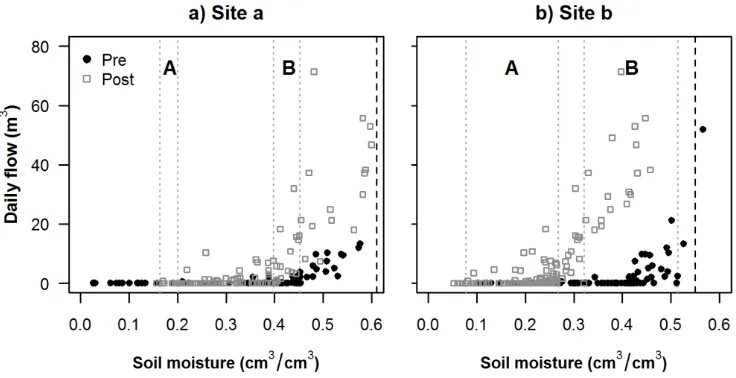
Antecedent soil moisture condition is an important fac-tor determining the rainfall runoff response of a catchment (Benavides-Solorio and MacDonald, 2001; Castillo et al., 2003). The data of the catchment moisture probes suggest that the moisture runoff relationship may have changed. Fig-ure 10 shows the relationship between soil moistFig-ure content and the daily streamflow of the Valtorto subcatchment for the two moisture monitoring sites closest to the subcatchment. It is important to note that the rainfall intensity of the events displayed in Fig. 10 did not change significantly after the fire (p=0.944). Figure 10 indicates that streamflow was gener-ated from drier topsoils after the fire than before the fire. Two
shifts can be observed: (1) fire decreased the threshold mois-ture content at which streamflow could be generated (see A, Fig. 10a, b), and (2) fire decreased the threshold topsoil mois-ture content at which streamflow was always generated (see B, Fig. 10a, b).
4 Discussion
4.1 Fire effects on streamflow generation
This study focused on the short term catchment hydrolog-ical responses as a result of fire. Since rainfall distribu-tion and amount have pronounced effects on streamflow pat-terns (Beven, 2001; Hewlett and Bosch, 1984), attributing observed hydrological changes to the effects of fire must be treated with caution. Since the changes in rainfall dis-tribution and total rainfall amount (Fig. 3a, Table 3) also affected streamflow in the control catchment (Fig. 3b, Ta-bles 3, 4), it is reasonable to assume that at least part of the observed changes in streamflow in the burned catchment should be attributed to the change in rainfall. However, tra-ditional paired catchment analysis showed that the fire sig-nificantly increased streamflow in the Valtorto catchment (Fig. 5). Moreover, the streamflow distribution (Fig. 3b) and runoff coefficient (Fig. 6) changed more in the burned catch-ment than in the unburned control, clearly suggesting that fire did have a role in changing streamflow response in the burned catchment. Finally, separation of rainfall and fire effects us-ing ANCOVA (Fig. 7) showed that fire changed the rainfall-streamflow relationship causing an increase in rainfall-streamflow in the Valtorto subcatchment and possibly in the whole catch-ment. To explain the observed responses and the difference in response between the catchment and the subcatchment scale we present a diagram that summarizes the changes in the short term hydrological balance due to fire (Fig. 11).
Increases in streamflow after fire have also been observed by others (Lavabre et al., 1993; Scott, 1993, 1997; Seibert et al., 2010), and are often attributed to decreased canopy in-terception storage (e.g. Scott and Van Wyk, 1990). Canopy interception in the winter before the fire averaged 48.7 % of total rainfall (Fig. 4a). This value is fairly high compared to the few data available on shrub interception (Dunker-ley, 2000), but can likely be attributed to the dense canopy cover (Table 1) and the rapid drying of the upper canopy be-tween rain events. Because of the high interception storage, removal of vegetation by fire nearly doubled the effective rainfall (Fig. 11).
Additional data suggests that there are more contribut-ing factors apart from reduced canopy interception. For in-stance, reduced interception does not explain the two shifts in the relation between subcatchment soil moisture content and rainfall (Fig. 10), i.e. the shift towards streamflow gen-eration on drier soil (“A”) and the shift towards decreased rainfall buffering after the fire (“B”). Since the fire did not
[image:12.595.48.287.57.303.2]47
1
Figure 9. a) Proportion of daily rainfall events > 0.5 mm generating streamflow and b) size of
2
daily rainfall events > 0.5 mm
not
generating streamflow in the Valtorto subcatchment before
3
and after the fire.
4
5
6
7
Fig. 9. (a) Proportion of daily rainfall events>0.5 mm generating streamflow and (b) size of daily rainfall events>0.5 mm not generating streamflow in the Valtorto subcatchment before and after the fire.
48
1
Figure 10. Daily average soil moisture content and daily streamflow for the Valtorto
2
subcatchment for days that rainfall occurred pre- and post-fire. Moisture records for the two
3
sites closest to the subcatchment (Fig. 1c) are given (with 28 and 17% missing data periods
4
for site a and b, respectively). Note that pre- and post-fire rainfall intensities of the events
5
displayed were not significantly different, and that the black dashed line indicates total
6
porosity (Stoof, 2011). After the fire, the subcatchment generated streamflow for lower
7
moisture content; shift A indicates the shift in the threshold moisture content at which
8
streamflow
could be
generated, while shift B indicates the shift in the threshold moisture
9
content at which streamflow
was always
generated.
10
11
[image:13.595.115.478.61.257.2]12
Fig. 10. Daily average soil moisture content and daily streamflow for the Valtorto subcatchment for days that rainfall occurred pre- and
post-fire. Moisture records for the two sites closest to the subcatchment (Fig. 1c) are given (with 28 and 17 % missing data periods for site (a) and (b), respectively). Note that pre- and post-fire rainfall intensities of the events displayed were not significantly different, and that the black dashed line indicates total porosity (Stoof, 2011). After the fire, the subcatchment generated streamflow for lower moisture content; shift A indicates the shift in the threshold moisture content at which streamflow could be generated, while shift B indicates the shift in the threshold moisture content at which streamflow was always generated.
change soil bulk density, porosity or hydraulic conductivity (Stoof, 2011), the observed shifts cannot be attributed to a change in these soil properties. Nor can they be explained by changes in rainfall intensity, because the intensity of the rain events generating streamflow in the subcatchment did not change significantly. They could be attributed to sur-face sealing (Larsen et al., 2009), which was not assessed in the catchment but neither observed during any of the field visits. However, we suggest that the shift towards stream-flow generation on drier soil may be attributed to soil
wa-ter repellency, and that the shift towards decreased rainfall buffering may be explained by the combined effects of soil water repellency (discussed below) and the decrease in sur-face roughness that was observed after the fire (Stoof, 2011). Surface roughness or microtopography is generally caused by plant litter or surface rock fragments, and has a small but important role in surface water storage (Govers et al., 2000). Because it increases the amount of water ponding on the soil surface (Fig. 11), surface roughness can delay the initiation and amount of overland flow. Consequently, the decrease
[image:13.595.114.482.305.494.2]in surface roughness may have been an additional contribut-ing factor to the more rapid generation of overland flow and reduction in rainfall buffering shown in Figs. 9a and 10.
4.2 Role of soil moisture and implications for soil water repellency
Given the effect of vegetation cover on soil moisture sta-tus (Hulbert, 1969; Stoof et al., 2011; Sumrall et al., 1991; White and Currie, 1983), the more rapid drying of the top-soil recorded in this study (Fig. 8) and the decreased toptop-soil moisture content on dry days are likely explained by post-fire exposure of the soil to atmospheric forcings resulting from vegetation removal. Since topsoil moisture content was not significantly changed by the fire itself (Stoof et al., 2011), post-fire soil exposure may also explain the drop in topsoil moisture content between the fire and the reinstallation of the sensors (Fig. 2b). In addition to protecting the soil from dry-ing, vegetation cover can also prevent the soil from wetting (Stoof et al., 2011). Vegetation removal therefore also seems to have caused the stronger and faster initial response of soil moisture to rainfall after fire illustrated in Table 4 and Fig. 8. Both observations suggest changes in the development and elimination of soil water repellency after the fire, as will be discussed in the following paragraphs.
Like many soils worldwide (DeBano, 2000a; Dekker et al., 2005), soils in the Valtorto catchment exhibit water repel-lency regardless of fire (Stoof et al., 2011). While water re-pellency was prevalent in the catchment before the fire, there was a significant increase in water repellency directly after the fire, as well as faster development of repellency during dry periods in the burned areas, which was largely attributed to post-fire soil exposure (Stoof et al., 2011). Since soil water repellency in Valtorto was inversely related to soil moisture content (Stoof et al., 2011), the lower soil moisture contents resulting from the rapid drying of the topsoil after rainfall il-lustrated in Fig. 8 resulted in faster (re)development of soil water repellency and inhibition of infiltration. However, the presence of water repellency inhibits water uptake by soils – thus creating a vicious cycle in dry periods. The result-ing impact on streamflow generation is suggested in Fig. 10, with a lower soil moisture threshold for streamflow gener-ation after the fire, as well as a higher fraction of rainfall events generating (overland) flow on dry soil. Since soil properties like porosity and saturated hydraulic conductiv-ity were not significantly affected by the fire (Stoof, 2011), and rainfall intensity of the events displayed in Fig. 10 also remained unchanged, the increased streamflow response to rainfall events occurring on dry soil may be attributed to a more prominent role of soil water repellency in the burned landscape, as suggested by Stoof et al. (2011). After fire, the faster (re)development of soil water repellency therefore con-tributed to a higher sensitivity to overland flow (Fig. 10) – es-pecially for short duration rainfall events. This may explain
the increased soil erosion rates observed in the catchment after the fire (Shakesby et al., 2010).
The impact of the faster development of soil water re-pellency should not be assessed without considering the ef-fects of its more rapid elimination resulting from the higher effective rainfall after the fire (Stoof et al., 2011). The more rapid elimination of soil water repellency for burned soil ob-served by Stoof et al. (2011) is consistent with the faster and stronger initial response of soil moisture to rainfall after fire (Table 4, Fig. 8), which suggests that faster disappearance of soil water repellency improves infiltration. As a result, overland flow risk may be reduced during prolonged rainfall events, which, along with the reduced transpiration (Silva et al., 2006) (Fig. 11), could increase (sub)soil water storage. In contrast, the increased topsoil evaporation (Fig. 11) would affect only the top few cm (Wythers et al., 1999). The po-tential increase in the amount of water stored in the subsoil may explain the increase in dry season flow observed in the present study (Fig. 2c–d, Table 3) as well as in other stud-ies (Berndt, 1971; Hibbert, 1967). Given the fact that (post-fire) plant growth is strongly related to soil water availabil-ity (Garc´ıa-Fayos et al., 2000; Kasischke et al., 2007; Ruiz-Sinoga et al., 2011; Yang et al., 2010; Zald et al., 2008), the possible increase in subsoil water storage may consid-erably favor plant recovery in burned areas. Since subsoil moisture content was not measured in this study, no definite conclusion can be drawn, however, it is an interesting topic for further study.
4.3 Synopsis of fire impact on hydrology
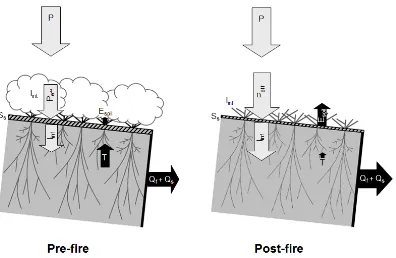
As pointed out, fire-induced changes to the hydrological bal-ance are summarized in Fig. 11, which illustrates the impact of fire on soil moisture and water fluxes. After the fire there is a reduced interception capacity (Iint)and, consequently,
an increase in effective rainfall (Peff). A drop in plant
tran-spiration (T )may cause a further increase in (sub)soil water availability and streamflow (Qs), while increased soil
evap-oration (Esoil)causes more rapid drying of the topsoil.
Top-soil water repellency is therefore more rapidly triggered, re-sulting in an increased risk of overland flow risk for small rain events. The risk of overland flow (Qf)is additionally
increased through a reduction in surface water storage (Ss)
resulting from reduced surface roughness after the fire. This increase in overland flow risk may however be (partly) coun-terbalanced by the more rapid elimination of soil water repel-lency during extended rainfall events, which could enhance subsoil infiltration and water storage and streamflow (Qs).
49
2
3
Figure 11. Fire impact on hydrology, showing pre- and post-fire water fluxes and rainfall
4
partitioning. Grey arrows indicate water gain, black arrows indicate water loss from the soil
5
profile.
P
is rainfall,
P
effis effective rainfall (the amount of rainfall reaching the ground
6
surface),
I
infis infiltration,
I
intis canopy interception,
S
sis surface water storage,
E
soilis bare
7
soil evaporation,
T
is plant transpiration, and
Q
fand
Q
sis the sum of fastflow (surface runoff)
8
and slowflow (subsurface runoff). As the impact of the changes in water fluxes and rainfall
9
partitioning on soil moisture status is highly transient, soil moisture (discussed in Sections 3.4
10
and 4.2) is not depicted in this figure.
11
12
Fig. 11. Fire impact on hydrology, showing pre- and post-fire water fluxes and rainfall partitioning. Grey arrows indicate water gain, black
arrows indicate water loss from the soil profile.P is rainfall,Peffis effective rainfall (the amount of rainfall reaching the ground surface),Iinf
is infiltration,Iintis canopy interception,Ssis surface water storage,Esoilis bare soil evaporation,T is plant transpiration, andQfandQsis
the sum of fastflow (surface runoff) and slowflow (subsurface runoff). As the impact of the changes in water fluxes and rainfall partitioning on soil moisture status is highly transient, soil moisture (discussed in Sects. 3.4 and 4.2) is not depicted in this figure.
vegetation type, stand age, and climate (Bosch and Hewlett, 1982; Murakami et al., 2000; Vertessy et al., 2001).
4.4 Implications for downstream flooding risk and
effects of scale
By increasing streamflow volumes (Fig. 5) and increasing the volume of runoff for a given rain event (Fig. 6), the data support the commonly reported increased flooding risk after fire (Cannon et al., 2008; Conedera et al., 2003; Jordan and Covert, 2009; Rulli and Rosso, 2007). Moreover, by increas-ing streamflow volumes throughout the year, the fire may also have increased the risk of floods as a cumulative effect. Although it is likely that the observed reduction in canopy storage and surface roughness (Stoof, 2011) also resulted in a stronger and faster response of streamflow after fire, the change in rainfall distribution post-fire (Fig. 3a) prevented assessment of the exact role of the fire. After all, streamflow response was also stronger and faster in the control catch-ment (Table 4) – likely because of the increased occurrence of large rain events.
Fire impact was highly affected by scale. In all cases, the subcatchment indicated far greater fire impacts than the main catchment: the increase in streamflow distribu-tion (Fig. 3b), runoff coefficient (Fig. 6), and the change in rainfall-streamflow relationship (Fig. 7a–b) were all greater
at the small scale than at the catchment scale. Hence, flood-ing risk inside the catchment itself increased more than the downstream flooding risk.
Reduced response at the larger scale is typical for hydro-logical processes: moving from the subcatchment scale to the catchment scale, the flow paths lengthen, lag time increases and the opportunities for infiltration and storage due to soil heterogeneity increase (Skøien et al., 2003). However, this also means that the effects of fire on local overland flow gen-eration and subcatchment runoff (as depicted in Fig. 11) get diluted due to these catchment filtering processes, resulting in a less pronounced response at the larger scale (Fig. 7).
This scale effect is often observed in post-fire hydrol-ogy: plot-scale runoff coefficients tend to be higher than hillslope- or catchment scale runoff coefficients (Shakesby et al., 2006; Shakesby, 2011), which is generally attributed to increased soil and surface heterogeneity or patchiness at larger scales leading to decreased hydrological connectiv-ity (Doerr et al., 2003; Ferreira et al., 2005, 2008), which may be partly explained by increased spatial variation in burn severity at the larger scale. While post-fire hydrolog-ical changes thus decrease when moving up in scale, it is important to note that they may be larger than reported in the present paper in systems where the loss in canopy intercep-tion and plant transpiraintercep-tion are greater. This can for instance be the case in forests (Bosch and Hewlett, 1982), or in hotter
[image:15.595.102.498.58.316.2](wild)fires where soil physical changes are more pronounced (Garc´ıa-Corona et al., 2004; Stoof et al., 2010).
4.5 Lessons for study of fire impact on hydrology
The markedly different response of the catchment- and subcatchment-scale emphasizes the need to study hydrology at the appropriate scale of interest. Although small plot or hillslope scale studies do provide valuable insight into the processes governing hydrological changes, as demonstrated in Sect. 3.5, they may considerably overestimate the degree of change occurring at the catchment scale as well as miss the increase in dry season streamflow.
The present study shows that it is possible to study fire impact on catchment-scale hydrological processes in a con-trolled experimental setup. Since studies of wildfire impact on hydrology are hard to plan in advance, this provides a method to purposely study fire effects at the catchment scale. The paired-catchment approach used in the present study and using pre- and post-fire data enabled separation of fire, rainfall variability and site effects through traditional paired catchment as well as ANCOVA analysis. This is particu-larly interesting in regions where regular catchment scale hydrological monitoring is not common, and where pre-fire streamflow records are therefore often absent for burned catchments.
Soil, fuel and weather conditions during experimental fires are highly unlikely to match summer wildfire conditions be-cause of safety concerns, which implies that soil and vege-tation burn severity of experimental fires will generally be lower than can be expected for wildfires (Cerd`a and Ro-bichaud, 2009). This was also demonstrated in the Valtorto fire: despite its high intensity, soil temperature remained sur-prisingly low and soil physical properties remained unaf-fected (Stoof, 2011). Experimental fire studies can there-fore be used to study catchment-scale effects of prescribed fires or low-severity wildfires that occur when soils and veg-etation are still fairly moist. Assessment of catchment-scale effects of summer wildfires remains a matter of “luck”. In all cases, finances and logistics will always limit the number of replicates available in catchment-scale studies. To get a full overview of the general effects of fire on hydrology at the catchment scale, a meta-analysis could be done on all the previous studies worldwide, similar to meta-analyses done to assess the effects of deforestation (Bosch and Hewlett, 1982; Brown et al., 2005).
5 Conclusions
In a planned catchment-scale fire experiment, this research used pre and post-fire experimental data of paired small catchments to assess the hydrological impact of fire. The changed rainfall conditions following the fire highlighted the value of the adopted sampling design, which allowed
assess-ment of fire impact under changed rainfall conditions (be-cause of the availability of pre- and post-fire data) without being hampered by effects of site variability (because of the use of paired catchments). The experiment showed that:
1. Vegetation removal markedly increased the amount of effective rainfall, particularly for smaller rain events. The shrub canopy intercepted on average the first 19.5 mm of a rain event before the fire, and canopy interception was on average 48.7 % of total rainfall. Since the fire removed nearly all the vegetation from the catchment and canopy cover was only 30 % one year af-ter the fire, post-fire canopy inaf-terception was minimal. 2. Fire increased streamflow volumes at the
catch-ment scale. It also increased the runoff coeffi-cient and changed the rainfall-streamflow relationship, particularly at the subcatchment scale.
3. By significantly increasing the amount of streamflow per unit rainfall at the subcatchment-scale, the fire may have increased the risk of flooding inside the catchment. However, as the increase in streamflow was not signifi-cant at the catchment scale, fire may have only slightly affected downstream flooding risk.
4. After the fire, the streamflow response to rainfall events was quicker. However, since the control catchment showed a similar change due to a changed rainfall dis-tribution, the degree to which fire played a role in this could not be assessed.
5. After the fire, the moisture content of the 0–2.5 cm soil layer responded more quickly to rainfall than before, and at the same time this layer dried out more quickly after rain events.
Results support existing knowledge that fire impact on hy-drology is largely affected by scale, and emphasize the risk of overestimating hydrological fire impact when upscaling plot- or hillslope scale studies to the catchment scale. This highlights the importance of using the appropriate scale for research design or data use in assessing fire effects.
Finally, results suggest that fire-induced hydrological changes can occur even when soil temperatures during fire remain low. As previous work indicated that soil heating was limited in most of the catchment and soil physical properties remained unchanged, vegetation removal is likely the most significant cause of the observed hydrological changes be-cause of its effects on effective rainfall, soil water repellency fluctuation and surface roughness.
Acknowledgements. The authors thank Rick Shakesby and Rory