Georgia State University Georgia State University
ScholarWorks @ Georgia State University
ScholarWorks @ Georgia State University
Nutrition Theses Department of Nutrition
Summer 6-18-2014
Within-Day Energy Balance, Body Mass Index, and Body
Within-Day Energy Balance, Body Mass Index, and Body
Composition in College Students
Composition in College Students
Rebecca Leet
Follow this and additional works at: https://scholarworks.gsu.edu/nutrition_theses
Recommended Citation Recommended Citation
Leet, Rebecca, "Within-Day Energy Balance, Body Mass Index, and Body Composition in College Students." Thesis, Georgia State University, 2014.
https://scholarworks.gsu.edu/nutrition_theses/59
This Thesis is brought to you for free and open access by the Department of Nutrition at ScholarWorks @ Georgia State University. It has been accepted for inclusion in Nutrition Theses by an authorized administrator of
APPROVAL
This thesis, Within-Day Energy Balance, Body Mass Index, and Body Composition in College Students, by Rebecca Whitney Leet, was prepared under the direction of the Master’s Thesis Advisory Committee. It is accepted by the committee members in partial fulfillment of the requirements for the degree Master of Science in the Byrdine F. Lewis School of Nursing and Health Professions, Georgia State University. The Master’s Thesis Advisory Committee members, as representatives of the faculty, certify that this thesis has met all standards of excellence and scholarship as determined by the faculty.
__________________________________________________________ Dan Benardot, PhD, RD, LD, FACSM
Committee Chair
__________________________________________________________ Walter R. Thompson, PhD, FACSM, FAACVPR
Committee Member
__________________________________________________________ Sarah Henes, PhD, RD, LD
Committee Member
AUTHOR’S STATEMENT
In presenting this thesis as a partial fulfillment of the requirements for an advanced degree from Georgia State University, I agree that the Library of the University shall make it available for inspection and circulation in accordance with its regulations governing materials of this type. I agree that permission to quote from, to copy from, or to publish this thesis may be granted by the author or, in her absence, by the professor under whose direction it was written, or in his absence, by the Associate Dean, Byrdine F. Lewis School of Nursing and Health Professions. Such quoting, copying, or publishing must be solely for scholarly purposes and will not involve potential financial gain. It is understood that any copying from or publication of this dissertation which involves potential financial gain will not be allowed without written permission of the author.
______________________________
NOTICE TO BORROWERS
All theses deposited in the Georgia State University Library must be used in accordance with the stipulations prescribed by the author in the preceding statement.
The author of this thesis is: Rebecca Whitney Leet
Coordinated Program in Dietetics Department of Nutrition
Byrdine F. Lewis School of Nursing and Health Professions
The Chair of the committee for this thesis is: Dan Benardot, PhD
Professor
Department of Nutrition Georgia State University Atlanta, Georgia 30303
VITA
Rebecca Whitney Leet
1623 Eggleston Rd. Pembroke, VA 24136
(404)518-3273
EDUCATION
M.S. Nutrition, Expected graduation August 2014
Georgia State University Coordinated Program, Atlanta, GA
B.S. Human Nutrition, Foods and Exercise, Dietetics Option, graduated May 2013
B.A. Foreign Languages/ Spanish, graduated May 2013
Virginia Polytechnic Institute and State University, Blacksburg, VA
WORK EXPERIENCE
Nutrition Graduate Assistant at the Georgia State University Recreation Center, Atlanta, GA, August 2013-August 2014
Work as the primary nutrition counselor at the Recreation Center. Counsel a variety of clients addressing client’s interests and needs.
INTERESTS
Public Policy, Atlanta, GA, Washington, D.C., January 2014-April 2014 Organized and attended Public Policy Day for Georgia Academy of Nutrition and Dietetics. Attended the Academy of Nutrition and Dietetics Public Policy Workshop in Washington, D.C. in April, 2014. Met with congressional leaders and lobbied for bills of interest for the Academy.
RESEARCH
ABSTRACT
WITHIN-DAY ENERGY BALANCE, BODY MASS INDEX, AND BODY COMPOSITION IN COLLEGE STUDENTS
Rebecca Whitney Leet, Dan Benardot, Walter Thompson, Sarah Henes
Background: The customary mechanism for assessing weight change involves an
assessment of the imbalance in the energy consumed vs. the energy expended. This
energy balance ratio is commonly assessed in 24-hour periods, but this strategy fails to
account for the timing of macronutrient intake and within-day fluctuations in energy
balance, which have an influence on body composition and, ultimately, weight. Hourly
fluctuations in energy balance provides information on the time spent in a catabolic state
and time spent in an anabolic state, which is not possible with a 24-hour energy balance
assessment. Measuring hourly energy balance to optimize absorption and storage of
specific nutrients may be a practical strategy for obese individuals to improve body
composition. Purpose: The purpose of this study was to observe current dietary habits
and assess hourly energy balance of college students with different BMI categories (i.e.,
below and above a BMI of 30) to determine if there are differences between body
composition and hours spent in different energy balance states. Methods: The subjects
completed a four-day diet and physical activity record from which energy intake and
energy expenditures from a relative intensity activity scale was predicted linked to MET
values. After completing the record, subject weight, height, % body fat and fat free mass
was assessed using a multi-frequency bioelectrical impedance segmental body
composition analyzer. Results: Data were analyzed from a total of 17 college students (9
men and 8 women) ranging from 20-28 years old (mean age 23 ± 2.6). Predicted energy
intake averaged 2237.3 ± 749.3 kcals/d and predicted energy expenditure averaged
average BMI of the subjects 28.8 ± 5.8. Using an Independent Samples T-Test, eight
subjects with a BMI ≥ 30 spent more time in hours high deficit (< -400 kcals Energy
Balance) when compared to nine subjects with a BMI < 30. Nine subjects with a BMI <
30 spent more time in ±400 kcal energy balance. Using a Spearman Rho correlation,
body fat % was positively correlated to hours high deficit (p ≤ 0.01) and negatively
correlated to hours in ±400 kcal energy balance (p ≤ 0.01). Analysis of men and women
found that body fat % of men was not significantly associated to any energy balance
variables. While not significant, there was a trend toward a positive correlation between
body fat % and hours high deficit (p=0.065) and a negative correlation between body fat
% and hours in ±400 kcal energy balance (p=0.065). In women, subjects who spent more
time in high energy deficit (< -400 kcals Energy Balance) had higher body fat % (p ≤
0.05). Subjects who spent more hours in optimum energy balance (± 400 kcal Energy
Balance) had lower body fat % (p ≤ 0.05). Conclusions: These data suggest that
spending long periods of time in an energy deficit is correlated with higher body fat %
and higher BMI in college students. Particularly for women, it may be beneficial for body
composition to avoid long periods of time in energy deficit and strive to remain in or near
±400 kcal energy balance. College students may be especially prone to extreme deficits
in energy balance because of unpredictable schedules and frequent meal skipping.
Recommendations for avoiding large energy deficits throughout the day may be
Within-Day Energy Balance, Body Mass Index, and Body Composition in College Students
A Thesis Submitted to the Graduate Committee in the Division of Nutrition
At Georgia State University in Partial Fulfillment of the Requirements for
the Degree
MASTER OF SCIENCE
IN
HEALTH PROFESSIONS
WITH AN EMPHASIS IN NUTRITION
Rebecca Whitney Leet
Coordinated Program in Dietetics
Department of Nutrition
Byrdine F. Lewis School of Nursing and Health Professions
Atlanta, Georgia
2014
THESIS COMMITTEE
Dan Benardot, PhD, DHC, RD, LD, FACSM (Chair)
Walter R. Thompson, PhD, FACSM, FAACVPR
ii
ACKNOWLEDGEMENTS
To my parents, I would not be where I am without your support and motivation. I cannot thank you both enough and I hope to keep making you proud as I move out into the “real
world”.
To Dr. Benardot, I want to thank you for being the best thesis chair and mentor throughout this past year. I would not have been able to complete this thesis or program
without your guidance, motivation and humor.
To Dr. Henes, I want to thank you for your encouragement and advice. Through your counsel inside and outside of class, you’ve inspired me and motivated me to work for my
goals.
To Dr. Thompson, I want to thank your for your thorough review and assistance when completing this thesis.
To Caroline Dotts and everyone in the GSU Fitness Center, I want to thank you all for your support throughout the completion of this thesis. You all kept me sane!
To Ryan Do, I want to thank you for always supporting me throughout this past year. You’ve been the best cheerleader and I would not have been able to do it without you.
To Cathy McCarroll, I want to thank you for being a great program director and supporting me this past year.
To Heather Hanson and Ashley Delk, I want to thank you both for all of your help while completing this thesis. Whether helping find articles or merely listening to my complaints
iii
Table of Contents
Chapter I. Introduction 1
Chapter II. Review of Literature 6
Chapter III. Methods 22
Chapter IV. Results 26
Chapter V. Discussion and Conclusion 33
Appendix 38
iv
List of Tables
Table 1:
Descriptive Data 26
Table 2:
Energy Balance Descriptive Statistics 27
Table 3:
Mann-Whitney U Test Comparing BMI ≥ 30 to BMI < 30 28
Table 4:
v
Abbreviations
BMI Body Mass Index
BMR Basal Metabolic Rate
EB Energy Balance
FFA Free Fatty Acids
G Grams
GLP-1 Glucagon-Like Peptide-1
GIP Gastric Inhibitory Polypeptide
HDL High Density Lipoprotein-Cholesterol
Kcal Kilocalorie
Kg Kilograms
LDL Low Density Lipoprotein-Cholesterol
REE Resting Energy Expenditure
RQ Respiratory Quotient
1
Chapter I
Introduction
Energy balance represents the relationship between energy intake and energy
expenditure (Saltzman & Roberts, 1995). Traditionally, energy balance has been assessed
in 24-hour units, with typical dieting protocols inducing a daily energy deficit through a
reduction in energy consumption or an increase in energy expenditure. However, this
strategy has been found to be ineffective, as the initial weight loss is commonly followed
by compensatory mechanisms that results in a decrease in energy expenditure with an
increase in fat mass and a decrease in fat-free mass (Hill et al., 2012). Hourly fluctuations
in energy balance may provide more information on the relationship between the time
spent in an energy deficit (i.e., a catabolic state) and time spent in an energy surplus (i.e.,
an anabolic state) during the day, which is not possible with a 24-hour energy balance
assessment.
Several studies have found that large fluctuations of within-day energy balance
may affect body composition by increasing fat mass and decreasing fat-free mass
(Arciero et al., 2013; Deutz et al., 2000; Zheng et al., 2009). Many studies have also
measured meal frequency as a reflection of within-day energy balance (Bertelsen et al.,
1993; Cameron et al., 2010; Drummond et al., 1998). During a 10-year follow up study of
1162 white female adolescents and 1210 black female adolescents, fewer eating episodes
2
2012). During a randomized crossover trail, nine healthy, lean women consumed a
regular meal pattern (6 occasions per day with regular intervals between meals) or an
irregular eating pattern (between 3 to 9 meals per day varied each day) for 14 days with a
14-day wash out period between test meal periods. Body composition variables did not
change through the intervention period for either group. Irregular eating patterns were
associated with decreased energy expenditure compared to regular meal consumption
(Farshchi et al., 2004).
Low meal frequency has been shown to strongly correlate to poor health
conditions. Bachman et al. (2011) measured meal frequency using 24-hour telephone
food recalls (2 weekdays and 1 weekend day) to measure the differences in overweight
subjects, weight loss maintainer subjects, and normal weight subjects. Meal frequency
was higher in weight loss maintainers and normal weight subjects compared to
overweight and obese subjects. BMI was negatively correlated with snack consumption.
The study suggested that three meals and two snacks per day was the most beneficial
combination (Bachman et al., 2011).
Improvements in body composition have also been found through increased meal
frequency. Arciero et al. (2013) conducted a study measuring the effect of increased meal
frequency with moderate to high protein and the relationship to total and abdominal fat
percentage. The nutritional intervention lasted 62 days with three phases: a 5-day
baseline control; a 28-day balance phase; and a 28-day negative energy balance phase.
All of the subjects were allocated into three intervention groups: traditional intake of
three meals/day, high protein group (30% kcal/d) consumed in three meals/day, or high
3
per day, higher protein diet decreased total and abdominal body fat percentage,
maintained lean body mass and increased thermogenesis (Arciero et al., 2013).
In athletes, increased meal frequency has been found to have a similar advantage
in maintaining lean body mass by decreasing muscle protein breakdown (Iwao et al.,
1996). Iwao et al. (1996) studied 12 members of a university boxing club to test the
effects of food restriction carried out over two weeks with a meal frequency intervention.
Subjects followed a low meal frequency (two meals per day) or a high meal frequency
(six meals per day). Both meal frequencies when consumed in an energy deficit yielded
decreased body weight, however the decrease in lean body mass was significantly less in
the high meal frequency group.
Increased meal frequency is not necessarily a measure of real-time energy
balance, as fluctuations in expenditure and/or the volume of food consumed may still
result in energy balance states that result in undesirable body composition outcomes.
These findings may be better understood through an analysis of the hourly changes in
energy balance. While energy intake and energy expenditure are often reported to
measure energy balance, energy storage will additionally influence body composition
changes (Hill et al., 2012). Humans are capable of absorbing and utilizing a finite amount
of nutrients at one period of time. Only 30-40 grams of protein, for instance, can
effectively be used by the tissues following a single eating opportunity (Paddon-Jones &
Rasmussen, 2009; Schutz, 2011). Protein consumed in excess of this amount will be
denitrogenated and stored as fat or used as an energy substrate, rather than as one of the
multiple uses of protein, which include sustaining or increasing lean tissue and
4
distribution of approximately 30 grams per eating episode throughout the day has been
found to increase muscle protein stores and increase fat free mass, a desirable condition
for individuals carrying excess fat mass (Arciero et al., 2013).
Excess carbohydrate consumption at one sitting, for example during a large meal,
may also cause a biological disadvantage from excess insulin production, resulting in
higher fat storage (Woods et al., 2006). However, a variety of factors may influence the
amount of insulin released, including eating frequency. Insulin exponentially increases
with calories consumed (Woods et al., 2006). Therefore, after larger meals, there is a
hyperinsulinemic response to the high amount of energy, and hyperinsulinemia will
increase fat storage regardless of the nutrient composition of the consumed meal
(Kanaley et al., 2013; McNay et al., 2013; Woods et al., 2006). Sporadic meal patterns
that allow for hypoglycemia may also cause postprandial hyperinsulinemia after the next
meal regardless of nutrient composition and size (McNay et al., 2013; Woods et al.,
2006). Stable energy balance can be achieved by consuming consistent amount of foods
at time periods that optimize nutrient utilization and minimize unnecessary storing,
thereby improving body composition.
Measuring hourly energy balance to optimize absorption and storage of specific
nutrients may provide a practical strategy for obese individuals to improve body
composition. The purpose of this study is to observe current dietary habits and hourly
energy balance of college students with different BMI categories, below and above a
BMI of 30, to determine if there are differences between body composition and hours
5
Hypothesis
The subjects in this study with a BMI above 30 will spend more time in an energy surplus
or deficit outside of the range of ± 400 kcal energy balance.
Null Hypothesis
There will not be a difference in BMI for subjects spending more time in an
6 Chapter II
Review of Literature
College Students
Inconsistent schedules and the high stress environment of a college campus may
play a role in the eating habits of university students (Childers et al., 2011). In a national
survey conducted in 2005, 3 out of 10 students were overweight (BMI [25.0-29.9 kg/m²])
or obese (BMI ≥ 30.0 kg/m²). The American College Health Association-National
College Health Assessment conducted a survey in 1998 assessing the health
characteristics and behaviors of university students. The survey was completed at 71
universities throughout the U.S. and included 51,199 students. The survey found that only
7% of students reported eating the recommended amount of fruits and vegetables per day
(≥5 per day). Six out of 10 students participated in fewer than three days per week of
vigorous or moderate exercise ("American College Health Association National College
Health Assessment [ACHA-NCHA] Spring 2005 Reference Group Data Report
[Abridged]," 2006).
Similar research conducted in Saudi Arabia collected data from 357 male students
through a self-reported questionnaire about eating habits. They found that 63.3% of
students reported irregular meal consumption with 55.7% consuming only two meals per
day. Vegetables and fruits were not frequently consumed and 46.8% of the students
reported consuming fried food at least three times per week (Al-Rethaiaa et al., 2010). A
7
found that 26% of students reported breakfast skipping every day and 33% reported
consuming breakfast only 1-3 days per week (Spanos & Hankey, 2010).
College students have several barriers, which may inhibit healthy food choices
including time constraint, access to unhealthful food, and high monetary costs associated
with healthful behaviors (Greaney et al., 2009). These factors may put this population at
an increased risk of preventable diseases such as diabetes and cardiovascular disease.
This study utilized university students between the ages of 19-30 years at Georgia State
University to assess whether stable energy balance is correlated with ideal body
composition and therefore could serve as a potential strategy for improved body
composition for this population.
Factors affecting Energy Balance
Weight regulation is traditionally maintained by consuming equivalent energy
intake as energy expended in a 24-hour period. To lose weight, it is suggested to consume
less energy than expended and therefore remain in a negative energy balance. However,
this traditional view fails to consider the fluctuating nature of energy balance throughout
the 24-hour period (Hall et al., 2012). The body is in a constant state of negative and
positive energy balance. The hormonal and biological cues associated with negative and
positive energy balance will fluctuate just as frequently throughout the day and will
influence body weight and composition (Guyenet & Schwartz, 2012). Many factors will
influence these hormonal cues including composition of food consumed, amount of food
8
will then regulate the utilization of these nutrients for storage or expenditure (Guyenet &
Schwartz, 2012).
Other variables influenced by energy balance include digestive capacity,
absorption and utilization. Absorption will be dependent on the components and amount
of intake which are all dependent on the individual, how the food is prepared and
intestinal factors (Hall et al., 2012). Once nutrients are absorbed, nutrient utilization will
vary depending on energy needs and storage capacity. When the amount of ingested food
exceeds the typical amount of nutrients that can be absorbed and utilized effectively at
one period, the nutrients may be converted to a storage form.
Protein can only be utilized in certain amounts at one sitting. Most individuals can
consume ~30 g of protein in one sitting to maximize muscle protein synthesis (Schutz,
2011). However, protein consumed in excess of this amount may be denitrogenated and
converted to a different energy substrate or stored in the adipose tissue (Schutz, 2011).
Data from NHANES has found that Americans typically consume only a modest amount
of protein in the morning (13 g) and consume three times that amount at dinner (38 g)
(Mamerow et al., 2014). More balanced distribution of protein throughout the day can
maximize muscle synthesis and discourage muscle breakdown. Mamerow et al. (2014)
studied protein and calorie distribution throughout the day and the effects on muscle
synthesis. Eight participants (5 males and 3 females) between the ages of 25 and 55 years
consumed two 7-day diets with an even distribution or a skewed distribution of energy
and protein. In the skewed distribution, dinner contained the most energy and protein
(1100 kcals and 63 g, respectively) whereas breakfast contained the least (537 kcals and
9
protein per meal. Both diets contained equal amounts of daily energy (2320-2400 kcals)
and daily protein (94-90 g). They found that even consumption of protein throughout the
day stimulated muscle protein synthesis 25% greater than skewed consumption of
protein. More even protein distribution throughout the day may be achieved while
simultaneously remaining in stable energy balance.
The physiological inability to utilize all daily nutrient needs at one sitting
promotes a division of daily nutrient needs into meals and snacks. The standard western
meal pattern consists of three meals per day, breakfast, lunch and dinner with any
additional eating occasions considered to be snacks. In the energy balance system, meals
and snacks will distribute consumed energy over a span of time and adjust the daily
energy balance ratio throughout the day. The number of meals and snacks consumed has
thus been implicated as a way to measure the effects of energy balance on weight and
health indices through research.
An assumption can be made that consistent and frequent meals suggest a more
stable energy balance while avoiding long periods of time in negative (< -400 kcal energy
balance) or positive (>400 kcal energy balance) energy balance. Meal frequency can
serve only as an indirect indicator of possible changes in energy balance.
Meal Frequency and Obesity Markers
Several studies have measured the relationship between obesity and meal
frequency through diet records and food recalls (Ma et al., 2003; Ritchie, 2012). Richie,
(2012) measured the dietary patterns of 2,372 adolescent girls (1213 black girls and 1166
10
Study. Girls were recruited in three clinical centers: Berkeley, CA, Cincinnati, OH, and
Washington, DC. Adolescents were between the ages of 9-10 years at the time of
enrollment. The subjects provided annual information on nutrition and physical activity
patterns and anthropometric measurements were performed by examiners. To collect
nutrition information 3-day food records (2 weekdays and 1 weekend day) were collected
and analyzed every year for 10 years, except year 6 and 9. The number of meals, snacks,
and eating episodes were comprised regardless of amount or type of food or beverage
reported. A meal was defined as ≥15% of total calories, regardless of the time of day or
composition of foods or beverages. The snacks were defined as all other eating episodes.
Decreased meal frequency was associated with increased BMI and waist circumference
in the 10-year span (Ritchie, 2012).
Ma et al. (2003) analyzed the diet of 499 participants in the Massachusetts area
aged 20-70 years using repeated 24-hour food recalls. Participants were followed up
every three months for a year with serum lipid samples and body weight collected along
with a 24-hour food recall and physical activity record at every follow-up. Eating
episodes consisted of a minimum of 50 kcals with a time interval of at least 15 minutes.
Each of the eating episodes was then tallied for all recalls. Participants ate on average
3.92 times per day. The number of eating episodes was inversely associated with the risk
of obesity. Participants who ate four or more episodes per day had a 45% decreased risk
of obesity. Skipping breakfast was associated with a 4.5 times higher risk of obesity (Ma
et al., 2003).
Bachman et al. (2011) measured meal frequency using 24-hour telephone food
11
subjects, weight loss maintainer subjects and normal weight subjects. Eating occasions
were defined as ≥50 kcals with 60 minutes separating eating occasions. Meals and snacks
were participant defined. A total of 257 subjects were interviewed with 81 overweight
subjects, 96 weight loss maintainers and 80 normal weight subjects. Meal frequency was
higher in weight loss maintainers and normal weight subjects compared to overweight
and obese subjects (2.0 ± 1.0 snacks/day and 2.3± 1.1 snacks/day versus 1.5 ± 1.2
snacks/day, respectively). BMI was negatively correlated with snack consumption. This
study suggested that three meals and two snacks per day was the most beneficial
combination (Bachman et al., 2011).
Decreased meal frequency may additionally have a negative effect on lipid
markers. In a crossover design study comparing meal frequencies and lipoprotein and
glucose indices, 17 subjects with fasting cholesterol concentration below the 50th
percentile for New Zealanders of their age and sex were recruited and completed this
study. Subjects did not have a history of hyperglycemia or any other serious medical
conditions. The 4-week protocol consisted of two isoenergetic diets consumed in a three
meal and a nine meal diet plan for two weeks each. The subjects were allotted a daily
energy allowance based off of an initial 3-day diet record that was completed to represent
subject normal intake. The three meal per day diet period divided energy through the day
as follows: breakfast 25%, lunch 25%, dinner ~50% and a single small snack (~<600kJ)
to be consumed as desired. During the nine meal diet plan, the three meal per day eating
regimen was divided into three smaller meals distributed as follows: early morning 8.3%,
breakfast 8.3%, midmorning 8.3%, lunch 8.3%, midafternoon 8.3%, late afternoon 8.3%,
12
yielded lower total cholesterol and LDL-C with a 6.5% decrease and 8.1% decrease
respectively (Arnold et al., 1993). However, a similar study conducted with 11 females
measured a nibbling versus gorging diet for two weeks. The nibbling diet consisted of 12
meals per day and the gorging diet consisted of three meals per day. No significant
differences existed in the fasting or postprandial plasma concentrations of triacylglycerol,
glucose, immunoreactive insulin, GIP and GLP-1 levels. There were no differences
between fasting total and LDL-C concentrations (Murphy et al., 1996).
Meal Skipping
Meal skipping is frequently encountered in higher stress jobs and shift work
(Atkinson et al., 2008). The unpredictable schedules of college students may additionally
impact the ability to maintain a routine meal frequency. University students in
Cheongju would frequently miss breakfast because of limited time (Lee & Yoon, 2014).
Meal skipping has been shown to singularly increase risk of poorer health
outcomes. House et al. (2013) analyzed the relationship between eating frequency and
dietary, metabolic, adiposity and physical activity measures in children. The sample
included 185 Hispanic and African-American children and adolescents (8-18 years old)
in the Southern California area with a BMI ≥ 85th percentile for age and gender.
Exclusion criteria included participation in a physical activity, nutrition or weight
reduction program or diabetes. Dietary intake was assessed from two or three 24-hour
recalls. Meal skippers were classified as eating less than three times per 24 hours and
normal/frequent eaters were classified as those who at three or more meals per 24 hours.
13
previous eating occasion. The study included 54 males and 131 females. The average
number of eating occasions per day was 3.8 ± 1.0. Meal skippers ate significantly fewer
calories, however they had 18% higher triglycerides and 26% higher visceral adipose
tissue in comparison to normal frequency eaters (House et al., 2013).
Jaaskelainen et al. (2013) conducted an ongoing, population-based study covering
births in the northernmost provinces of Finland between July 1, 1985 to June 30, 1986.
The study followed the parents and children via postal questionnaires for 16 years. At the
16-year follow-up, the adolescents filled out a questionnaire regarding meal patterns
categorizing meals as five meals per day including breakfast (regular meal pattern), ≤
four meals per day including breakfast (semi-regular meal pattern), and ≤ four meals per
day not including breakfast (breakfast skippers). The regular meal pattern in comparison
to the breakfast skippers was associated with reduced risk of overweight/obesity (61% in
boys, 43% in girls), abdominal adiposity (73% in boys, 44% in girls) in all adolescents,
and hypertriglyceridaemia and low HDL-C in boys (Jaaskelainen et al., 2013).
Meal Consistency and Timing
Meal consistency from day to day has been implicated to play a role in obesity.
Farshchi et al. (2004) investigated the impact or irregular meal frequency on circulating
lipids, insulin, glucose and uric acid. Nine women aged 18-42 years with no self-reported
hypercholesterolaemia, hyperglycemia or other serious medical condition participated in
three phases of a randomized crossover trial. The subjects consumed a regular (6 meals/d)
and irregular meal frequency (3-9 meals/d) for 14 days each. Irregular meal pattern
14
regular meal pattern. Irregular meal frequency caused increased cholesterol and LDL-C
compared to a regular meal pattern (Farshchi et al., 2004). All of these markers are
suggestive of an increased risk of cardiovascular disease.
The association between timing of meals and obesity has been frequently tested.
Consumption of breakfast has consistently produced an inverse relationship to obesity
(Rampersaud et al., 2005). In a literature review conducted with the inclusion of 47
studies pertaining to breakfast consumption in adolescents, breakfast eaters were less
likely to be overweight and obese. The amount of energy supplied by breakfast was lower
in obese subjects (Rampersaud et al., 2005). However, other meals have not consistently
been evidenced by an association with obesity. Wang et al. (2013) utilized data from The
Energetic Study to assess the association of energy intake throughout the day with the
risk of obesity in a subsample of participants. Subjects from nearby the Los Angeles area
between the ages of 21-69 years were recruited for the study. Participants (n=249)
completed eight Web-based 24-h dietary recalls and completed additional
self-assessments including a physical activity questionnaire when visiting the clinic. Morning
meals were categorized between 12:00AM-11:00AM, midday between
11:00AM-4:00PM, and evening between 4:00-12:00AM. The study found no relationship between
participants eating >33% of energy at breakfast and obesity, an inverse relationship
between participants eating >33% of energy at lunch and obesity and a positive
relationship between participants eating >33% of energy at dinner and obesity (Wang et
al., 2013). This suggests that the traditional American meal consumption of a larger meal
at night may be negatively affecting BMI. Maintaining a consistent energy balance
15
Body Composition and Meal Frequency
Another measure of the effects of meal frequency can be demonstrated through
changes in body composition. Improvements in body composition have been found
through increased meal frequency (Arciero et al., 2013). Arciero et al. (2013) conducted a
study utilizing 28 subjects who participated in a 62-day nutritional intervention consisting
of a six dietary treatments, a traditional three meal per day intake versus a six meal per
day intake with either traditional (~15%) versus higher (~35%) protein intakes during 28
days of energy balance or deficit. All participants were inactive (<30 min, 2 days per
week of structured physical activity), overweight or obese (BMI ≥ 25), and were weight
stable for six months prior to the study. Subjects were quasi-randomly assigned to one of
three groups to balance BMI, body weight and body fat % in each group. The three
groups were three meals per day, three meals per day with higher protein, or six meals
per day with higher protein. Initially all subjects consumed a control diet during day -4-0.
The control phase diet consisted of 25% protein, 45% carbohydrate and 30% fat. Subjects
then consumed an energy balanced diet during day 1-28. During day 29-56 subjects
consumed a negative energy balanced diet. Meal timing varied with each participant. The
evening meal needed to be consumed by 8:00PM and within two hours of going to bed.
Subjects on the six meal per day plan were instructed to eat approximately every 2 ½ -3
hours during the day. During energy balance when consumed in six meals, a higher
protein intake (~35%) decreased total and abdominal body fat percentage and increased
16
decreased total and abdominal body fat and increased thermogenesis (Arciero et al.,
2013).
Body composition is particularly important for athletes. Weight loss that includes
lean body mass would be undesirable as it may translate into decreased athletic
performance. Iwao et al. (1996) conducted a study in university boxers during a period of
energy restriction to induce weight loss. The subjects consumed two meals per day or six
meals per day from a commercially available liquid food. The diet was followed for 14
days. Prior to food restriction, no differences in lean body mass were noted between
groups. After food restriction, the two meals per day athletes had significantly lower lean
body mass than the six meals per day athletes. In athletes, increased meal frequency has
been found to have a similar advantage in maintaining lean body mass by decreasing
muscle protein breakdown (Iwao et al., 1996).
Inconsistencies in Meal Frequency Research
Though a highly tested area of research, meal frequency studies often fail to
thoroughly account for energy expenditure and the changes throughout the day in relation
to energy intake. Without accounting for changes in energy expenditure per subject, these
studies may inaccurately provide a rationale for increased or decreased meal frequency
without thoroughly assessing the benefits or detriments of meal frequency.
Opponents to meal frequency have suggested that increasing meal frequency may
increase hunger because of the frequent food encounters. Ohkawara et al. (2013)
conducted a randomized, crossover trial comparing a three-meal-per-day pattern to a
17
diseases). They measured changes in 24-hour fat oxidation and perceived hunger. The
subjects consumed each diet for four days through a controlled outpatient diet, with the
food received from the research site. The distribution of macronutrients in each diet
consisting of 30% kcal from fat, 55% kcals from carbohydrate and 15% kcals from
protein. No difference was found between 24-hour energy expenditure, RQ and fat
oxidation. Higher hunger ratings were reported when subjects consumed six meals per
day versus three meals per day. However, insulin AUC response was lower during the six
meal consumption (Ohkawara et al., 2013). Though the study suggests lower insulin
levels may explain the increase in hunger, lower insulin levels may also lead to decreased
lipogenesis and may thereby improve body composition in the long run (Czech et al.,
2013). Additionally, FFA concentrations fell following consumption of the first meal and
remained below fasting levels throughout the remainder of the day for subjects
consuming six meals per day (Ohkawara et al., 2013). Elevated FFA are associated with
obesity and may increase insulin resistance by reducing insulin stimulated glucose
uptake, therefore lower FFA may be a positive effect of increased meal frequency
(Boden, 2008).
Though many studies have found decreased intake ab libitum with increased meal
frequency, there is research to suggest that increased meal frequency does not decrease
satiety and will increase daily energy consumption. Leidy et al. (2011) conducted a study
to compare energy restriction with higher protein versus normal protein consumed during
three eating occasions or six eating occasions. They found no difference in hunger
between the two meal frequency groups in regards to hunger, fullness, desire to eat or
18
occasions led to greater evening and late night hunger (Leidy et al., 2011). Other studies
have found similar results where meal frequency has not led to significant differences in
adiposity indices, appetite measurements or gut peptides (Cameron et al., 2010). This
variation may be related to the amount of food consumption in the study atmosphere as
compared to typical food consumption outside of the study setting. Additionally, the
length of the study may not have been sufficient to notice changes from the research.
Hormonal Regulation of Energy Balance
The start and end of a meal or snack are influenced by a variety of interactions
between genetic, social, learned, environment, circadian and humoral cues (Guyenet &
Schwartz, 2012). Hunger and satiety will influence the amount of food consumed and
may be altered related to energy balance status. Hunger is better understood through
hormonal changes that occur throughout the day.
After long periods without energy consumption and negative energy balance,
hypoglycemia and hunger will inevitably ensue. This condition directly influences meal
choice and energy consumption. Hypoglycemia induces a state of energy craving where
the body will seek energy in any form. Schultes et al. (2005) found that induced
hypoglycemia interfered with memory tasks. In the study, performance and memory of
“food related” stimuli were higher than “non-food related” stimuli after a hypoglycemic
level of 2.6 mmol/l (Schultes et al., 2005). This suggests that hypoglycemia induces a
state of food craving and cognitive disruption to focus on alternative tasks with the sole
19
Hypoglycemia may additionally lead to dietary unrestraint and poor choices to
satiate extreme hunger. Dewan et al. (2004) studied the relationship of insulin induced
hypoglycemia and regulation of food intake. Sixteen healthy men at normal BMI, aged
29 ± 11 years old participated in the study. After an overnight fast and a bolus of insulin
or saline, participants consumed a meal ad libitum and recorded feelings of hunger and
fullness using VAS. The foods provided were categorized into high fat and low fat foods.
Participants partook in the protocol twice and the results were averaged. Caloric intake
was 17% greater following insulin compared to saline (1701.1 ± 895.3kcal vs 1427.7 ±
815 kcal). Total fat intake was higher after insulin (Dewan et al., 2004). This study finds
uninhibited eating will be heighted in extreme hypoglycemia and negative energy
balance.
Extreme hunger levels were found in other studies to lead to poor dietary choices
and often excessive energy intake. Meal frequency is directly related to hunger levels.
Several studies have supported the theory that increased meal frequency leads to lower
hunger levels (Allirot et al., 2013; Allirot et al., 2014). These studies assessed various
markers to prove this theory. Allirot et al. (2014) studied the effects of a spread out meal
on appetite, metabolism and food intake in the subsequent ad libitum meal. Seventeen
obese men participated in this randomized cross-over design study. The subjects were
given a 678 kcal breakfast either in one 20 minute long eating episode or four 10 minute
long eating episodes. The subjects were then offered ad libitum lunch four hours later.
They found that an isocaloric spread out breakfast-decreased appetite when measuring
electronic visual analog scores (VAS). Additionally, the spread out breakfast was
20
number of grams however the energy intake was not decreased. When this protocol was
tested in nineteen lean, normal weight men, significantly less energy was consumed at
lunch after an isocalorically spread out breakfast when compared to a single eating
episode (Allirot et al., 2013). Similarly, seven obese men consumed either a single
pre-load meal or a pre-pre-load meal spread out over a five hour period. They were required to
consume the entire pre-load meal and then the test meal was supplied ad libitum. When
given a single pre-load meal, significantly more energy was consumed in the ad libitum
test meal. While the effects on hunger levels remained the same when measured through
VAS, the amount of food ingested was higher in the single meal versus the multiple
meals (Speechly et al., 1999).
The hypoglycemic state will be indicative of negative energy balance. After a
long period in negative energy balance, the subsequent meal may be high energy. This
high-energy meal will increase blood glucose and exponentially increase insulin release.
A high insulinemic state has been found to induce a lipogenic state and increase fat
storage (Kanaley et al., 2013; McNay et al., 2013; Woods et al., 2006). Though daily
energy balance may remain stable with calories in equivalent to calories out, lipogenic
hormones will be stimulated after ingestion of a large bolus meal. These lipogenic
hormones may increase fat storage and therefore fat mass after long periods in negative
energy balance and consequent high-energy meals.
Increased meal frequency and stable energy balance has been recommended as an
alternative treatment to maintain optimal blood glucose (80-120mg/dL) and insulin levels
in diabetes. Bertelsen et al. (1993) included 12 non-insulin dependent diabetic subjects in
21
isocaloric small meals in 80-minute intervals or two large isocaloric meals in a 240
minute interval. The incremental blood glucose area was lower in response to frequent,
small meals. Free fatty acid levels remained low in the subjects consuming frequent,
small meals, however rose in response to a few large meals. The incremental insulin
response was lowest in response to frequent meals. The study concluded that frequent
meal consumption acutely reduced blood glucose, lowered average insulin and free fatty
acid levels in non-insulin dependent diabetic subjects (Bertelsen et al., 1993). The
metabolic response can be indicative of a metabolic protective effect for non-diabetic
individuals consuming small, frequent meals.
Summary
Though the 24-hour measure of energy balance has become the standard,
within-day changes in energy balance may more significantly influence body composition. This
study seeks to further examine within-day energy balance by measuring the continuously
changing energy balance ratio throughout the day. The traditional 24-hour view of energy
balance may provide an inefficient representation of energy balance because of the
hormonal changes, glycemic level, absorptive changes, and storage capacity. Assessing
within-day energy balance may provide a more accurate view of the frequently changing
22 Chapter III
Methods
Inclusion Criteria
Individuals were eligible to participate if they were between the ages of 19-30
years and had a BMI ≥18.5. Exclusion criteria include metabolic conditions such as
dyslipidemia, diabetes and cardiovascular disease per subject report. Additional exclusion
criteria include affiliation with prior nutrition counseling at the Recreation Center as well
as affiliation with a Georgia State University course instructed by Dr. Dan Benardot.
Participants agreed to complete four days of diet and physical activity record and
participate in a body composition analysis. Procedures were approved by Georgia State
University’s Institutional Review Board.
Subjects
The majority of recruitment for the study was completed at the Georgia State
University Recreation Center through word of mouth. Consent was obtained from the
Recreation Center prior to subject recruitment and data collection. The sample of the
study was 17 university students between the ages of 19-30 years. Participation in the
study was voluntary and each participant signed a written consent form. The data
collection was partially conducted at the Georgia State University Recreation Center and
23
Food Record
The subjects completed a four-day food and physical activity record. Hourly
energy intake and expenditure were recorded. Intake was predicted based on hourly
consumption of food and beverages. Expenditure was assessed based on hourly physical
activity. Subjects reported physical activity based on a 1-7 scale rating the difficulty of
the activity and the time spent at that level of exertion. Energy balance was predicted in
hourly units. Subjects’ energy balance was predicted based on their weight, height, time
and amount of energy intake, and physical activity level reported in the food and physical
activity record. Energy balance was predicted through hourly intake and expenditure to
establish the specific time and length of time a subject was in positive or negative energy
balance. The subjects were educated on how to record their food intake and serving sizes
to ensure validity of the food record. They were also instructed to consume their regular
diet.
Study Protocol
Each subject received a brief education session about how to thoroughly write a
food log and estimate appropriate serving size. The subjects were given the diet and
physical activity log to be completed. The subjects completed the four-day diet records (3
weekdays and 1 weekend day) with no requirement that they track consecutive days. The
subjects reported to the laboratory to turn in their records. At the research site, weight,
height and body water weight was collected using a Multi Frequency Segmental Body
24
research site, additional questions were asked regarding their logs to clarify any
incomplete components of the food and physical activity logs. The food and physical
activity logs were assessed using NutriTiming®.
Data Analysis
Intake was analyzed using standardized items most similar to the log or searching
the nutrient information of the given item online. If portion sizes were not provided, they
were estimated using the suggested serving size. Physical activity was assessed using a
scale from 1.0-7.0 as a representative value for activity factor per unit time of activity.
Harris-Benedict (REE) is multiplied by these factors to assess the energy expenditure
throughout the day("Recommended Dietary Allowances," 1989).
Four days of data entry were assessed and the averages were derived from all four
days. Variables evaluated included energy intake, energy expenditure, ending energy
balance, kcals per kg, kcals per kg active, hours optimum, hours in high surplus, hours in
high deficit, hours anabolic, hours catabolic, the highest surplus and the highest deficit.
Energy intake was assessed from the average kcal intake of the four-day diet records.
Hours in high deficit included the number of hours spent < -400 kcals energy balance.
Hours high surplus included the number of hours spent above > 400 kcals energy
balance. The highest surplus indicates the highest average daily peak in energy balance
for the four days. The highest deficit indicates the lowest average drop in energy balance
for the four days.
25
The data were analyzed using SPSS (version 20.0, SPSS Inc. Chicago, IL) data
software. A Spearman Rho Correlation test was used to assess the correlation between
energy balance and body composition variables. An independent group T-Test was used
to compare subjects with a BMI ≥30 and subjects with a BMI < 30 to within day energy
balance variables. A regression analysis assessed energy balance variables and body
composition. Energy balance variables include minutes spent in negative energy balance
and positive energy balance, energy surplus, and energy deficit, calorie level of energy
surplus, and calorie level of energy deficit. Body composition variables include percent
26 Chapter IV
Results
Participant Characteristics
Data were included on a total of 17 subjects (9 males/8 females). The age range of
the subjects was 20-28 years with a mean age of 23 ± 2.6 years. The mean weight of the
subjects was 85 ± 19.8 kg and the mean height was 170 ± 8.5 cm. The mean body fat %
of the participants was 27.08 ± 11.5 %. The mean BMI of the participants was 29 ± 5.8.
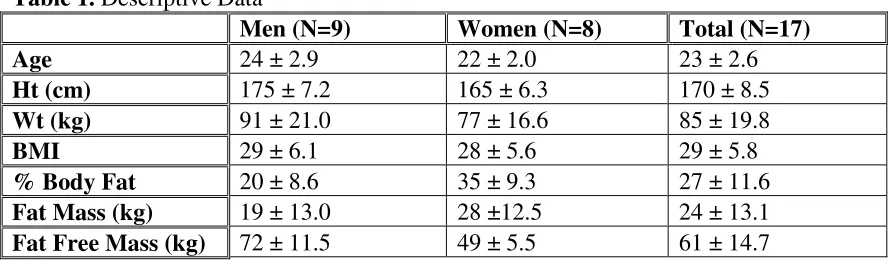
Anthropometric variables for men and women were compared through an
independent samples T-Test. The mean height (cm), weight (kg), BMI and body fat %
were compared for men versus women. No significant differences existed between
groups for BMI and weight (kg). Height (cm) and body fat % were significantly different
(p=0.007 and p=0.004 respectively). These findings are expected given that men typically
[image:38.612.102.546.540.670.2]have higher fat free mass and are typically taller than women.
Table 1. Descriptive Data
Men (N=9) Women (N=8) Total (N=17)
Age 24 ± 2.9 22 ± 2.0 23 ± 2.6
Ht (cm) 175 ± 7.2 165 ± 6.3 170 ± 8.5
Wt (kg) 91 ± 21.0 77 ± 16.6 85 ± 19.8
BMI 29 ± 6.1 28 ± 5.6 29 ± 5.8
% Body Fat 20 ± 8.6 35 ± 9.3 27 ± 11.6
Fat Mass (kg) 19 ± 13.0 28 ±12.5 24 ± 13.1
27
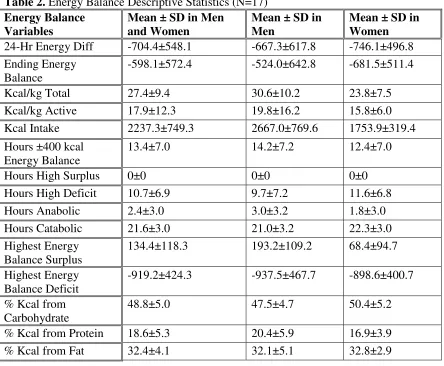
Energy balance descriptive data are provided in Table 2. The average number of
kcal consumed per day was 2237.3 ± 749. The mean kcals/kg total was 27.4 ± 9.4. The
subjects consumed a balanced array of nutrients consuming 48.8% of kcals from
carbohydrates, 18.6% of kcals from protein and 32.4% of kcals from fat.
Participants spent more time in negative energy balance (hours catabolic) at 21 ±
3 hours then in a positive energy balance (hours anabolic) at 2 ± 3 hours. None of the
participants spent time in high surplus (>400 kcals energy balance). Subjects spent on
average 10.7 ± 6.9 hours per day in high deficit (< -400kcals energy balance). This shows
[image:39.612.104.548.353.719.2]that subjects spent the majority of their day in negative energy balance.
Table 2. Energy Balance Descriptive Statistics (N=17) Energy Balance
Variables
Mean ± SD in Men and Women
Mean ± SD in Men
Mean ± SD in Women 24-Hr Energy Diff -704.4±548.1 -667.3±617.8 -746.1±496.8
Ending Energy Balance
-598.1±572.4 -524.0±642.8 -681.5±511.4
Kcal/kg Total 27.4±9.4 30.6±10.2 23.8±7.5
Kcal/kg Active 17.9±12.3 19.8±16.2 15.8±6.0
Kcal Intake 2237.3±749.3 2667.0±769.6 1753.9±319.4
Hours ±400 kcal Energy Balance
13.4±7.0 14.2±7.2 12.4±7.0
Hours High Surplus 0±0 0±0 0±0
Hours High Deficit 10.7±6.9 9.7±7.2 11.6±6.8
Hours Anabolic 2.4±3.0 3.0±3.2 1.8±3.0
Hours Catabolic 21.6±3.0 21.0±3.2 22.3±3.0
Highest Energy Balance Surplus
134.4±118.3 193.2±109.2 68.4±94.7
Highest Energy Balance Deficit
-919.2±424.3 -937.5±467.7 -898.6±400.7
% Kcal from Carbohydrate
48.8±5.0 47.5±4.7 50.4±5.2
% Kcal from Protein 18.6±5.3 20.4±5.9 16.9±3.9
28
BMI
BMI was correlated with several energy balance variables for all subjects. BMI
was positively correlated with hours high deficit (r= .684, p=0.002). BMI was negatively
associated with hours optimum (r= -.684, p=0.002). In women, BMI was negatively
correlated with kcal/kg total (r= -.810, p=0.015).
In an independent samples T-test, measuring the difference between energy
balance variables, e.g. hours ±400 kcal energy balance and hours high deficit and subjects
with a BMI≥30 and <30 depicted in Table 3. There was a statistically significant
difference between subjects with a BMI≥30 and <30. Subjects with a BMI≥30 had
significantly more hours in a high deficit (mean 14.9 hours) compared to subjects with a
BMI<30 (p= 0.01). Subjects with a BMI<30 spent significantly more time in ±400 kcal
energy balance than subjects with a BMI≥30 (p=0.01). These data shows that subjects
with a BMI≥30 spend significant more time in high negative energy balance (< -400
kcals energy balance) suggesting that this may be an undesirable state for individuals
seeking weight loss.
Table 3. Mann-Whitney U Test Comparing BMI ≥ 30 to BMI < 30 in Men and Women
BMI N Mean Std. Deviation Sig. (2-tailed)
Hours High Deficit ≥ 30 <30 8 9 14.87 6.90 4.70
6.59 0.012
Hours ±400 kcal energy balance ≥30 <30 8 9 9.13 17.11 4.70
29
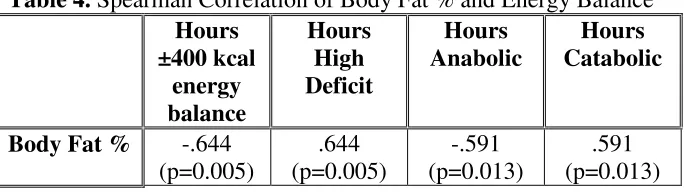
Body Fat Percent and Energy Balance Variables
Body fat % of all participants was compared to the highest energy surplus, highest
energy deficit and kcal intake. Body fat was negatively correlated with the amount of
time in ±400 kcal energy balance (r= -.802, p=0.017). Participants with the lowest body
fat spent significantly more time in ±400 kcal energy balance compared to participants
with higher body fat %. Body fat % was positively correlated with hours in high deficit
(r= .802, p=0.017). Participants with higher body fat % spent more hours in high deficit
(< -400 kcals energy balance). Highest energy surplus and deficit were the lowest and
highest point of energy balance for each participant along the four-day average record.
Body fat% was negatively associated with highest energy balance surplus (p=0.01),
highest energy balance deficit (p=0.05) and kcal intake (p=0.01). Those with the highest
body fat had the lowest energy balance surplus, energy balance deficit and kcal intake.
These data show that contrary to typical recommendations, higher kcal consumption was
not correlated with higher body fat %. These data also show that typical energy balance
variables may influence body fat % as those in the highest energy balance surplus and
highest energy balance deficit had higher body fat %, suggesting that extreme drops or
peaks in energy balance may be undesirable and more steady energy balance may be
more desirable for body composition.
To further examine the differences within the subjects, men and women were
separated. Body fat %, BMI, kcal intake, kcal/kg total, and hours high deficit were
correlated using a spearman rho correlation test. No statistically significant results were
found between men (n=9) except body fat % was positively correlated with BMI (r=.803,
30
demonstrating that higher BMI in this population would be undesirable. Body fat % was
also negatively correlated with kcal/kg total (r= -.703, p=0.035). This suggests that those
consuming more kcals/kg had lower body fat %, an unexpected result given typical
recommendations that weight loss can be induced through decreased kcals.
The same test was run in women (n=8). Body fat % was negatively correlated
with kcal/kg total (r= -.738, p=0.037). Just as in men, those with a higher body fat
consumed less kcals/kg. The number of hours high deficit was negatively correlated with
kcal/kg total (r=-.778, p=0.023) and positively correlated with body fat % (r=.802,
p=0.017). Therefore in women, those spending more time in high deficit (< -400 energy
balance) had a higher body fat %. This suggests that spending time in high negative
energy balance may not be desirable for body composition. The fat free mass to height
ratio was positively associated with hours high deficit (r=.719, p=0.045) and negatively
associated with time in ±400 kcal energy balance (r= -.719, p=0.045). Those with a
higher fat free mass to height ratio (e.g. less fat free mass compared to their height) spent
more hours in high deficit (< -400 kcals energy balance) and less time in ±400 kcal
[image:42.612.104.446.576.672.2]energy balance.
Table 4. Spearman Correlation of Body Fat % and Energy Balance Hours ±400 kcal energy balance Hours High Deficit Hours Anabolic Hours Catabolic
31
In a regression analysis, the variables predictive of fat free mass to height ratio
were the hours catabolic and the highest energy balance surplus for 60% of the sample
(R=.609, p=0.039). Therefore, the larger amount of time spent in a catabolic state and the
higher the energy balance surplus predict lower the fat free mass to height ratio. When
predicting body fat %, the dependent variables that predict body fat % of 70% of the
sample were hours catabolic, the highest energy balance surplus and the highest energy
balance deficit (R=.696, p=0.030). This suggests that the larger amount of time spent in a
catabolic state, the higher the energy balance surplus and the higher the energy balance
deficit predicts the higher body fat %.
Macronutrient Composition
Body fat % was correlated with carbohydrate/kg, protein/kg, fat/kg, and kcal/kg.
Body fat % was negatively correlated with carbohydrate/kg (r= -.659, p=0.002),
protein/kg (r= -.737, p=0.00), fat/kg (r= -.648, p=0.004) and kcal/kg (r= -.742, p=0.004).
Body fat % was higher in subjects consuming the least amount of all macronutrients and
kcals per kg. This indicates that all macronutrients including kcals per kg are less
consumed in subjects with higher body fat % in this sample. This surprising finding may
suggest that decreasing kcal, carbohydrate, protein and fat to a certain degree may
negatively affect body composition and may not be a recommendation for body
32
Daily Changes
To test for within day variation between the samples, a one-way ANOVA tested
for daily differences between hours in ±400 kcal energy balance, hours high surplus,
hours high deficit, hours anabolic and hours catabolic. No significant differences were
found between each of the daily variables. This supports the assumption that the average
of all four days will be a better indicator of changes in body composition compared to
one day versus another. These findings support the use of four days of diet record (3
33 Chapter V
Discussion
Body fat % was found to positively correlate with time in an energy deficit and
negatively correlate with time in ±400 kcal energy balance. Subjects with higher body fat
% spent significantly more time in an energy deficit. Conversely, subjects spending more
time in ±400 kcal energy balance, avoiding low energy deficits had lower body fat %.
These findings are in accordance to previous literature in collegiate athletes (Deutz et al.,
2000). In the study conducted by Deutz et al., 62 elite female athletes (31 artistic
gymnasts, 11 rhythmic gymnasts, 14 long-distance runners and 6 middle distance
runners) from the either the United States National team or nationally/internationally
ranked athletes were assessed for body composition and energy balance utilizing a
Computerized Time-Line Energy Analysis. The number of hours in an energy deficit
greater than 300 kcals was positively associated with body fat %. This finding is
consistent with the current study, as hours in an energy deficit would not be
recommended for body composition improvements. Deutz et al. (2000) found that
athletes who spent the most time in an energy surplus had lower body fat %. Though our
study could not establish a relationship between energy surpluses (>400 kcal energy
balance) as no subjects spent time in this state, the subjects who spent more time in an
anabolic state had lower body fat %. The findings by Deutz et al. (2000) are consistent
with our findings and may suggest that 24-hour energy balance assessment may be
34
In our study, when examining males and females separately, the correlation
between energy deficit and body fat % was significant only for females. Similarly, time
in ±400 kcal energy balance was correlated with body fat % for females only. These
findings indicate that poorer body composition of females was most significantly
correlated with large periods in negative energy balance, potentially mediated through
long periods of time without energy intake or increased energy expenditure through
physical activity without energy intake. This discrepancy between males and females
may be due to the small sample size or may be due to the larger body fat % standard
deviation in women when compared to men (9.3 and 8.6 respectively).
Contrasting evidence was found in a study conducted by Drummond et al. (1998).
Forty two men and 37 women recorded 7 consecutive days of dietary intake and physical
activity. Food diaries included the time of eating. A heart rate monitor assessed 48 hours
of expenditure in the subjects. In men, there was a significant negative correlation
between eating frequency and body weight. There was no significant relationship
between female and body weight or body fat %. They suggest that men compensated for
the extra eating occasions by reducing mean energy per eating episode or increasing
energy expenditure whereas the women did not compensate (Drummond et al., 1998).
This theory may be explained in the current study as the subjects remaining in energy
balance throughout the day had the lowest body fat % compared to those with the highest
deficits throughout the day. In the present study, subjects who did not compensate for
increased energy expenditure throughout the day with increased energy intake had the
highest body fat % whereas subjects who compensated for their energy expenditure and
35
Body fat % was negatively correlated with kcals/kg, carbohydrate/kg, protein/kg
and fat/kg. These findings suggest that those consuming the least amount of all nutrients
had higher body fat %. These results may be explained by changes to the thermic effect
of food with varying degrees of underfeeding. There is a clear downregulation of resting
energy expenditure as calories consumed are decreased (Jebb et al., 1996; Luke &
Schoeller, 1992). This may explain the correlation found in this study as those consuming
the least amount of nutrients may have lower resting metabolic rate.
This study utilized both BMI and body composition as predictors of health.
Higher measurements of both BMI and body fat % have been correlated to increased risk
of cardiovascular disease (Javed et al., 2014). However, BMI solely utilizes a ratio of
weight (kg) to height (m) without considering fat to fat free mass (Heinrich et al., 2008).
Current research has found body composition may be more sensitive when categorizing
obesity (Heinrich et al., 2008; Javed et al., 2014). Javed et al. (2014) conducted a
meta-analysis of studies comparing BMI and body fat % measurements in adolescents aged
4-18 years. Thirty seven studies met the inclusion criteria and found a sensitivity of 73%,
indicating that over a quarter of the children not labelled as obese by BMI might indeed
have excess adiposity. This is especially important for children and young adults as
excess fat mass at these stages of life may translate into future health risks and this could
be prevented by early intervention (Javed et al., 2014). The current study found
significant results when analyzing both BMI and body composition related to energy
balance. However, analyzing both of these measurements is essential for health
36
Some of the strengths in this study the amount of time subjects tracked their food
and physical activity. Four days (3 weekdays and 1 weekend day) provide sufficient
information to ascertain an average intake and energy balance. Additionally, subjects
were educated about tracking their diet and physical activity and were questioned after to
ensure completion of the records.
Some bias may have occurred from recruitment as the subjects were primarily
recruited in the Georgia State University Recreation Center. Therefore, they likely had an
interest in improving their health. This may be a limitation when comparing to the
general university population. Additionally, several limitations exist when subjects
self-report their diets. Underself-reporting and lower consumption of energy while tracking may
interfere with the results. Karelis et al. (2010) found that underreporting was more
common in subjects with higher BMI, fat mass and visceral fat. As the subjects with the
higher BMI and fat mass consistently reported consuming less energy, underreporting
may be responsible for these results (Karelis et al., 2010). Goris and Westerterp (1999)
found that when 27 lean women participated in a study to record their food intake, they
changed their habitual food intake in the recorded week, probably unconsciously done
and ate less than usual (Goris & Westerterp, 1999). This may have occurred in this study
as many subjects consumed less than their needs for weight maintenance and were
consistently in a catabolic state.
Future research might include longitudinal trials addressing within-day energy
balance and the effects on body composition. Clinical weight loss trials could monitor
37
Conclusions
This study found that individuals who spent more time in negative energy balance
with high deficits throughout the day had higher BMI and body fat %. This may support
recommendations for limiting large energy deficits throughout the day. The results from
our study suggest that maintaining stable energy balance may be beneficial for body