VIDEO STREAMING PERFORMANCE AT FTMM, KUiTTHO
Hannani binti Aman, Isredza Rahmi binti A.Hamid, Norhanifah binti Murli, Ruzilawati binti Deraman@Muhammad
Fakulti Teknologi Maklumat dan Multimedia, Kolej Universiti Teknologi Tun Hussein Onn
E-mail: {hanani, rahmi, norhanifah}@kuittho.edu.my, ruzi78@yahoo.com Tel.: +607-4538036, +607-4538043, +607-4538042, +6019-7415334
ABSTRACT
The distribution of digitized video data, whether on-demand or streaming, is rising tremendously among Internet users in Malaysia especially in areas such as education, communication and television broadcasting. Based on this progression, a research has been conducted to study the relationship between network performance and the quality of video data streamed in FTMM, KUiTTHO local area network. Different types of content and category of video data are streamed to the network which is equipped with LAN 100Base T technology. To achieve the objective, experimental approach is applied to different types of video content namely lecture clips, movie clips and music clips. The quality of transmitted video data is very much depended on two main factors which are packet delay and packet loss. Based on the experiment that has been conducted, packet delay is caused by network traffic condition, video content, LAN architecture, hardware and transmission medium used. In addition to this, the experiment also has shown that packet loss is caused by data burst. This situation happened when packet queue is overloading the router. This research confirms that video streaming quality can be upgraded with the use of better communication medium such as fiber optic, the exploitation of up-to-date network hardware, the utilization of bigger capacity hard disk and finally with the use of smaller window scale in displaying the video content.
Keyword: video, video streaming, packet delay, packet loss
Introduction
Jaromil (2002) defines video streaming as a way of transferring digital audio and video signal through data networks. This streaming technology allows client to play video and audio data without the need to download all the data. The technology allows Video on Demand (VOD) and Conferencing applications to be performed on the client side without much delay.
Aspotoplopoulos, et.al(2002) says Internet developed in the middle of 1990’s motivates video communication through networks as a great effort to its evolution. Transferring large files such as audio and video data is not as simple as transferring a single data. Packets which contain data are always delayed and sometimes lost. These kinds of problem shall effects the quality of video being streamed to the client side.
Packet delay is referred as delay jitter as the problems occur on the receiver side (client) while translating and viewing frame in fix rate. Any delay will cause the video data to be played in jerky manners as the frame arrangement is already tampered. Another problem faced by streaming video is packet lost. Type of packet lost depends on the network. Wireless network has to deal with burst error or bit failure, while wired network may just lose any packet. Nevertheless, with the integration of high speed network and modern network technologies, streamed video data can be played smoothly, regardless the data of being complex and of high capacity.
This study is conducted to review the quality of video streaming in our faculty; Faculty of Information Technology and Multimedia (FTMM) from the two aspects already mentioned namely packet lost and packet delay. An experiment is performed to study the relationship between FTMM network system and the quality of video data being transmitted. The same video content is streamed through the same network on a different time range; peak and non-peak hour. The results are then presented in a graphical form that will depict the changes of video quality before transmission and after the client view the data.
Literature Review
In literature study we focus on streaming technology and network channels used to transfer media content. The result of this study could give us a whole picture of what domain we are in.
Technically, streaming technology is defined as transferring a file from a server to the client through web, using packet in which each packet will be tagged with time called stream. In other words it is called as time based streaming. This technology allows client to view the data without downloading its full content. All types of files could be transferred using this manner; however it most suited to time-based media such as video and audio content where it must be played sequentially and uninterruptedly.
There are 2 kinds of media streaming techniques that use Internet Protocol which are On-Demand and Live. On-demand streaming technique displays recorded file resided in server at the client’s browser. Meanwhile, the live streaming technique displays the media content in real time. Both technologies need high bandwidth in providing the best quality of video playback. (Zakaria Kasa, et.al. 2003)
There are 2 techniques for transferring live media to client which are unicasting and multicasting. Unicasting is best suited for on-demand streaming when there is no network mechanism needed and real time streaming is not an issues. But traffic may increase when the number of user is high and increasing (Donny, 2002). However, multicasting is more efficient when the number of users is increased in which it uses the same bandwidth. This technique is suitable for livecasting but a few network mechanisms are needed to support it (Zakaria Kasa, et.al. 2003).
Computer network normally connects two or more computer to share media, resources, fail or to communicate electronically. There are 3 categories of network implementation which are wired network, wireless network and combination of both (Baharuddin Aris, et.al, 2001).
Wired Local Area Network (LAN) connects a few computers in a limited length. Ratliff (1999) defines LAN as a network in which information is shared between many users in an area, such as building or in a metropolitan. As for the configuration, a server computer needs to store and manage the network and all software application. Another computer for user used which link to this server serves as workstation. (Baharuddin Aris, et.al, 2001).
For a remote distance, the connection is through satellite or cellular phone (Baharuddin Aris, et.al, 2001).
Video streaming technology allows user to watch the multimedia content without requires them to download its full content. This kind of technology is our focus in studying the performance of video content transmission.
Methodology
[image:3.612.109.535.294.602.2]The Experimental approach is applied in completing this project. To carry out the experiment, a video streaming server is developed and run on the actual FTMM network. As depicted in Table 1, roughly, the experiment will follow the five phases as suggested from Barnes, et. al.(2005).
Table 1: Phases involved in the project
Phase Steps Involved
Problem Identification 1. Identifying packet delay and packet loss as two common factors of
research in examining video quality transmitted across the FTMM network
2. Identifying the types of video content to be tested (story, movie and
lecture clips)
3. Identifying the suitable time to test the video content to be at 8 a.m.
until 4 p.m.
Planning 1. Test is conducted during class hour (Monday until Friday)
2. Rider 2.0 software is installed in Window Server 2003 server
3. Developing the actual video streaming server on the FTMM
network and make it run properly
4. Each video contents are already encoded to wmv files
5. Video contents are stored in the server and played back by the user
using Windows Media Series 9.0
Controlling 1. The different video contents (story, movie and lecture clips) are
streamed to the network at four different time range (8-10 a.m., 10-12 p.m., 10-12-2 p.m. and 2-4 p.m.)
2. Network emulator Rider 2.0 is installed at the server and at the
client PC
3. Client-Server is connected to 100Mb/s network
Data Analysis 1. Packet loss and packet delay for each transmission is recorded
2. Data is then converted into graph to examine packet loss and packet
delay for each video types at the different experiment time
Result 1. Findings on the relationship between network performance and the
Software requirement
Table 2 below illustrates the software used in this experiment and its functions.
Table 2: Software used
Software Functions
Windows Media Encode To encode video format from mpg to wmv format
Windows Media Series 9.0 Video player on the client’s side
Rider 2.0 To record delay and packet loss occurrences
Microsoft Project To schedule activities involved in the project
Microsoft Excel To record the data and to generate the graphs
Hardware requirement
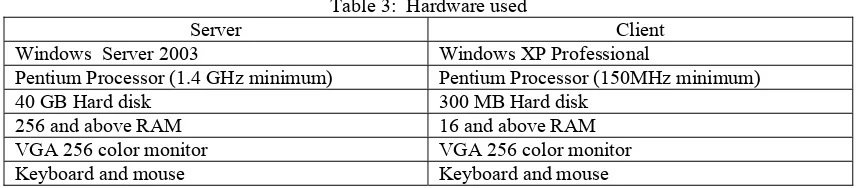
[image:4.612.106.536.304.398.2]Table 3 below shows the hardware used during the experiment.
Table 3: Hardware used
Server Client
Windows Server 2003 Windows XP Professional
Pentium Processor (1.4 GHz minimum) Pentium Processor (150MHz minimum)
40 GB Hard disk 300 MB Hard disk
256 and above RAM 16 and above RAM
VGA 256 color monitor VGA 256 color monitor
Keyboard and mouse Keyboard and mouse
Network Specification
i. 100Base-T full duplex (RJ-45)
ii. Serial Port - RS-232 (D-Sub 9-pin)
iii. 100Base-T Ethernet adapter
Implementation
3 com 4900, 16x1
KUiTTHO CITY CAMPUS SERVER ROOM Switch, 48x1 LECTURER’S ROOM Switch, 48x3
Switch, 48x1
Switch, 48x1 Switch, 24x1 Switch, 48x1
Switch, 48x1 Switch, 48x1 Switch, 48x1
Switch, 48x1 Switch, 48x1 Switch, 48x1
Switch, 48x1 Switch, 48x1 Switch, 48x1
Switch, 48x1
Switch, 24x1 Switch, 48x3
Switch, 48x1 Switch, 48x1
Switch, 48x2
Switch, 48x1 Switch, 48x1
3 Com 3824, 24x1 3 Com 3812, 24x1
INFORMATION TECHNOLOGY CENTER
COMPUTER LAB, ITC2
COMPUTER LAB, ITC2 COMPUTER LAB, ITC1
DIGIT/BASE ELECTRONIC LAB
GRAPHIC &
REPROGRAPHY LAB CEFM LAB (FPT)
AUDIO&VIDEO ANIMATION LAB
Switch, 48x1
Streaming Server Fiber
optic Fiber optic
Fiber optic
COMPUTER FACILITIES DISTRIBUTION LAB
GRAPHIC TECHNOLOGY & MULTIMEDIA LAB
SOFTWARE ENGINEERING LAB
ARTIFICIAL INTELLIGENT LAB
NETWORKING TECHNOLOGY LAB
COMPUTER MAINTENANCE LAB
SCIENCE MGMNT LAB LECTURE ROOM 2
-FTMM FPT OFFICE
INFO. TECH LAB 1
INFO. TECH LAB 2
INFO. TECH LAB 3
LAND PROPERTIES COMPUTER LAB
DEV. COMPUTER LAB
[image:5.612.115.526.124.428.2]SCIENCE MGMT COMPUTER LAB
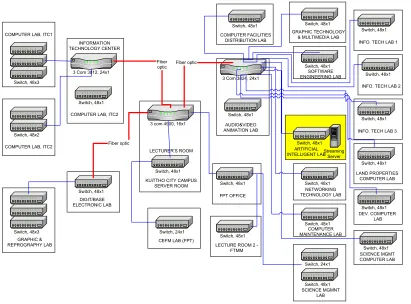
Figure 1: Network Design for KUiTTHO City Campus
[image:5.612.181.461.538.626.2]The streaming server contains three types of video with different sizes as a sample to test the network performance. Tests have been conducted five times between 8.00 a.m. to 4.00 p.m. at Information System Lab and Graphic Technology and Multimedia Lab to measure the delay and loss of packets. Table 4 shows type of video and size for each video. Rider 2.0 software is used to capture the delay and packet lost of the data during the testing.
Table 4: Type and size of videos
Category Type of video Size
1. Story Shin Chan 502 Mb
2. Story Full House 625 Mb
3. Lecture Kuliah 1 58 Mb
4. Lecture Kuliah 2 58 Mb
5. Music Pengorbanan Ibu 4.50 Mb
6. Music Konsert AF3 520 Mb
Average of delay for all sets of video 0 50 100 150 200 250 300 8. 00 - 9 .0 0 9. 00 - 10. 00 10. 00 - 11. 00 11. 00 - 12. 00 12. 00 - 1. 00 1. 00 - 2 .0 0 2. 00 - 3 .0 0 3. 00 - 4 .0 0 8. 00 - 9 .0 0 9. 00 - 10. 00 10. 00 - 11. 00 11. 00 - 12. 00 12. 00 - 1. 00 1. 00 - 2 .0 0 2. 00 - 3 .0 0 3. 00 - 4 .0 0 8. 00 - 9 .0 0 9. 00 - 10. 00 10. 00 - 11. 00 11. 00 - 12. 00 12. 00 - 1. 00 1. 00 - 2 .0 0 2. 00 - 3 .0 0 3. 00 - 4 .0 0 8. 00 - 9 .0 0 9. 00 - 10. 00 10. 00 - 11. 00 11. 00 - 12. 00 12. 00 - 1. 00 1. 00 - 2 .0 0 2. 00 - 3 .0 0 3. 00 - 4 .0 0 8. 00 - 9 .0 0 9. 00 - 10. 00 10. 00 - 11. 00 11. 00 - 12. 00 12. 00 - 1. 00 1. 00 - 2 .0 0 2. 00 - 3 .0 0 3. 00 - 4 .0 0
test 2 test 3 test 4 test 5
[image:6.612.116.526.115.316.2]time A ver ag e Story Music Lecture test 1
Figure 2 : Average of delay for all sets of video
Percentage of packet lost for all types of video
0 5 10 15 20 25 8. 00 - 9. 00 9. 00 - 10 .0 0 10 .0 0 11 .0 0 11 .0 0 12 .0 0 12 .0 0 - 1. 00 1. 00 - 2. 00 2. 00 - 3. 00 3. 00 - 4. 00 8. 00 - 9. 00 9. 00 - 10 .0 0 10 .0 0 11 .0 0 11 .0 0 12 .0 0 12 .0 0 - 1. 00 1. 00 - 2. 00 2. 00 - 3. 00 3. 00 - 4. 00 8. 00 - 9. 00 9. 00 - 10 .0 0 10 .0 0 11 .0 0 11 .0 0 12 .0 0 12 .0 0 - 1. 00 1. 00 - 2. 00 2. 00 - 3. 00 3. 00 - 4. 00 8. 00 - 9. 00 9. 00 - 10 .0 0 10 .0 0 11 .0 0 11 .0 0 12 .0 0 12 .0 0 - 1. 00 1. 00 - 2. 00 2. 00 - 3. 00 3. 00 - 4. 00 8. 00 - 9. 00 9. 00 - 10 .0 0 10 .0 0 11 .0 0 11 .0 0 12 .0 0 12 .0 0 - 1. 00 1. 00 - 2. 00 2. 00 - 3. 00 3. 00 - 4. 00
Test 2 Test 3 Test 4 Test 5
[image:6.612.115.527.209.527.2]time p er cen ta g e o f p acket l o st ( % ) Story Music Lecture Test 1
Figure 3: Percentage of packet lost for all sets of video
Derived from the five sets of test that have been conducted, network performance can be measured through three elements that are number of users, type of devices and data, and type of media communication used. Based on the case study conducted at FTMM, generally 12.00 p.m. to 2.00 p.m. is a break hour where all labs is fully booked and used by students. Lecturers also used this time to surf and search information either for class preparation or for research. As a result, the capacity of user is very high and automatically will affect the performance of network and quality of video services.
Other reasons that could affect the video presentation are the way network devices are located and types of devices used also can cause high delay and packet. Sometimes the router cannot handle much information at the same time. Consequently, some of the packets are missing because of burst and as a result the quality of streaming video is damaged.
Finally, based on observation and testing results, other factor that contributes to this is the size and type of video. Videos that have high motion and long duration such as story will have high delay and high percentage of packet lost as portrayed in Figure 2 and 3.
Suggestion
Based on test that have been done, percentage of packet lost and delay is very high because of certain factors such as the number of user, media communication used, the content and size of video itself and types of devices used to connect the network. In order to have superior video streaming services, action should be taken to enhance the network performance.
Therefore, FTMM should take some actions to ensure the video streamed in its network is of high quality. Consecutively, to offer better video streaming services, it must correspond with the devices used such as larger size hard disk, router and switches. The streaming server itself must be located at SAVA lab or KUiTTHO City Campus server room in order to make simpler for user to access the video from anywhere.
Besides that, the media communication should be upgraded from copper cable to fiber optic for better data transmission and network performance. With copper, data can only go about 90 meters while with fiber, less devices is used because it only need passive patch panels locally to allow for moves. When it comes to costs, fiber optics is always assumed to be much more expensive than copper cabling either cable, terminations or networking electronics. Everybody says that fiber costs more without realizing that Cat 6 it gets more expensive, almost as much as fiber. Actually there is more to consider in making the decision. Therefore, fiber optic cable can support much higher data rates and at greater distances, than coaxial cable, making it ideal for transmission of serial digital data.
Other than that, sizes and length of videos also contribute to bad service. All videos should follow certain standard regarding the content and size of video. This will ensure that, user gets good quality of video. Besides that, user must use appropriate window scale size. This is significant to guarantee the quality of video data being transmitted at lower broadband is unaffected and of higher quality.
Conclusion
References:
Apostolopoulos, J.G., Tan, Wai-tian and Wee, S.J. (2002). ”Video Streaming:
Concepts, Algorithms and System.” Technical Report. HP Laboratories Palo Alto.
Baharuddin Aris, Mohammad Bilal Ali, Jamaludin Harun dan Zaidatun Tasir (2001). “ Sistem Komputer & Aplikasinya.” Edisi Pertama. Kuala Lumpur: Venton Publishing. 212 – 227.
Barnes, L., Huser, J. and Palmquist, M. (2005) . ”Experimental & Quasi Experimental Research.”: Writing @ csu. Colorodo State University Department of English.
Donny, B. U. (2002). “Streaming: Membuat Fail Besar Serasa Kecil”. www.infokomputer.com accessed on 20 Julai 2006
Jaromil, D. (2000). “Video Streaming.” Technical Report. GNU GPL.
Ratliff, R. (1999). “Network + Certification.” 1st.ed. United State of America: Marcraft International
Corporation. 4 – 5.