1
INFORMING THE STRATEGIC ROLLOUT OF FAST ELECTRIC VEHICLE 2
CHARGING NETWORKS WITH USER CHARGING BEHAVIOUR DATA 3
ANALYSIS 4
5 6 7
Patrick Morrissey, 8
Centre for Transportation Research 9
Dept of Civil, Structural & Environmental Engineering 10
Trinity College Dublin 11
Dublin 2 12
Tel: + 353 1 8962084 13
Fax: + 353 1 6773072 14
Email: morrispj@tcd.ie 15
16
Peter Weldon 17
Centre for Transportation Research 18
Dept of Civil, Structural & Environmental Engineering 19
Trinity College Dublin 20
Dublin 2 21
Tel: + 353 1 8962537 22
Fax: + 353 1 6773072 23
Email: weldonp@tcd.ie 24
25
Margaret O’Mahony (Corresponding author) 26
Centre for Transportation Research 27
Dept of Civil, Structural & Environmental Engineering 28
Trinity College Dublin 29
Dublin 2 30
Tel: + 353 1 8962537 31
Fax: + 353 1 6773072 32
Email: Margaret.omahony@tcd.ie 33
34 35
Published as: Morrissey, P., Weldon, P. and O’Mahony, M. Informing the strategic rollout 36
of fast electric vehicle charging networks with user charging behaviour data analysis. 37
Transportation Research Record, 2016, 2572, 9-19. DOI: 10.3141/2572-02 38
1 2
ABSTRACT 3
4
With the current range limitations of existing electric vehicle (EV) technology, range anxiety 5
has been identified as one of the main barriers to their adoption. For countries or states which 6
are predominantly rural in nature, with few major urban areas, this range limitation has the 7
potential to be a greater barrier than in the case of large cities. This paper presents data recorded 8
in Ireland on the spatial usage patterns of an existing fast charging network over an extended 9
period. These data are used to assess how the infrastructure is being used currently and, in 10
particular, examines the issues relating to urban versus rural usage patterns. Existing 11
infrastructure rollout strategies are examined in the context of the main findings from this 12
analysis and a spatial density analysis is presented to examine how a desired density can 13
influence a rollout strategy. It was found that urban users have very different fast charging 14
requirements compared to rural and commuter groups. Urban users tend to charge their vehicles 15
close to their home as a means of extending their local EV range. EV users from other 16
geographic areas tend to charge their vehicles further from their home. Based on the findings 17
of this work, it would appear that current rollout strategies based primarily on ‘electric’ 18
highway corridors may not be appropriate for all EV users and different infrastructure rollout 19
strategies based on fast charging facility densities and geographic location may be more 20
appropriate. 21
22
Keywords: Fast charging, electric vehicles, charging infrastructure 23
24
25
26
27
28
29
30
31
32
33
34
35
36
37
38
INTRODUCTION 1
2
Fast (DC) charging will be a key factor in successfully achieving a significant and sustainable 3
quantity of electrically powered vehicles in the short- to medium-term. It has been noted that 4
fast charging may not be economically viable for large scale rollout in the short to medium 5
term due to the projected low adoption rates of electric vehicles (EV) (1). However, one of the 6
main barriers to EV adoption is the perceived range limitations of the current generation of 7
EVs and therefore there is a need for a connected network of charging infrastructure to 8
encourage large scale adoption (2). Previous research has indicated the beneficial local effects 9
of DC fast chargers to EV users in order to reduce range anxiety concerns (3). 10
11
The difficulty in predicting the future timings and magnitudes of EV fast charging events is 12
well established, and recently probabilistic statistical approaches have been proposed for better 13
future planning (4, 5). Previous studies have omitted historical data because of lack of 14
availability. Assumed similarities to internal combustion engine vehicle (ICEV) behaviour 15
and/or simulations based on predictive user behaviours have been used instead (4, 6). These 16
charging demands and profiles can then be used to better solve optimisation algorithms in order 17
to recommend (fast) charging facility deployment strategies (7). 18
Less granular approaches have also been proposed; for example, one approach approximated 19
the maximum total power requirement from fast charging facilities based on an arbitrary EV 20
market penetration and then divided this by the nominal power assignment of a fast charging 21
unit (5, 4). This approach does not however take into account the required geographical spread 22
of the infrastructure, but rather presents a good starting point for large scale infrastructural 23
planning. Other research used GIS information and multi-criteria analysis to produce optimal 24
charging facility locations (8). This approach did not distinguish between fast and slow 25
charging infrastructure and again was not informed by historical user data. It has been 26
suggested by others that existing car-parking demand data can be used within urban areas to 27
determine optimal locations for the charging infrastructure (9); however this approach may be 28
less applicable to a fast charging network. Other research considered that near-home and 29
adjacent-region corridors were the optimum locations for any future fast charging network (10). 30
Other studies have been generally focused on determining absolute minimum fast charging 31
infrastructure needs (e.g. in a U.S. State or optimal charging station densities for a country) or 32
optimising the location of charging facility development on networks (11, 12) with a strong 33
focus on highway corridor charging infrastructure evident to date. Another approach illustrates 34
the highway based approach where only primary and secondary roads were considered in the 35
model and demands were assigned to roads based on road lengths and relevant other parameters 36
(13). A route-based flow capture model through a multi-step process was used to determine the 37
required number and location of fast chargers for the state of California, USA (12). The study 38
concluded that an initial 200 fast charging units would suffice for the state of California with 39
the network likely being required to grow further thereafter to avoid congestion. Whilst this 40
approach maximised the achievable travel distances on the road network for EV users, no 41
historical usage data for fast chargers were used in calibrating the model. 42
Models relating to fast charging networks can be further complicated when the potential 43
impacts on the local power supply grid are considered (14). Due to the lack of availability of 44
input data, other work proposed an approach for estimating fast charger requirements based on 45
desirable facility densities (11). This approach is more simplistic and requires less data inputs 46
While novel models and approaches have been proposed for future strategic fast charger 1
deployment, the absence of real data to calibrate and inform these approaches is a potential 2
issue that could affect accuracy in prediction and more importantly the individual requirements 3
of EV users. As the EV landscape matures, historical usage behaviour will become more 4
readily available and this is evidenced by other research where data on charging behaviours for 5
a number of country-wide charging infrastructure networks in the USA were presented (15). 6
However, there is very little research conducted to date using real historical fast charging data 7
as an input to a strategic and optimum fast charger location deployment strategy. 8
Ireland is in a unique position to encourage the use of EVs due to it being an island nation with 9
relatively short travel distances between major cities and relatively large commuter belts 10
surrounding cities. In addition, current and proposed increases in the availability of renewable 11
electricity (predominantly from wind) allow for the further development of green driving and 12
carbon savings when compared to ICEVs. In comparison to other countries, Ireland has a more 13
rural and sparsely spread population with the exception of the greater Dublin area and some 14
smaller cities. The latest census of Ireland data identified that over 1.9 million people live in 15
county Dublin and the four counties immediately adjacent to it (these four counties will be 16
referred to as commuter counties throughout this paper), which amounts to over 40% of the 17
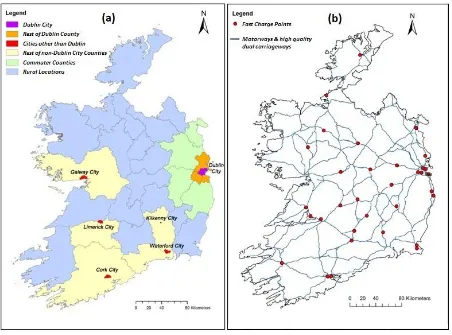
entire country’s population (16) – a map of Ireland showing the location of Dublin city, Dublin 18
County and the surrounding commuter counties is given in Figure 1(a). In comparison there 19
are 2.69 million people living in the remaining 21 counties. This urban/rural divide allows for 20
comparisons to be made in user behaviour. 21
This paper will conduct an analysis of fast charging event data recorded by data loggers situated 22
in fast charging facilities located throughout Ireland. Any trends observed concerning the usage 23
of the fast charging network will then be used to inform strategic rollout of future fast charging 24
facilities, particularly in the context of the urban/rural divide. The main focus of this paper will 25
be on how the infrastructure is being used spatially by existing EV users. Whilst the dichotomy 26
between the usage of fast charging infrastructure as a local every-day range extender and as an 27
occasional inter-city travel enabler may be expected, this paper will develop and expand upon 28
this dichotomy in a geographical context through the usage of real EV user charging data 29
emerging from fast charging infrastructure, which in turn can inform future fast charging 30
infrastructure deployment. As previously discussed, the focus of other approaches for 31
infrastructure rollout was on highways and at hubs that would increase and extend the range 32
available to users. An attempt will be made to validate this approach or alternatively propose a 33
new approach should the analysis indicate it necessary. Finally, policy recommendations will 34
1
FIGURE 1 Maps of Ireland showing (a) the location of major cities and the geographic 2
groups used in the analysis within this study, and (b) the fast charge points monitored 3
during the study with the location of motorway and high quality dual carriageways 4
shown 5
6
METHOD 7
Data Availability 8
A total of 37 charge points were monitored during the analysis period in Ireland. The data 9
available cover the time period between February 2013 and March 2015 and data were also 10
available for monthly and yearly EV sales during this period. The monitored fast chargers have 11
an input/output nominal power of either 43 kW or 50 kW, delivering the charge through direct 12
current (DC) and through three-phase electric power. They are primarily located in service 13
stations along Ireland’s motorways, with additional fast chargers situated in public car parks, 14
and this is in line with the Electricity Supply Board’s (ESB) policy of creating ‘electric 15
corridors’ along key inter-urban routes and between cities and towns (17). A map showing the 16
locations of the fast chargers monitored in the study and the major highways in the country is 17
given in Figure 1(b). 18
In addition to the charge point usage data, locational information was also available for EV 19
user Tag-IDs which allowed a spatial analysis to be carried out. Detailed user information such 20
as age and gender or details relating to the specific purpose for trips was not available. This is 21
due to strict data confidentially agreements between the service provider and individual users. 22
Tag-ID; and the quantity of power consumed (kWh). Road network data were utilised in the 1
study, obtained from the Irish standardised digital referencing framework known as ‘Prime2’ 2
(18), and this enabled analysis of the road network in the Geographical Information System 3
(GIS) software package ArcGIS 10.1 (19) to an accuracy of 1m. Prime2 is an object orientated, 4
seamless topographic database of 3D geometry without any generalisation and has been 5
developed by the OSi (18) using an Open Geospatial Consortium (OGC) simple feature model 6
which follows the ISO 19115-1:2014 (20) standard for metadata. The road network was 7
modelled in Prime2 according to the Geographic Data Files (GDF) ISO data standard (21). 8
9
Spatial Data Analysis 10
The data analysis was focused on the spatial nature of the charge events to determine how the 11
existing infrastructure was being used by current EV users. GPS location data were available 12
for each of the fast chargers and these were assigned to each fast charger using a unique ID 13
code. GPS co-ordinates were assigned to each of the 966 Tag-IDs based on user addresses; it 14
must be noted that in order to preserve data confidentiality and anonymity of the EV users, this 15
process was carried out in a controlled manner with all personal information being removed 16
once the relevant analysis was performed. 17
The travel distance between the GPS co-ordinates of the Tag-ID home address and the fast 18
charger GPS co-ordinates were then calculated via the road network. The OSi roadmap data 19
were imported into ArcMAP 10.1 (19) and a network was created with nodes at intersections 20
using Network Analyst. Network Analyst is a spatial analysis tool contained within ArcMAP 21
10.1 (19) which solves network routing problems. A PYTHON scripting code was used to 22
calculate travel distances between GPS co-ordinates via the road network using the shortest 23
distance approach – the calculated value was given the name ‘distance from home’ 24
Each EV user home address was categorised based on location. Two scenarios were 25
considered: 26
I. A comparison between urban and rural location-based users and the specific 27
characteristics of each group’s charging behaviour. Urban locations were defined as 28
addresses which fell within a town or city with a population exceeding 10,000 persons. 29
Population information for this assignment was acquired from the most recent census 30
of Ireland data in 2011 (16). 31
II. The data were further segregated to involve 6 geographic groups of interest with home 32
locations in: 33
1. Dublin City only 34
2. The rest of Dublin county excluding city locations 35
3. Other cities across Ireland – the cities of Galway, Waterford, Limerick, 36
Kilkenny, Cork 37
4. The rest of the counties containing each of the cities listed in (Group 3) above 38
5. Dublin city commuter counties – counties immediately adjacent to Dublin 39
county; counties Kildare, Meath, Louth and Wicklow 40
6. Rural locations – the remaining locations were deemed to be rural 41
The locations of these geographic groups relative to each other are shown in Figure 1(a) and 42
Model Development & Implementation 1
Each of the fast charge points were considered as a facility providing a service and this 2
approach allowed the use of the ‘serviceable area’ analysis tool. It calculates a polygon area of 3
the transportation network which can be serviced by a facility based on a number of input 4
criteria. The following criteria were used: polygons were calculated assuming travel towards 5
the facilities; U-turns on the network were allowed; elevations at junctions and slip-roads were 6
ignored; and the default search tolerance was allowed for finding network locations (i.e. charge 7
points not located directly on the road network). The impedance of a network, as defined by 8
ArcGIS, is the amount of resistance or cost required to traverse a path in a network, or to move 9
from one element in the network to another, and the resistance can be a measure of travel 10
distance, time, or other metrics, with a higher impedance indicating more resistance to 11
movement and the optimum path in a network represented by the path of lowest impedance 12
(22). Within the current study, the impedance is the distance that can be traversed via the road 13
network to the facility. The impedance was varied from a minimum distance of 10 km up to a 14
maximum of 80 km. The serviceable area is the area around the charge point which includes 15
all possible routes within the selected impedance level. 16
17
RESULTS 18
Overall Charging Trends 19
The average number of charge events per fast charging unit per day ranges between 0.03 and 20
10 uses per day with a mean confidence interval (CI) of 1.07±0.49 uses per fast charge point 21
per day. The high standard deviation of 1.85 indicates that some fast charging units are used 22
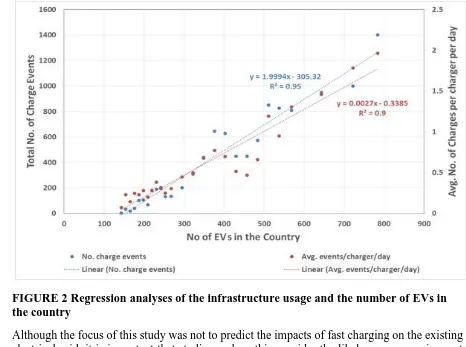
far more frequently than others. Figure 2 shows how the total number of charge events has 23
increased as the number of EVs registered in Ireland has increased (data are for the period 24
between February 2013 and March 2015). Correlation and regression analyses were carried out 25
on 1) the number of charge events and 2) the number of charge events per charger per day with 26
the number of EVs registered in each case. High correlation rates were found (~0.97) and the 27
regression analysis (Figure 2) shows the strong linear relationship between the two charge 28
1
FIGURE 2 Regression analyses of the infrastructure usage and the number of EVs in 2
the country 3
Although the focus of this study was not to predict the impacts of fast charging on the existing 4
electrical grid, it is important that studies such as this consider the likely energy requirement 5
from charging infrastructure over the course of the day. An understanding of the likely energy 6
requirement informs relevant stakeholders of how charging activity may impact the grid, 7
particularly during peak grid demand periods. A distribution of the number of charging events 8
that occurred for each hour of the day with the corresponding total kWh of charging by hour 9
of the day that was observed during this study is given in Figure 3 below. It can be seen that 10
peak energy demand occurs during the period between 17:00 – 19:00 which corresponds with 11
1
FIGURE 3 Distribution of the number of charging events that occurred for each hour of 2
the day (primary y-axis) with the corresponding total kWh of charging by hour of the 3
day also shown (secondary y-axis) 4
5
Spatial Charging Behaviour 6
Overall summary statistics regarding how the fast charging network is being used are provided 7
in Figure 4 below along with a distribution of the distance from home values in 50 km bands. 8
The average distance from home was 66.58 km when a fast charging event took place. It can 9
be seen that the 3rd quartile value is 88.4 km indicating that the majority of fast charging events 10
took place relatively closer to the home location when compared with average electric vehicle 11
ranges (100 – 180 km). It can also be seen that almost 60% of fast charging events took place 12
less than 50 km from the EV home location. 13
1
Note: 1 mile = 1.61 km 2
[image:10.595.66.527.70.429.2]3
FIGURE 4 Summary statistics and distribution of the number of charge events that took 4
place in 50 km distance bands from the home location of the electric vehicle user shown 5
on the x-axis 6
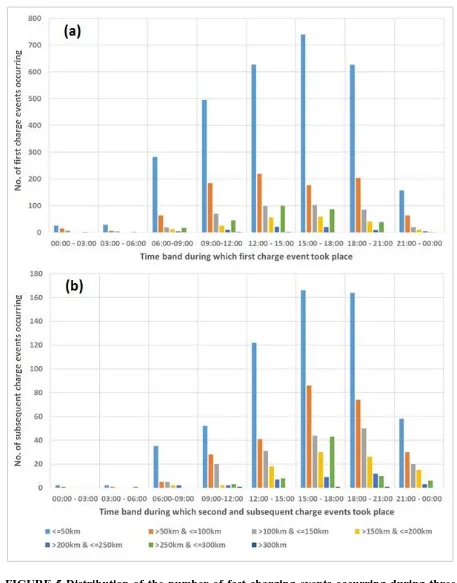
In order to further investigate patterns into user charging behaviours, charging events were 7
additionally separated into first charging event per user per day and later second and subsequent 8
charging events. First and subsequent charging event timings were then counted for 9
occurrences during three hourly time slots over the day and the results were separated into the 10
distance from home bands shown in Figure 4. The results of this analysis are given in Figure 5 11
below, with Figure 5(a) showing first charge events of the day and Figure 5(b) displaying 12
subsequent charging events during the day. As seen in Figure 5, there is evidence that fast 13
charging close to home is used later in the day (possibly to top up an EV battery on the way 14
home from work) with peaks in the number of charging events occurring less than 50 km from 15
home occurring in the 15:00 – 18:00 time slots. However, when examining the timing of the 16
occurrences of second and subsequent charging events it can be seen that the 50 – 100 km and 17
100 – 150 km groups record peaks in the 15:00 – 18:00 and 18:00 – 21:00 time slots indicating 18
1
FIGURE 5 Distribution of the number of fast charging events occurring during three 2
hourly slots over the day segregated by the distance from home that the charge event took 3
place; occurrences have been broken into two groups: (a) first charge time per user per 4
day and (b) second and subsequent charge times per user per day 5
In order to identify further trends in the spatial usage of the fast charging infrastructure, 6
independent two sample t-tests were carried out between urban and rural EV user groups as 7
outlined earlier, considering both charge consumption and distance from home variables. 8
[image:11.595.67.524.66.649.2]p-values of less than 0.05 found in both cases. Urban users were found to have a slightly higher 1
mean charge consumption of 8.73±0.22 kWh compared to rural users (8.42±0.16 kWh (p = 2
0.028)). Rural users were found to undertake a fast charging event further from their home 3
address with a mean of 77.51±2.45 km compared to a significantly lower mean value for urban 4
users of 47.55±2.37 km (p <0.005). The results of the simple comparison (Scenario 1) between 5
urban and rural EV users highlight that rural EV users undertake fast charging events further 6
from their home location indicating longer trips are made which require the fast charging 7
infrastructure to be utilised. In this regard it can be determined that rural EV drivers choose to 8
charge farther from home due to their geographic circumstances when compared to urban EV 9
users. 10
Scatter plots of each of the variable relationships were produced for the charge consumption 11
against distance from home for the scenarios mentioned; the plot for Scenario 2 is presented 12
below in Figure 6. A wide variation of spread is observed between the two parameters with no 13
clear distinctions obvious between city, commuter or urban areas. 14
15
16
Note: 1 mile = 1.61 km 17
[image:12.595.74.511.308.591.2]18
FIGURE 6 Scatter plot of distance from home values against the corresponding charge 19
consumption for each of the six geographic groups (Scenario 2) 20
21
More detailed investigation was conducted on the 6 geographic groups of data (as described 22
earlier in Scenario 2) and summary statistics were produced for the same two variables – see 23
Table 1 below for details. Charge consumption values ranged between 7.16 and 9.6 kWh, with 24
Dublin county (excl. Dublin city) recording the lowest mean consumption value and rural 25
locations the highest. It can also be seen that Dublin city- and county-located EV users 26
comparison, city locations and the associated counties recorded the highest distance from home 1
values of 128.19 and 143.35 km respectively. 2
[image:13.595.47.522.85.701.2]3
TABLE 1 – Spatial usage statistics of the fast charging network for each of the 4
geographic groups segregated by home location during the monitored period (Scenario 5
2) 6
Home Location No. of
observations
Consumption [kWh] Distance from Home [km]
Mea n
Std. Dev.
Std.
Error Mean
Std. Dev.
Std. Error
Dublin City 1,346 8.43 5.43 0.15 39.63 54.94 1.50
Rest of Dublin
county 732 7.16 4.47 0.17 33.73 52.14 1.93
Galway/Waterford /Limerick/Kilkenny /Cork Cities
61 9.47 5.38 0.69 128.19 64.57 8.27
Rest of counties Galway/Waterford /Limerick/Kilkenny /Cork
918 7.42 4.83 0.16 143.35 107.69 3.55
Dublin Commuter
Counties 1,361 8.74 5.08 0.14 53.30 37.49 1.02
Rural Locations 1,711 9.60 5.27 0.13 69.00 57.75 1.40
Note: 1 mile = 1.61 km 7
8
One-way ANOVA tests were carried out comparing between the 6 geographic groups for the 9
same two variables. For charge consumption, an F-value of 35.09 (p < 0.05) was found with 5 10
degrees of freedom (df); however the effect size of 0.028 indicated that much of the variation 11
was within group. In the case of distance from home, an F-value of 382.11 (df =5) (p<0.05) 12
was found, with a large effect size of 0.23, indicating a highly statistically significant between 13
group difference. Aligned to the ANOVA tests, CIs were calculated and additionally a multiple 14
comparison test was carried out whereby the mean difference of each group mean from the 15
other group means was calculated. Plots illustrating each of the resulting mean and mean 16
difference CIs are given in Figure 7 below. 17
Referring to Figure 7(a), it can be seen that when only the group mean CIs are examined (shown 18
in black in Figure 7(a)) 4 group CIs overlap with a further two group CIs overlapping 19
separately. The two group CIs that overlap independently of the others are the ‘Rest of Dublin 20
County’ and ‘Rest of Non-Dublin City Counties’ geographic locations. Both of these groups 21
contain EV users that live in a county that contains a city and it can be seen that their mean 22
charge consumption values are lower than the other four groups. A comparison of the 23
associated mean difference CIs (also contained on Figure 7(a)) identifies that whilst these 24
groups do have lower mean consumption values, the difference from the other 4 groups is weak 25
statistically as the mean difference CIs overlap with other groups and this confirms the weak 26
1
Note: 1 mile = 1.61 km 2
[image:14.595.64.494.67.720.2]3
FIGURE 7 Confidence intervals for (a) mean charge consumption values and (b) mean 4
distance from home values of each of the geographical groups with confidence intervals 5
The CIs for mean distance from home values for the 6 geographic groups given in Figure 7(b) 1
reveal interesting results. When only the group mean CIs are examined (shown in black in 2
Figure 7(b)), 4 different groups emerge where CIs do not overlap. Two sets of two groups 3
have overlapping CIs, the first of which contains both ‘Dublin City’ and ‘Dublin County’ 4
addresses with these two groups having the lowest mean values. The two groups that recorded 5
the highest CIs were also grouped together and these two groups were ‘Non-Dublin cities’ and 6
‘Rest of Non-Dublin City Counties’. The remaining two group CIs did not overlap with any 7
other group and this illustrates the high degree of difference between them and the other groups. 8
Comparing the associated mean difference CIs (also contained in Figure 7(b)) identifies clear 9
trends when comparing between groups. The mean difference CIs of the Non-Dublin cities and 10
their associated counties (Rest of non-Dublin City counties) overlap consistently when their 11
group mean is subtracted from each of the other groups – shown in purple and red in Figure 12
7(b) above. Similarly ‘Rural’ and ‘Commuter County’ group mean difference CIs are paired 13
together, as are ‘Dublin City’ and ‘Rest of Dublin County’ mean difference CIs. 14
Referring to Figure 1(a) and Figure 1(b), it can be noted that the circumstances of Galway and 15
Waterford cities may not reflect the circumstances of Cork, Limerick, and Kilkenny cities with 16
respect to the availability of fast charging infrastructure, in that the nearest fast chargers are far 17
from Galway and Waterford cities whilst there are chargers within Cork, Limerick, and 18
Kilkenny cities. In order to explore potential differences between these locations, additional 19
analysis was conducted which expanded the number of geographic groups from six to eight by 20
dividing the “Non-Dublin Cities” and “Rest of Non-Dublin Counties” groups between the 21
aforementioned cities. Results of the statistical analyses for the “charge consumption” and 22
“distance from home” metrics for the eight geographic groups were almost identical to the 23
results generated for the six geographic groups, which further highlights the previously 24
discovered geographic differences in EV user behaviours. 25
26
Fast Charging Infrastructure Density 27
In order to identify the effects of varying the density of fast charging units across the country, 28
the network analyst tool within ArcGIS 10.1 was used to calculate serviceable areas for each 29
of the existing fast charger locations. An initial impedance value of 10km was used initially 30
and this impedance was increased incrementally by 10 km to a maximum of 80 km - sample 31
outputs from the analysis are given in Figure 8. Referring to Figure 8(b), at an impedance of 32
40 km the resulting serviceable areas from the existing fast charging infrastructure provides 33
coverage to almost 80% of the country’s road network. The serviceable areas at an impedance 34
of 60 km are shown in Figure 8(c) below, giving 90% of the country’s road network access to 35
the fast charging network. 36
In order to determine a desirable density for the fast charging network, a key criterion is the 37
acceptable travel distance (or impedance in this analysis) that users must traverse to reach a 38
facility. To determine an appropriate density for chargers, Sathaye & Kelley (11) used an 39
approach based on population densities and road highway corridors using varying maximum 40
allowable distances that an electric vehicle may travel to reach a charging location as a basis 41
for charging facility planning. Using their lowest allowable travel distance between charging 42
facilities of 24 km as input to this work, it was found that 35% of the country’s road network 43
can access a fast charging facility at this impedance value (Figure 8 (a)). 44
1
Note: 1 mile = 1.61 km 2
[image:16.595.90.507.70.678.2]3
FIGURE 8 Serviceable areas as calculated in network analyst for impedance values of 4
DISCUSSION 1
As discussed earlier, the most common approach to date for the rollout of fast charging 2
infrastructure has been to concentrate on highway corridors which in theory should allow 3
longer trips to be undertaken and increases EV users’ potential journey ranges. However the 4
results shown in this study appear to show a more varied usage requirement from EV users. It 5
was found that the average distance EV users were from home when using a fast charger was 6
66.6±1.8 km and this value is considerably lower than the typical range of a standard EV. Fifty 7
eight per cent of all fast charging events took place less than 50 km from the EV users’ home 8
location and this could suggest that EV users may be using fast chargers to extend their local 9
range more so than for undertaking longer journeys in excess of their vehicle’s capable range. 10
When examining the spatial usage patterns depending on geographical location, other trends 11
were observed. Rural users recorded a mean distance from home value of 77.51±2.45 km 12
compared to a significantly lower mean value of 47.55±2.37 km recorded by urban users. 13
Further segregation of the data into geographic groups again revealed interesting results. 14
Dublin city and county have the highest population densities in the country of Ireland with 15
almost 30% of the population living there. Those users recorded the lowest mean distance from 16
home values of 39.63±2.94 and 33.7±3.78 km, respectively. In comparison, other city locations 17
around the country and the associated counties recorded the highest distance from home values 18
of 128.19±16.2 and 143.35±6.96 km, respectively. The wide range observed suggests that 19
while the highway corridor approach to siting infrastructure might be appropriate for more rural 20
and commuter EV users it would seem not to serve urban users to the same extent. It can 21
additionally be noted that the similarity of the consumption values relative to the distance from 22
home values for the “Non-Dublin Cities” group and the “Rest of Non-Dublin Counties” group 23
implies that second or subsequent charges are occurring for vehicles within these groups, 24
further suggesting that the highway corridor deployment approach may be more appropriate 25
for more rural EV users. 26
The usage frequency of the fast charging infrastructure is currently low (an average of 1.07 27
charge events per charge point per day); however, as the market share increases it would be 28
possible to estimate the usage frequencies of the network given the relationships found during 29
this study. The regression analysis presented within this study provided information on the 30
strong relationships between the number of EVs within the country and both the average 31
number of charge events per charge point per day and the total number of charge events, 32
facilitating predictions for these charging event frequency variables. The results from the 33
network analyst analysis indicated that the current fast charging infrastructure in Ireland is 34
adequate to service the majority of the country’s road network at an impedance value of 60 km. 35
Should no new facilities be added in the short to medium term, the usage frequencies of the 36
infrastructure will become more important than charger density. Predicting the likelihood of an 37
EV user being able to access an available fast charging unit in the future when the total number 38
of EVs has increased significantly will therefore become more pertinent. On the basis of the 39
regression analysis presented earlier, projections of 100,000 fast charging events for a total EV 40
fleet of 50,000 vehicles can be made. The Irish government has set a target of 50,000 EVs in 41
Ireland by the year 2020 (23). On the basis of an average charging event for a 24 kWh capacity 42
battery taking 25 – 30 minutes, usage frequencies of 10+ per day would likely be 43
accommodated without queuing and in this regard the fast charging network would appear 44
adequate at current levels. However from both a density and a maximum allowable travel 45
CONCLUSIONS 1
This research analysed the entire fast charging network in Ireland based on live usage statistics 2
over an extended period. A spatial analysis was carried out on the fast charging events in order 3
to determine the way in which EV users access the infrastructure. It was found that the fast 4
charging infrastructure was being used in a manner that may not have been intended or 5
anticipated by the infrastructure manufacturers or those responsible for its installation, with the 6
majority of fast charging events taking place less than 50 km from the EV users’ home location. 7
Additional analysis was carried out comparing different geographic groups of EV users and 8
differences in usage patterns of the fast charging facilities were identified. Urban users were 9
found to use the fast charging infrastructure in a very different manner to users based in rural 10
city and county locations. The fast charging facilities in urban areas were used in a more local 11
manner close to the users’ home and this behaviour equated to local range extension or 12
convenience charging. In comparison, rural city- and county-based EV users tend to charge 13
further away from their home locations and use the fast charging facilities in a manner in line 14
with the literature – as a means of extending the range or journey length undertaken with their 15
vehicles. This urban/rural divide was not expected and has not been reported previously in the 16
literature – it is hoped that this study will contribute to filling this gap internationally for future 17
infrastructure development particularly in countries and states with similar demographics to 18
Ireland. 19
The most common strategy for the rollout of EV charging infrastructure reported in the 20
literature (and in particular fast charging facilities) is the ‘highway corridor’ approach. 21
However, based on the observations in this study, it would appear that a strategy for the rollout 22
of fast charging infrastructure should be to locate more facilities close to large urban or 23
population centres in addition to on interurban highway corridors. One final point to note is 24
that the first wave of EV owners or ‘early adopters’ may not use the infrastructure in the same 25
way that subsequent users would and therefore further research on charging behaviour will be 26
required as market penetration increases. 27
ACKNOWLEDGEMENTS 28
The authors wish to acknowledge the Electricity Supply Board of Ireland (ESB) and, in 29
particular, their eCars group, who provided the charging data used in this analysis. The authors 30
would also like to acknowledge Ordinance Survey Ireland (OSi) and the members of their 31
mapping team for the provision of their Prime2 dataset. 32
REFERENCES 1
1. Schroeder, A. and T. Traber, The Economics of Fast Charging Infrastructure for 2
Electric Vehicles. Energy Policy, Vol. 43, 2012. pp. 136-144. 3
2. Usmani, O. and H. Rösler. Deliverable 9.7 - Policy recommendations and stakeholder 4
actions towards effective integration of EVs in the EU. Green eMotion project 5
published document: http://www.greenemotion-6
project.eu/upload/pdf/deliverables/D9_7-Policy-recommendations-and-stakeholder-7
actions_submitted_c.pdf . 2015. Accessed July 31, 2015 8
3. Anegawa, T., 2010. Needs of Public Charging Infrastructure and Strategy of 9
Deployment. Tokyo, Tokyo Electric Power Company, Inc. (TEPCO). 10
4. Celli, G., G.G. Soma, F. Pilo, F., Lacu, S. Mocci, and N. Natale, N. Aggregated 11
electric vehicles load profiles with fast charging stations. Proceedings of the Power 12
Systems Computation Conference (PSCC), Wroclaw, Poland 18 - 22 Aug 2014 13
5. NERL, California Statewide Plug-in Electric Vehicle Infrastructure Assessment . 14
Alternative and Renewable Fuel and Vehicle Technology Program – Final Project 15
Report. Published Document. Available from: California Energy Commission, 16
Sacramento, CA 95814-5512, 2014. USA. 17
6. Axsen, J. and K. S. Kurani. Anticipating Plug-in Hybrid Vehicle Energy Impacts in 18
California: Constructing Consumer-Informed Recharge Profiles. Transportation 19
Research Part D: Transport and Environment. Vol 15, No. 4: 2010. pp. 212-219. 20
7. Sadeghi-Barzani, P., A. Rajabi-Ghahnavieh, and H. Kazemi-Karegar, Optimal fast 21
charging station placing and sizing. Applied Energy, Vol. 125, 2014. pp. 289–299 22
8. Dimitrios, E., C. Antoniou, Y. Tyrinopoylos, Y. and E. Mitsakis, Spatial Exploration of 23
Effective Electric Vehicle Infrastructure Location. Procedia - Social and Behavioral 24
Sciences, Vol. 48, 2012. pp.765-774. 25
9. Chen, T. D., K. M. Kockelman, and M. Khan, The electric vehicle charging station 26
location problem: A parking-based assignment method for Seattle. Transportation 27
Research Board of the National Academies, Washington D.C. 2013. 28
10. Nicholas, M.A., G. Tal, J. Davies and J. Woodjack, DC Fast as the Only Public 29
Charging Option? Scenario Testing from GPS Tracked Vehicles. Transportation 30
Research Board of the National Academies, Washington D.C. 2012. 31
11. Sathaye, N. and S. Kelley. An approach for the optimal planning of electric vehicle 32
infrastructure for highway corridors. Transportation Research Part E: Logistics and 33
Transportation Review, Vol. 59, Issue C, 2013. pp 15-33 34
12. Nicholas, M.A., G. Tal, G, and J. Woodjack, California Statewide Charging 35
Assessment Model for Plug-in Electric Vehicles: Learning from Statewide Travel 36
Surveys. Working Paper (Jan, 29th 2013), Institute of Transportation Studies, 37
University of California, Davis. 38
13. Jia L., Z. Hu, W. Liang, W. Tang, and Y. Song, A Novel Approach for Urban Electric 39
Vehicle Charging Facility Planning Considering Combination of Slow and Fast 40
Charging. Proceedings of the International Conference on Power System Technology 41
(POWERCON, 2014), Chengdu, China, 20-22 Oct. 2014. 42
14. Bayram, I.S., G. Michailidis, M. Devetsikiotis, and F. Granelli. Electric Power 43
Allocation in a Network of Fast Charging Stations. IEEE Journal on Selected Areas in 44
Communications, Vol. 31, No. 7, 2013. pp.1235-1246. 45
15. Smart, J. and J. Francfort Charging Infrastructure Use Profiles and Installation Costs 46
for 17,000 Units”. Transportation Research Board of the National Academies 47
16. CSO. This is Ireland, Highlights from Census 2011 Part 1. Published Report. Central 1
Statistics Office, Skehard Road, Cork T12 X00E, Ireland. 2012. 2
17. ESB, (2013). Europe's First Cross-Border EV Fast Charger Network Launched. 3
Available at: http://www.esb.ie/electric-cars/electric-car-news-and-events/electric-car-4
press-releases/fast-charge-network.jsp [Accessed 30/07/2015]. 5
18. OSi. Prime2 - Data Concepts & Data Model Overview. Published Document. 6
Ordinance Survey Ireland, Phoenix Park, Dublin 8. 2014. 7
19. ESRI. ArcGIS Desktop: Release 10.1. Environmental Systems Research Institute, 8
Redlands, CA, USA, 2014. 9
20. ISO. ISO 19115-1:2014 Geographic information -- Metadata -- Part 1: 10
Fundamentals”. Published Document. International Organization for Standardization, 11
1214 Vernier, Geneva, Switzerland. 2014. 12
21. ISO. ISO 14825:2011 Intelligent transport systems Geographic Data Files (GDF) -13
- GDF5.0. Published Document. International Organization for Standardization, 1214 14
Vernier, Geneva, Switzerland. 2011. 15
22. ESRI, 2015. ESRI Support – GIS Dictionary – Impedance. [Online] Available at: 16
http://support.esri.com/en/knowledgebase/GISDictionary/term/impedance [Accessed 04 17
November 2015]. 18
23. SEAI, SEAI Energy in Transport: 2014 Report. Published Report; Sustainable Energy 19
Authority of Ireland, Dublin, Ireland. 2014. 20
21
22