Evaluating Health Impact of Air Pollution
Pooja Sharma1, Pooja Jain2,*, Pragati3, Sanjeev Kumar4
1
Department of Economics, Daulat Ram College, University of Delhi, India 2
Department of Nutrition and Health Education, Daulat Ram College, University of Delhi, India 3
Indian Institute of Management Ahmedabad (IIMA), India 4
Department of Commerce, Dr. Bhim Rao Ambedkar College, University of Delhi, India
Copyright©2019 by authors, all rights reserved. Authors agree that this article remains permanently open access under the terms of the Creative Commons Attribution License 4.0 International License
Abstract
The paper attempts to evaluate health benefits individuals can derive by reducing the expenditure on health related diseases by deploying the methodology of health production function. The study is based on survey of households located around half kilometer of monitoring station for ambient air pollution of Central Pollution Control Board (CPCB) situated at Siri Fort and R.K. Puram in the South Delhi region. The survey was conducted in the winter season of 2015.The results reveal that individuals can reduce the expenditure on health by controlling indoor pollution, awareness index, habit index, averting activities, nutrition index, and outdoor pollution. The paper identifies the role played by habits and nutrition status of individuals in affecting the number of sick days of individuals thus reducing the expenditure on mitigating activities. The study holds socio-economic and political implications as it highlights the role of better living conditions in the society and the significance of reducing indoor pollution and policies promoting clean energy fuel.Keywords
Health Production Function, Monitoring Stations, Indoor Pollution, Awareness Index, Habit Index, Averting Activities, Nutrition Index, Outdoor Pollution1
. Introduction
In this present era a serious concern and challenge has emerged related to air pollution, its consequent acute and chronic impact on human health has been witnessed across the world. Various pollutants that degrade the air quality are carbon monoxide (CO), sulphur dioxide (SO2),
nitrogen oxides (NOx), volatile organic compounds (VOCs), ozone (O3), heavy metals, and particulate matter
(PM2.5 and PM10). The impact of existence of such pollutants ranges from minor upper respiratory irritation to chronic respiratory and heart disease, lung cancer, acute respiratory infections in children and chronic bronchitis in
adults, aggravating pre-existing heart and lung disease, or asthmatic attacks.
The State of Global Air report 2018 by IHME paints a grim picture of India with Global Burden of Disease (GBD) analysis 2016 estimating 1.1 million out of 4.4 million, that is, a quarter of global deaths from air pollution occurring in India – the highest amongst the South Asian countries and 10 per cent of total deaths in India [1]. The report also documented that 70 per cent of Indian population resides in areas with PM 2.5 concentration more than 35 ug/m3, much above the WHO air quality guideline of 10 ug/m3 and India experienced one of the steepest increase in PM 2.5 concentrations since 2010. The report projected the concentration to increase to 48 ug/m3 by 2050, increasing the exposure by 40 per cent, if no further action is taken. WHO’s World Global Air Quality Database ranking of PM 2.5 concentration in cities shows 11 among the 12 most polluted cities globally from India, with the National Capital - Delhi being the 7th most polluted one. The urban air database by WHO in 2010 showed that Delhi has exceeded PM 10 level by 10 times at 198 ug/m3, vehicular emissions being the major contributor followed by coal burning [2]. South Delhi is one of the prominent locations in Delhi covering an area of 247 square kilometers. The southern region of National Capital Territory comprises of a population of 27.32 lakhs (Census of Delhi, 2011) [3] suffering from very unhealthy daily average levels of PM 10 and PM 2.5 as per the Air Quality Index (AQI) reported by Delhi Pollution Control Board (DPCC) [4].
lung cancer being highly related to pollution. A substantial premature deaths can be attributed annually owing to use of biomass fuel, placing indoor pollution at a major risk factor in India.
N. Bruce et al. [7] study the interrelationship between poverty and dependence on polluting fuels and recognise indoor air pollution as a major global public health threat. The paper claimed that indoor air pollution may be responsible for nearly 2 million excess deaths in developing countries [8]. The paper recognises the interrelationship between poverty and dependence on polluting fuels. Ghose and Majee [9] applied four different methods to estimate burden of disease due to indoor pollution from household solid fuel use in developing countries. The study observed children under five years of age owing to acute respiratory infections in children are the largest single category of deaths from indoor air pollution. Zhang and Smith [10] utilised the emission data to compute dust generation due to different mining activities to evaluate local atmospheric impact and concluded that there is a need for larger application of dust control chemicals.
Several health effects due to pollution and arsenic poisoning and fluorosis resulting from use of poisonous coal in the certain regions of China [11]. The study also stated that pollution levels in households using solid fuel exceeded Chinese indoor air quality standards. Urban air pollution levels are associated with increased mortality and morbidity and hundreds of cardio respiratory cases and diseases could be prevented by reduction of air pollution in Australia and New Zealand [12].
Vehicle exhaust, industries, waste burning and construction activities accounted for particulate matter between 2008 and 2011. The health impact analysis estimates premature deaths and asthma attacks. The paper recommends technological, institutional and behavioural intervention [13].Haines et al. [14] summarizes the evidence on health effects of particulate matter and addresses the implications for policy makers so that stringent strategies can be implemented to reduce air pollution and its health effects. The experience of 2003 heat wave in Europe clearly shows that the high income countries may also be adversely affected and require public health strategies. Further by reducing the use of fossil fuels and increasing the use of renewable should improve health by reducing exposure to air pollution [15].
The pilot study in four Indian villages related to exposure of women cooking was carried out to conclude that rural exposures are relatively high [16]. Kunzli et al. [17] concluded that air pollution was increasingly serious in recent years and that the air pollution contributed to various health impacts. Afroz et al. [18] estimated the public health impact of air pollution and concluded that traffic related air pollution is the key concern for public health action in Europe.
A very less attention being paid to environmental concerns in Malaysia as a result environmental threats were
posed leading to pollution prevention programs in Malaysia [19]. The paper concluded air pollution was mainly due to land transportation and reviewed the ambient air quality monitoring. Cohen et al. [20] estimated the impact of air pollution on mortality and not morbidity and concluded that if air pollution multiplies in Asia both the incidence will be affected to the same extent. Air pollution has both acute respiratory infections and chronic bronchitis in adults leading to heart and lung diseases [21]. The study discusses the effect of air pollutants on human health and their mechanism of action.
Bemard et al. [22] asserted that health effects of exposures to carbon monoxide, sulphur dioxide and nitrogen dioxide leading to reduced work capacity. Therefore programs related to responsiveness of air quality protection should be incorporated. Nazaroff and Nero [23] reviews relationship between indoor air pollution and health and discusses the sick building syndrome and highlight the health risks from indoor air pollution. Jones [24] found that the health effects have been observed at low levels of exposure and reviews adverse effects on health of selected air pollutants. Ambient air pollutants have greater adverse health effects in China [25]. The evidence suggests that climate change poses significant health risks to population in China. Kan and Tong [26] discusses the greater understanding of indoor air highlighting the health effects and risk of exposure to radon decay products.
This paper attempts to examine the impact on health status of individuals due to air pollution both outdoor and indoor. The paper seeks to highlight and examine the role of nutrition and habits in determining the health status of individuals residing in the South Delhi region. The main objective of the study is to estimate the savings individuals can apportion by reducing the expenditure on mitigating activities that are associated with diseases caused by air pollution. This implies that individuals are able to reduce number of sick days and in turn reduce the expenditure on mitigating activities. To achieve its objective the study deploys Health Production function. The data is collected through the survey of selected sample of individuals located in the area of half a kilometre circumference of monitoring stations situated in South Delhi region.
The paper is organised in three section leaving the Introduction as section 1. The methodology of Health Production Function adopted by the study is discussed in section 2 under Material and Methods. This section presents the formulation of the model for the study describing the basic three regression models carried out by the study. The results of online data for ambient air quality and the regression results have been displayed in the third section under Results. The results are later discussed in the section 4 under the heading of Discussion and the final conclusion and policy recommendations are mentioned in the fifth section of the paper under the heading of Conclusions.
2. Materials and Methods
The study deploys Health Production Function Model to evaluate the impact of air quality on health of individuals as developed by Grossman (1972) and later used by Gerking and Stanley (1986) and Harrington and Portney (1987). Pollution affects individual utility indirectly through the health production function and directly by affecting outdoor recreation and many other services. Consider a general model comprising of variables Q, Mitact, Avertact, HK and SK representing environmental quality, mitigating activity, aversion activity, stock of health capital and stock of social capital respectively, as inputs to the health production function given below.
Sickdays = Sickdays (Q, Mitact, Avertact, HK, SK) The utility function of the household is expressed as below.
U = U (X, Sickdays, Q, l, M)
Where X represents a private good other than Mitact and Avertact consumed by the household, l is the leisure out of total time T in a day and M is total income of the household. The private good X is given as a numeraire.
The budget constraint of the household is
M = M* + w (T - l - Sickdays) = X + PmiMitact +
PavAvertact
Given the environmental quality Q, and the aversion activity level Avertact, human resource capital SK, income M, wage rate w and prices Pmi and Pav, the
individual maximizes utility with respect to X, Mitact, Avertact and l, given the budget constraint. That is, the Lagrange equation is given as
L = U (X, Sickdays, Q, l, M) + λ [M* + w (T - l - Sickdays) – (X + PmiMitact + PavAvertact)]
The solution for this equation yields the demand function for mitigating activities and averting activities of the household.
The first order conditions are given as:
UX = λ (i)
Ul = λw (ii)
USickdaysSickdaysMitact = λPmi + λwSickdaysMitact (iii)
USickdaysSickdaysAvertact = λPav + λwSickdaysAvertact (iv)
Solving above equations, it is derived
λPmi/SickdaysMitact= λPav/SickdaysAvertact = USickdays – λw (v)
The indirect utility function U’ is given as U’ = U’ (Q, Pmi, Pav, SK, M, HK)
Differentiating indirect utility function and equating it to 0, we get,
-VQ/VM = -VQ/λ= dM/dQ (vi)
Also,
VQ = UQ + USickdaysSickdaysQ - λwSickdaysQ= UQ +
SickdaysQ(USickdays-λw) (vii)
Using (vi) and (vii),
dM/dQ = -VQ/λ = - (UQ/λ+ Pmi.SickdaysQ/SickdaysMitact) = -
(UQ/λ + PavSickdaysQ/SickdaysAvertact) (viii)
By totally differentiating the household production function and equating it to 0,
SickdaysMitact d(Mitact) + SickdaysAvertact d(Avertact) +
SickdaysQ.dQ = 0 (ix)
For Avertact at optimum,
-SickdaysQ/SickdaysMitact = dM/dQ
For Mitact at optimum,
SickdaysQ/SickdaysAvertact = d(Avertact)/dQ
dM/dQ, the marginal willingness of an individual to pay for the reduction in environmental pollution or an increase in air quality, is the sum of direct utility gains and the indirect benefits from reduced health status through reduction in expenditure on either mitigating activities or averting activities.
2.1. Formulation of Study Model
The household health production model as described in section 2 involves maximization of Utility of individuals subject to budget constraints. The maximisation exercise in turn provides three first order conditions that can be expressed as the following three equations that serve as three distinct models.
Sickdays = sickdays (Nutrition Index, Indoor pollution, Awareness index, Healthstock index, Income , Mitigating expenditure, Averting activity , Outdoor pollution )
Mitigating expenditure = mitigating expenditure (Nutrition Index, Indoor pollution, Awareness index, Healthstock index, Income, Sick days, Averting activity, Outdoor pollution )
pollution )
The above mentioned three models involve various dependent (endogenous) and independent (exogenous) variables. The data for these variables is collected from the sample survey of individuals based on a comprehensive questionnaire. The households are located around the circumference of half a kilometre around the monitoring station that records the online ambient air quality. The data hence collected during the survey can be consolidated under the variables described as endogenous and exogenous variables.
The data is collected through a detailed questionnaire consisting of questions related to the socio-economic conditions of individuals, their habits and nutrition status, number of visits to doctors etc. The interviews were conducted from 89 individuals from half a kilometre area around the monitoring station. The survey was conducted during the winter season of the year 2015. Both endogenous and exogenous variables are described in section 2.2
2.2. Endogenous Variables: Dependent Variables
These are the variables that serve as dependent variables in the three models that are used for regression analysis. 1) Sickdays: This variable indicates the Health Status
measured by the total number of sick days.
2) Mitigating Expenditure : Expenditure on Mitigating Activity computed by medical expenses comprising of travel cost to doctor’s clinic, waiting time, doctor’s fees charged, cost of medicines and loss of wages. The patient and the person who accompanies during the time of treatment have to incur losses due to absence at work.
3) Averting Activity: Expenditure on Averting activities include the expenditure made on daily extra km travelled, number of days stayed indoor, use of mask, air purifier, mode of transportation.
2.3. Exogenous Variables: Independent variables
These are the independent variables that serve as independent variables in all the three regression models.
1) Outdoor Pollution: The ambient air pollution is captured by air quality data provided by CPCB. This is data on SO₂, NO₂, PM2.5, PM10, CO, Ozone. An average value of all indicators is considered for outdoor pollution.
2) Healthstock Index: This variable is the index of chronic diseases. This index is also referred as health capital of an individual. The list of chronic diseases that are affected by air pollution are Asthma, BP, Heart Disease, Cancer, Eye disease, TB, Diabetes, and others in the order specified. (This ranking has been confirmed by Dr. Peeyush Jain MD, DM. Director, Cardiology, Fortis Escorts Heart Institute, New Delhi)
3) Nutrition habits: An index for this variable is computed by using the nutrition habits of households such as consumption of green leafy vegetables, olive and refined oil, fruits, nuts and processed food (in order).The supplementary intake such as frequency of consumption of vitamin A , E and C . The ranking is assigned depending on the frequency of intake. Higher is the frequency of intake, higher is the rank assigned. Therefore, higher the value of nutrition index, indicating lower ranks, the poorer is the nutritional status of the individual. Various
attributes used to capture this index are described in Table 1.
Table 1. Description of Attributes and their corresponding indicators for Nutrition Index construction
Sno. Attributes of
Nutrition habits Indicators of the attributes
1 Oil Nutrition attribute
Olive oil, refined oil, banaspati oil, desi oil and others
2 Supplementary
attribute Vitamin A , Vitamin E and Vitamin C
3 Food intake attribute
Frequency of consumption of Green leafy vegetables, consumption of salad, nuts , walnuts etc. processed food intake such as pizza, burger etc.
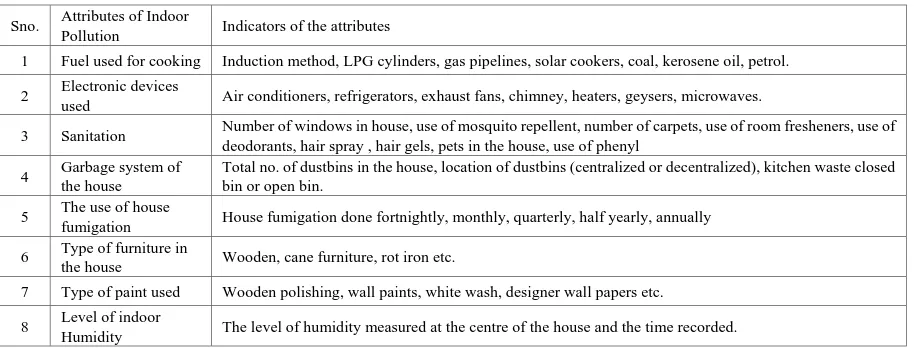
Table 2. Description of Attributes and their corresponding indicators for Indoor Pollution Index construction
Sno. Attributes of Indoor
Pollution Indicators of the attributes
1 Fuel used for cooking Induction method, LPG cylinders, gas pipelines, solar cookers, coal, kerosene oil, petrol.
2 Electronic devices
used Air conditioners, refrigerators, exhaust fans, chimney, heaters, geysers, microwaves.
3 Sanitation Number of windows in house, use of mosquito repellent, number of carpets, use of room fresheners, use of deodorants, hair spray , hair gels, pets in the house, use of phenyl
4 Garbage system of the house
Total no. of dustbins in the house, location of dustbins (centralized or decentralized), kitchen waste closed bin or open bin.
5 The use of house
fumigation House fumigation done fortnightly, monthly, quarterly, half yearly, annually
6 Type of furniture in
the house Wooden, cane furniture, rot iron etc.
7 Type of paint used Wooden polishing, wall paints, white wash, designer wall papers etc.
8 Level of indoor
Humidity The level of humidity measured at the centre of the house and the time recorded.
5) Annual Income: It is the annual income reported by each household.
6) Awareness Index: It is the index computed by the ranking that an individual provides for the diseases that are caused by air pollution. It indicates the level of awareness among the individuals regarding the health issues arising due to pollution.
Formulating the three basic regression model the following section will elaborate and assimilate the results that are collected after the survey and the data thus collected is used to run three regression models.
The following three models are formed to run the regression models:
Model I: Sickdays = sickdays (Nutrition Index, Indoor pollution, Awareness index, Healthstock index, Income , Mitigating expenditure, Averting activity , Outdoor pollution )
Model II: Mitigating expenditure = mitigating expenditure (Nutrition Index, Indoor pollution, Awareness index, Healthstock index, Income, Sick days, Averting
activity, Outdoor pollution )
Model III: Averting activities = averting activities (Nutrition Index, Indoor pollution, Awareness index, Healthstock index, Income , Sick days, Mitigating expenditure, Outdoor pollution)
3. Results
[image:5.595.71.533.95.269.2]Source: mapmyindia.com
[image:6.595.184.408.384.627.2]Figure 1. Map of South Delhi
Figure 2. The areas covered at Monitoring Stations located in South Delhi
The online data on ambient air quality as captured by the two monitoring stations Siri Fort and R. K. Puram. Around one and a half kilometer around these two monitoring stations, there are localities that selected for the survey. The localities that belong to this region of one and a half kilometer are Sadik Nagar, Rajiv Gandhi Camp and Sirifort Road around the Sirifort monitoring station. While the
region around R K Puram area approximately one and a half kilometer consists of sector 1 and sector 4 as shown in Figure 2. Various indicators of air quality used for the study are NO2, SO2, CO, PM2.5 and PM10 have been
Figure 3. Average Pollution levels across South Delhi
The monthly averages of SO2 and NO2 have remained quite stable throughout the year but an acute rise is seen in SO2
level in the spring season. Both PM10 and PM2.5 have shown a declining trend with PM2.5 remaining below PM10 levels. Both of them attained their higher levels in the winter season, displaying significant fluctuations in the months of March to July, in the autumn season the two crucial indicators of high pollution levels have remained almost stable. The data on CO across south Delhi revealed that it reached its highest level in summer season decreased suddenly and became constant in the autumn. All the parameters indicate low pollution in autumn season.
Figure 4. Average NO2 Levels across South Delhi
It has been observed that NO2 has shown significant fluctuations across south Delhi. It reached its peak during spring
and autumn season, and dropped again during the autumn season.
[image:7.595.140.455.357.523.2] [image:7.595.140.456.579.743.2]SO2 has remained below the threshold level throughout the year, but in the spring season, it increased suddenly above
the threshold level and again fell and thereafter remained constant during autumn season.
Figure 6. Average CO Levels across South Delhi
CO level has shown significant fluctuations except during late summer and in the autumn season where it has remained steady and below the threshold level.
Figure 7. Average PM2.5 Levels across South Delhi
PM2.5 across South Delhi has shown a decreasing trend, indicating that the pollution level eventually decline in this area even though it remained above the threshold level.
Figure 8. Average Ozone Levels across South Delhi
[image:8.595.140.457.113.293.2] [image:8.595.142.457.343.513.2] [image:8.595.142.456.561.713.2]Figure 9. Average PM10 Levels across South Delhi
One of the most important indicators of air pollution, PM10 has shown the declining trend across South Delhi, though it has remained above the threshold level throughout the period of consideration. It has attained the maximum value in the winter season and the minimum in autumn season.
The three models formulated based on health production function are run a regression model in Cobb Douglas production functional form by taking log on both the sides so the partial coefficients obtained by regressing are nothing but their elasticities. The results obtained from the regression are discussed in the following tables.
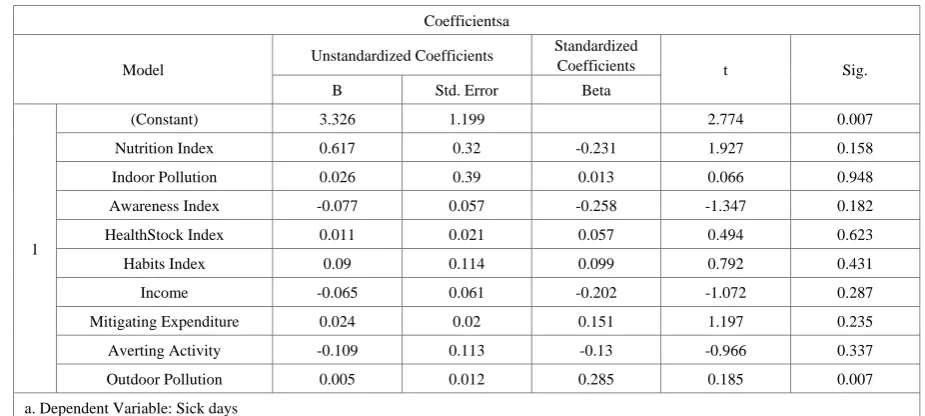
Model I: Taking Sick Days as Dependent Variable (Double log Model )
Sick days = sick days (Nutrition Index, Indoor pollution, Awareness index, Healthstock index, Income , Mitigating expenditure, Averting activity , Outdoor pollution )
Table 3. Results of Model 1 with number of Sick days as dependent variable
Coefficientsa
Model Unstandardized Coefficients
Standardized
Coefficients t Sig.
B Std. Error Beta
1
(Constant) 3.326 1.199 2.774 0.007
Nutrition Index 0.617 0.32 -0.231 1.927 0.158
Indoor Pollution 0.026 0.39 0.013 0.066 0.948
Awareness Index -0.077 0.057 -0.258 -1.347 0.182
HealthStock Index 0.011 0.021 0.057 0.494 0.623
Habits Index 0.09 0.114 0.099 0.792 0.431
Income -0.065 0.061 -0.202 -1.072 0.287
Mitigating Expenditure 0.024 0.02 0.151 1.197 0.235
Averting Activity -0.109 0.113 -0.13 -0.966 0.337
Outdoor Pollution 0.005 0.012 0.285 0.185 0.007
a. Dependent Variable: Sick days
[image:9.595.138.460.80.244.2]MODEL SUMMARY
Table 4. Model Summary for Model 1
Model Summaryb
Model R R
Square
Adjusted R Square
Std. Error of the Estimate
Change Statistics
Durbin-Watson R Square
Change
F
Change df1 df2
Sig. F Change
1 .367a 0.56 0.509 0.41775 0.135 12.727 8 80 0.152 1.562
a. Predictors: (Constant), Averting Activity, HealthStock Index, Mitigating Expenditure, Nutrition Index, Habits Index, Indoor Pollution, Income, Awareness Index, Outdoor Pollution
[image:9.595.64.527.397.605.2]The Model 1 regression is run using the double – log model, where the coefficients explain the partial elasticities. Each of the coefficients indicate the percentage change in sick days brought about by one percentage change in the corresponding independent variables. The regression results compiled in Table 3 and Table 4 clearly reveal that the number of sick days are significantly inversely related to nutrition status. As nutrition status worsens, depicted by increase in nutrition index, the number of sick days increases, implying a positive relation with nutrition index with significant t-value of approximately 2 as depicted in Table 3. Also implies that a unit reduction in nutrition status highly increases the number of sick days making it highly elastic. Impact of indoor pollution on sick days is also observed to be positive but not significant. Awareness about the diseases caused due to air pollution reduces the number of sick days and chronic illness captured by health stock also increases the number of sick days. The worsening of habits indicated by increase in habit index also increases the number of sick days.
The results indicate that sick days are elastic with respect to nutrition index, awareness index and mitigating expenditure while the number of sick days are inelastic with respect to other variables. A unit change in percentage
of nutrition index, awareness index and mitigating expenditure will bring about more than a unit change in number of sick days. The model reflects average goodness of fit with 56% as coefficient of determination as shown in Table 4. This indicates that around 56 percent of variations in sick days or the health status of individuals has been explained by the selected independent or exogenous variables. The overall significance of regression is considerably high as reflected by F statistics of about 12 in Table 4.
The results of model 1 emphasize the significance of nutrition intake, awareness of individuals regarding the diseases caused by air pollution and the impact of expenditure made by individuals to mitigate the illness caused due to air pollution.
Model II: Taking Mitigating expenditure as Dependent Variable (Double log Model)
Mitigating expenditure = mitigating expenditure (Nutrition Index, Indoor pollution, Awareness index, Healthstock index, Income, Sick days, Averting activity, Outdoor pollution)
Table 5. Results of Model II with mitigating expenditure as dependent variable
Coefficientsa
Model Unstandardized Coefficients Standardized Coefficients T Sig.
B Std. Error Beta
1
(Constant) -4.713 6.999 -0.673 0.503
Nutrition Index -0.818 1.809 -0.065 -0.452 0.652
Indoor Pollution 6.761 2.045 0.54 3.306 0.001
Awareness Index -1.09 0.301 -0.57 -3.624 0.001
HealthStock Index -0.194 0.118 -0.163 -1.643 0.104
Habits Index 2.029 0.595 0.352 3.409 0.001
Income -0.776 0.33 -0.378 -2.353 0.021
Sick days 0.742 0.619 0.116 1.197 0.235
Averting Activity -0.935 0.624 -0.175 -1.499 0.138
Outdoor Pollution 0.017 0.029 0.004 0.031 0.004
a. Dependent Variable: Mitigating Expenditure
MODEL SUMMARY
Table 6. Model Summary of Model II
Model Summaryb
Model R R
Square
Adjusted R Square
Std. Error of the Estimate
Change Statistics
Durbin-Watson R Square
Change
F
Change df1 df2
Sig. F Change
1 .579a 0.661 0.622 5.399 0.336 19.498 8 80 0 1.541
a. Predictors: (Constant), Averting Activity, Sick days, HealthStock Index, Nutrition Index, Habits Index, Indoor Pollution, Awareness Index, Income, Outdoor Pollution
[image:10.595.66.534.389.584.2] [image:10.595.62.527.640.706.2]The Model 2 regression is run using the double – log model, where the coefficients explain the partial elasticities. Each of the coefficients indicate the percentage change in sick days brought about by one percentage change in the corresponding independent variables. The regression results compiled in Table 5 and Table 6 clearly reveal that increase in indoor pollution significantly increases mitigating activities implying that individuals need to spend more on sick days as indoor pollution rises as depicted in Table 5. The mitigating expenditure is highly elastic with respect to indoor pollution implying that as the indoor pollution worsens by one unit, it affects the expenditure on mitigating activities drastically. The awareness about the diseases caused by air pollution significantly reduces the mitigating expenditure incurred by individuals, making it elastic with respect to mitigating activities. Mitigating expenditure is highly elastic with respect to habit index implying that as habits worsen reflected by increase in habit index, the expenditure on mitigating activities increases. Mitigating expenditure is almost unitary elastic with respect to health stock, sick days and averting activities, indicating that these variables bring about a proportionate change in affecting mitigating activities.
The results indicate that expenditure on mitigating activities is inelastic with respect to nutrition status and outdoor pollution, stating that a percentage change in nutrition status of individuals brings about less than a unit change in proportion of mitigating expenditure. Similar
impact is experienced in case of one percentage change in outdoor pollution. The model reflects average goodness of fit with 66% as coefficient of determination as shown in Table 6. This indicates that around 66 percent of variations in mitigating expenditure or the amount spent by individuals on mitigating activities such as medical expenses has been explained by the selected independent or exogenous variables. The overall significance of regression is considerably high as reflected by F statistics of about 19 in Table 6.
The results of model 2 emphasize the significance of Indoor pollution, awareness of diseases caused by air pollution, health stock of individuals, income of individuals, health status of individuals, and averting activities undertaken by individuals for avoiding exposure to ambient pollution.
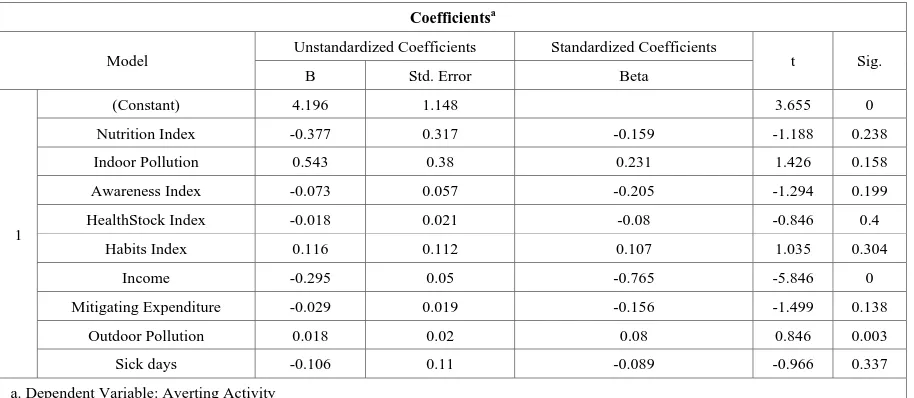
Model III: Taking Averting Activity as Dependent Variable (Double log Model)
Averting activities = averting activities (Nutrition Index, Indoor pollution, Awareness index, Healthstock index, Income, Sick days, Mitigating expenditure, Outdoor pollution)
The results reveal that nutrition index plays a positive role in reducing the averting activities and reduction in indoor pollution and good habits play a positive role in reducing averting activities as depicted in Table 5.
Table 7. Results of Model III with averting activity as dependent variable
Coefficientsa
Model Unstandardized Coefficients Standardized Coefficients t Sig.
B Std. Error Beta
1
(Constant) 4.196 1.148 3.655 0
Nutrition Index -0.377 0.317 -0.159 -1.188 0.238
Indoor Pollution 0.543 0.38 0.231 1.426 0.158
Awareness Index -0.073 0.057 -0.205 -1.294 0.199
HealthStock Index -0.018 0.021 -0.08 -0.846 0.4
Habits Index 0.116 0.112 0.107 1.035 0.304
Income -0.295 0.05 -0.765 -5.846 0
Mitigating Expenditure -0.029 0.019 -0.156 -1.499 0.138
Outdoor Pollution 0.018 0.02 0.08 0.846 0.003
Sick days -0.106 0.11 -0.089 -0.966 0.337
[image:11.595.71.528.459.658.2]MODEL SUMMARY
Table 8. Model Summary of Model III
Model Summaryb
Model R R
Square
Adjusted R Square
Std. Error of the Estimate Change Statistics Durbin-Watson R Square Change F
Change df1 df2
Sig. F Change
1 .640a 0.41 0.351 0.41264 0.41 6.937 8 80 0 0.641
a. Predictors: (Constant), Sick days, Nutrition Index, HealthStock Index, Mitigating Expenditure, Income, Habits Index, Awareness Index, Indoor Pollution, Outdoor Pollution
b. Dependent Variable: Averting Activity
The Model 3 regression is run using the double – log model, where the coefficients explain the partial elasticities. Each of the coefficients indicates the percentage change in sick days brought about by one percentage change in the corresponding independent variables. The regression results compiled in Table 7 and Table 8 clearly reveal that expenditure on averting activity is elastic with respect to indoor pollution and mitigating activity while highly elastic with respect to income of individuals. This implies that with one percent change in incomes of individuals, the expenditure on averting activities increases more than a unit. Averting activities are unitary elastic with respect to habit index and awareness index implying that both the variables will bring about equal change in the averting activities.
The model reflects 41% as coefficient of determination as shown in Table 8. This indicates that around 41 percent of variations in averting activity or the amount spent by individuals on averting activities such as taking longer route to avoid pollution has been explained by the selected independent or exogenous variables. The overall significance of regression is considerably high as reflected by F statistics of about 6 as shown in Table 8. The results of model 3 emphasize the significance of Indoor pollution, habits and awareness of diseases for reducing averting activities.
4. Discussion
The hypothesis of the study mainly that indoor pollution, nutrition status of individuals habits , awareness of diseases caused by air pollution, play a crucial role in reducing the sick days and in turn reducing the expenditure on mitigating activities. The averting activities adopted by individuals to safeguard themselves against air pollution are found to be successful in reducing the number of sick days but the effect is inelastic. Similarly, outdoor pollution also increases number of sick days.
It is implicit in the results that nutrition intake, awareness of individuals regarding the diseases caused by air pollution and expenditure made by individuals play a significant role to mitigate the illness caused due to air pollution. Further, the significance of Indoor pollution,
awareness of diseases caused by air pollution, health stock of individuals, incomes of individuals, health status of individuals, and averting activities undertaken by individuals in avoiding exposure to ambient pollution has been reflected substantially in the results. The results also emphasize the significance of Indoor pollution, habits and awareness of diseases for reducing averting activities.
The fact that the region of South Delhi pertains to people belonging to higher standard of living accounts for the result that number of sick days are inelastic with respect to indoor pollution. The residents have better living conditions and have sophisticated houses complying with the standards of pollution free indoor living standards. Similarly the outdoor pollution also does not affect number of sick days significantly reflected from the results that are inelastic with respect to outdoor pollution. It is evident from the results that averting activities are unitary elastic with respect to nutrition index, indoor pollution, awareness index, habit index and mitigating expenditure in the South Delhi region. As indoor pollution increases the individuals spend more on averting activities. As individuals adopt unhealthy habits, the individuals tend to spend more on averting activities. Similarly as outdoor pollution increases individuals spend more on averting activities.
Consequently in the South Delhi region, nutrition intake of individuals, habits adopted by people, awareness about air borne diseases as well as health stock of individuals significantly affect the expenditure on mitigating activities. Expenditure on mitigating activities further reduces the number of sick days or in other words improves the health status of individuals.
5. Conclusions
Almost all the indicators of outdoor pollution, mainly NO2, CO, PM2.5, PM10 exceed the permissible levels of
standards prescribed by Central Pollution Control Board (CPCB), Delhi. Among all the indicators of ambient air quality, CO, PM2.5 and PM10 exceed the standards by maximum amount. PM2.5 and PM10 show the highest fluctuations during the winter season.
indoor pollution, health stock, averting activity, outdoor pollution and habits while the number of sick days is observed to be unitary elastic with respect to awareness index, income and mitigating expenditure. The South Delhi region consists of households with better quality of living conditions, therefore the sick days are inelastic with respect to indoor pollution. Moreover, the ambient air quality is also much better than any other region in Delhi implying less elasticity of sick days with respect to outdoor pollution.
Further, the expenditure on mitigating activities is observed to be highly elastic with respect to indoor pollution, awareness index, and habit index, income while inelastic with respect to nutrition index, outdoor pollution and unitary elastic with respect to health stock, sick days and averting activities. It is evident that as far as expenditure on mitigating activities is concerned in South Delhi region, individuals tend to spend more on mitigating activities when there is rise in indoor pollution than in case of outdoor pollution.
Finally, the expenditure on averting activities are highly elastic with respect to income while unitary elastic with respect to nutrition index, indoor pollution, awareness index, habit index, mitigating expenditure. However, the expenditure on averting activities is inelastic with respect to outdoor pollution, health stock and sick days.
It is evident from the present study that indoor pollution, habits and nutrition status of individuals play a critical role in determining the sick days as well as the expenditure on mitigating activities. This suggests that various policies promoting access to clean energy fuel and motivating awareness about indoor pollution should be formulated. Since good habits such as morning walk and good nutrition status play a significant role in determining sick days of individuals, the policies should be formulated to encourage programmes educating individuals in the community about healthy habits and healthy nutrition intake. In addition, the awareness about the indoor pollution and the attributes affecting it should be highlighted emphasizing their significance in building better health status. Clean fuel for cooking serves as a critical variable for indoor pollution. In this context, the state should implement policies for providing clean cooking access to all, avoiding political economy in the provision.
Acknowledgements
We are grateful to the University of Delhi for rendering financial support to the project and for the constant support and guidance. We take this privilege to thank our mentor, Prof. M.N. Murty, Institute of Economic Growth, for his unconditional assistance. We will remain indebted to Dr. D. Saha, Additional Director, CPCB, for his valuable observations and endless support on pollution data. The authors extent their gratitude to the entire team of students
that made the project successful with their dedication and tireless efforts. Students Team: Aishwarya Vasudha, Bhoomi Aggarwal, Chitranshi Singh, Drishti Narula, Juhi Dugar, Mansi Goyal, Phalguni Sanghi, Pragati, Rupeesha Galhotra, Srishti Gupta, Sanjeev Kumar, Yogesh.
REFERENCES
[1] https://www.stateofglobalair.org/sites/default/files/soga-201 8-report.pdf [2] https://www.who.int/airpollution/data/cities/en/ [3] http://censusindia.gov.in/aboutus/personnel/perdirectory.as px [4] https://aqicn.org/city/delhi[5] K. Mukhopadhyay, O. Forssell. An empirical investigation of air pollution from fossil fuel combustion and its impact on health in India during 1973–1974 to 1996–1997, Ecological Economics, Vol.55, No.2, 235-250.
[6] K. R. Smith. National burden of disease in India from indoor air pollution, Proceedings of the National Academy of Sciences, Vol.97, No.24, 13286-13293.
[7] N. Bruce, R. Perez-Padilla, R. Albalak. Indoor air pollution in developing countries: a major environmental and public health challenge, Bulletin of the World Health organization, Vol.78, 1078-1092.
[8] K. R. Smith, S. Mehta. The burden of disease from indoor air pollution in developing countries: comparison of estimates, International journal of hygiene and environmental health, Vol.206, No.4-5, 279-289.
[9] M. K. Ghose, S. R. Majee. Air pollution caused by opencast mining and its abatement measures in India, Journal of Environmental Management, Vol.63, No.2, 193-202.
[10]J. Zhang, K. R. Smith. Household air pollution from coal and biomass fuels in China: measurements, health impacts, and interventions, Environmental health perspectives, Vol.115, No.6, 848-855.
[11]T. E. Kjellstrom, A. Neller, R. W. Simpson. Air pollution and its health impacts: the changing panorama, The Medical Journal of Australia, Vol.177, No.11, 604-608.
[12]S. K. Guttikunda, R. Goel. Health impacts of particulate pollution in a megacity—Delhi, India, Environmental Development, Vol.6, 8-20.
[13]K. H. Kim, E. Kabir, S. Kabir. A review on the human health impact of airborne particulate matter, Environment international, Vol.74, 136-143.
[14]Haines, R. S. Kovats, D. Campbell-Lendrum, C. Corvalán. Climate change and human health: impacts, vulnerability and public health, Public health, Vol.120, No.7, 585-596.
[16]Y. Liu, X. Lu, Z. J. Huang, H. Yuan. Air pollution and its health impact, Chin J Mod Med, Vol.21, No.1, 87-91.
[17]N. Künzli, R. Kaiser, S. Medina, M. Studnicka, O. Chanel, P. Filliger, ..., J.Schneider. Public-health impact of outdoor and traffic-related air pollution: a European assessment, The Lancet, Vol.356, No.9232, 795-801.
[18]R. Afroz, M. N. Hassan, N. A. Ibrahim. Review of air pollution and health impacts in Malaysia, Environmental research, Vol.92, No.2, 71-77.
[19]T. E. Kjellstrom, A. Neller, R. W. Simpson. Air pollution and its health impacts: the changing panorama, The Medical Journal of Australia, Vol.177, No.11, 604-608.
[20]J. Cohen, H. Ross Anderson, B. Ostro, K. D. Pandey, M. Krzyzanowski, N. Künzli, ..., K. Smith. The global burden of disease due to outdoor air pollution, Journal of Toxicology and Environmental Health, Part A, Vol.68, No.13-14, 1301-1307.
[21]M. Kampa, E. Castanas. Human health effects of air pollution, Environmental pollution, Vol.151, No.2, 362-367.
[22]S. M. Bernard, J. M. Samet, A. Grambsch, K. L. Ebi, I. Romieu. The potential impacts of climate variability and change on air pollution-related health effects in the United States, Environmental health perspectives, Vol.109, No.2, 199.
[23] Nero, A. V., & Nazaroff, W. W. (1984). Characterising the source of radon indoors, Radiation Protection Dosimetry, Volume 7, No. 1-4, Pages 23-39.
[24]P. Jones. Indoor air quality and health, Atmospheric environment, Vol.33, No.28, 4535-4564.
[25]Brunekreef, S. T. Holgate. Air pollution and health, The lancet, Vol.360, No.9341, 1233-1242.