Approach to Environmental Sustainability and Green
Campus at Universiti Teknologi Malaysia: A Review
Parviz Ghojogh Najad1, Anuar Ahmad1,*, Irina Safitri Zen2
1Department of Remote Sensing, Faculty of Geoinformation and Real Estate States, Universiti Teknologi Malaysia, Malaysia
2Institute Sultan Iskandar (ISI), Department of Urban and Regional Planning, Faculty of Built Environment,
Universiti Teknologi Malaysia, Malaysia
Copyright©2018 by authors, all rights reserved. Authors agree that this article remains permanently open access under the terms of the Creative Commons Attribution License 4.0 International License
Abstract Environmental pollution is a complex and
rapidly evolving challenge faced by urban environments. University campuses are susceptible to greenhouse gas (GHG) emissions arising from energy use, particularly due to vehicular movement, solid waste generation and disposal, and electricity generation. The impact of GHG emissions, particularly carbon dioxide (CO2) on climatechange, mainly global warming, which has emerged a contemporary concern. The recent increase in the number of proposals for regulatory legislations on emission control indicates the need for a clear methodology to address GHG emissions, as well as their environmental impacts. This paper deals with CO2 emission arising from energy used
and solid waste within the campus of Universiti Teknologi Malaysia, Johor Bahru. The objective of this study is only the environmental aspect, related to carbon emission from energy used in the study area under review. This emission sources on UTM campus include, transportation, electricity and waste generation. This work reviews the application of compliance plans and approaches for the monitoring and control of environmentally sustainable parameters and categories. The performance of each model which reflects the sustainability achievement goals was determined. Constraints to the practice of sustainability concepts are identified and measures to improve sustainability levels are suggested. It is concluded that by following the standard set by Universitas Indonesia (UI) ranking, sustainability coupled with, enabling environment will be enhanced for universities’ dwellers.
Keywords
Climate Change, Sustainability, Green Campus, Green Metric, Environment1. Introduction
Universities with large populations and spatial extents are faced with significant carbon emission problems and
pollution issues. Greenhouse gas (GHG) emissions have a significant impact on the composition of the Earth’s atmosphere. The major sources of GHGs on campuses are electricity usage, vehicular movement, and waste disposal. [1] Therefore, the issue of carbon dioxide has become a global threat and as such, the world is at work to remedy this excruciating ill with a trickling down effect to universities and schools worldwide in the study of climate change. [8] With sound knowledge and in-depth research outputs the pros and cons of climate change, will present a definite means of curtailing carbon dioxide emissions. [6]
Therefore, substantial investment is required to cut down on the emission rate of greenhouse gases into the atmosphere. To adapt to this adverse impact of unavoidable climate changes, there is an increasing demand for good quality environmental sustainability. The specific component of campus sustainability and greening is the management of energy and solid wastes.
Universities in Malaysia are mostly having their own sustainable unit on campus and UTM is not an exception. UTM has made some positive impacts from some of the initiatives which have helped in achieving the mission of reducing carbon dioxide emission on campus with respect to the global climate issues, UTM began in 2009 through simple initiatives such as promoting recycling, saving paper, energy and water (Zen et al., 2014). Enforcement of such actions in having sustainable initiatives within the area that can effectively reduce carbon emissions on campus is successful due to formulation and implementation of policies by the management [3].
According to Universitas Indonesia (UI) Green Metric World University ranking 2013 and 2014, 2015 and 2016 and 2017 UTM was ranked 98th and 86th, 118th and 85th and
66th position respectively for environmental performance.
the university management including the community to make the campus environment more sustainable.[2] For this study, only the environmental aspect, related to carbon
[image:2.595.65.530.126.316.2]emission from energy use is considered such as electricity, transportation and waste generation within the university environment.
Figure 1. UTM Green Metric Ranking 2013 and 2014
Figure 2. UTM Green Metric 2015 to 2017
2. Main Sources of Carbon Emissions in UTM
2.1. Energy
Energy consumption in Malaysia largely hinges on Electricity supply and UTM is not an exception to this national phenomenon- [1] The case study area (UTM - Johor campus), approximately houses 575 buildings which include, faculties buildings, student’s hostels, library, banks, post office, mosque, departmental buildings with elevators, laboratories for science and engineers, Hospital and Computer Unit. All the listed facilities largely depend on electricity for its effective and efficient running.
[9] It is estimated that RM 20 Million is use by UTM in paying pays Electricity bills on yearly basis. With growth in both student’s population and development on a yearly basis, there is every inclination for an increase in electricity bills every year.
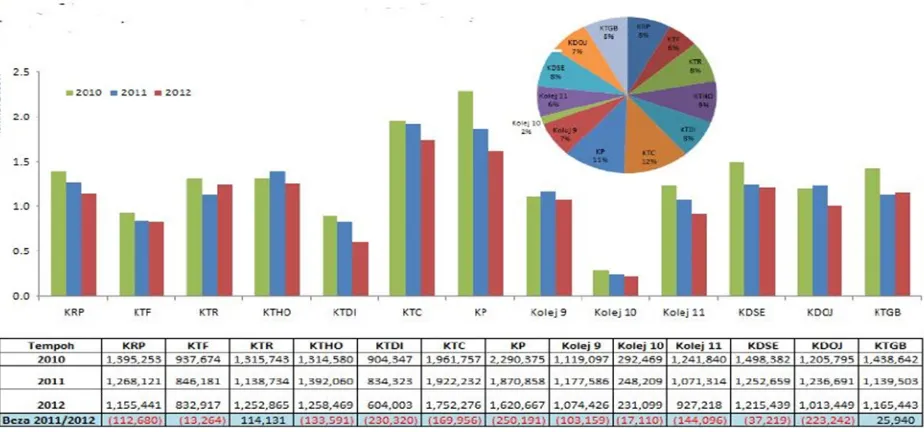
In 2010, UTM launched a campaign title ‘Sustainability and Go Green Campaign’ with the aim of reducing the electricity bills. To achieving this objective, several initiatives were introduced such as: Studying Electricity tariff, campaigns on energy efficiency and monitoring the effective utilization of Electrical appliances., An energy management committee was established to help reduce the emission of Greenhouse Gases within UTM environs as shown in Figure 3, 4, and 5 with the sole objective of realizing the set goals.
[image:2.595.67.532.342.446.2]Figure 3. Energy consumption in UTM faculties (in kWh) (2010, 2011 and 2012)
All faculties showed a reduction in energy consumption compared with 2011 except FAB, FPREE, and FKK & FPPSM. Total reduction for all faculties is 450.879 kWh or -2.17% from 2011 to 2012 as shown in figure 3 [11].
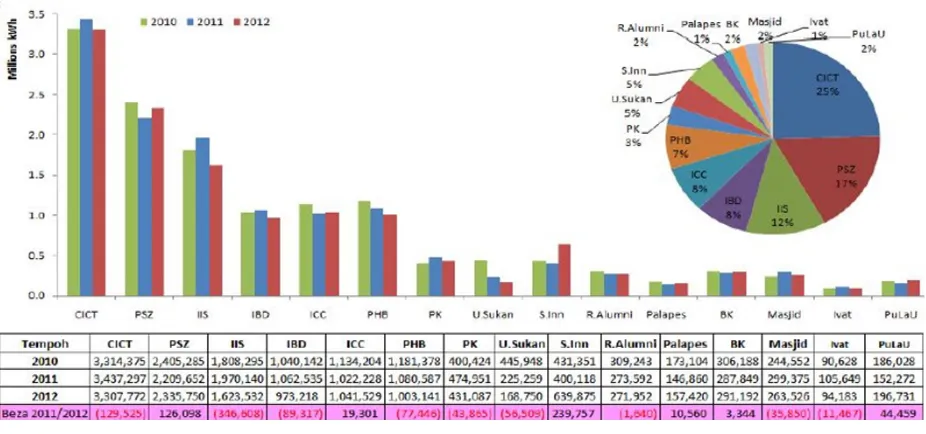
Figure 4. Electricity consumption in college UTM (in kWh) (2010, 2011 and 2012)
[image:3.595.68.530.375.591.2]Figure 5. UTM office electricity consumption (in kWh) (2010, 2011 and 2012)
All offices PSZ, ICC, Scholar Inn, Balai Keselmatan & Training Center) showed a decrease in the use of energy compared with 2011. Total decrease in the hostels category is 345.282 kWh or -2.63 % from 2011 to 2012 as indicated in figure 5 [11].
Figure 6. Chart showing UTM energy consumption rate from 2009 to 2012
2.2. Transportation
Transportation is the movement from one geographic location to another. In UTM, automobile traffic is on the increase which has direct impact on the environment through the emission of carbon dioxide.
So, transportation remains a major source of GHG and a primary contributor to the growth of CO2 emissions (EPA,
2006) in the university campus, where high population concentration, high vehicular traffic and high energy use for various service demands results into high carbon emission due to the fossil fuel-based energy source.
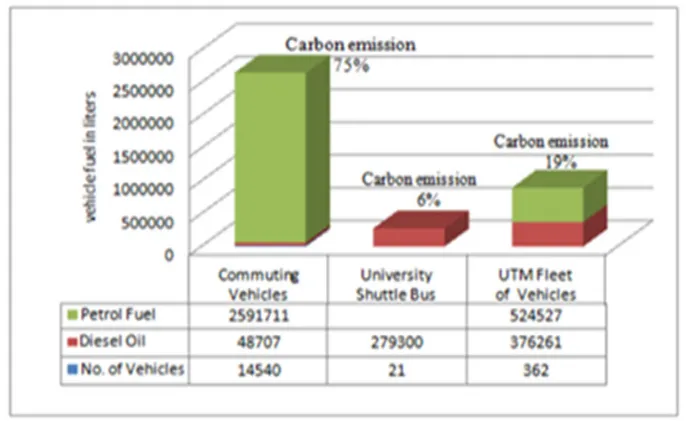
[image:4.595.121.486.374.503.2]Previous research conducted identified the types of vehicles commuting within UTM. Among the commuting vehicles, are private cars which account for 82% while motorcycles constitute 18% of all vehicles coming and out of UTM campus. The survey further reveals proportion of commuting vehicles owned by UTM’s Staff and students -/- Visitors, this accounted for 62% and 38% respectively.
[image:5.595.126.469.168.384.2]As shown in Figure 7 below, the carbon emission rate was surveyed at UTM and 75% of the carbon emission was apportioned to staff and students as compared to only 19% from the university fleet and only 6% is from the shuttle buses [4].
Figure 7. Carbon emission survey at UTM
Emissions from automobiles depend on the number of trips or miles traveled by each type of vehicle each day, this in turn determines the extent of pollution of the environment. For example, driving in a private car for 6 km releases 1kg CO2 from petrol combustion; hence riding a
bus is better since only 0.5kg CO2 is released for the same
distance. For the transportation guideline for UTM, 300-km has been set as the limit and within this limit set there is decrease in the emission of carbon dioxide from 3092.66 to 2900.92 metric tons. Among the activities held at the launching of UTM Sustainable Campus include riding bicycles. Bicycling and walking are two components of more global Transportation demand management (TDM) strategies of UTM bicycle program which officially started in October 2010. This effort is expected to reduce the traffic problems in UTM besides having a sustainable environment whose result directly reduces the carbon emission. Therefore, preserving and expanding the role of non-motorized transports will also minimize CO2 emission
in UTM Skudai campus. With the Mapping of the achievement of the sustainable campus in 2011 using the MMG-TSCiMU matrix table, UTM is on the transition stage for the transportation, water and energy management. Indoor environmental quality is at initial stage of the sustainability whereby more efforts need to be put in place to increase the level of sustainability. [5].
3. Solid Waste
The increase in student population has an impact on the
proportion of waste produced per day, that is, the more the student’s population the more the waste is produced. Waste generation is typical of students’ hostels, canteens, administrative buildings, Faculties and departments blocks and the influx of visitors from the outside communities. In 2009, UTM was generating 14-15 tonnes of waste per day as compared to 2010 with an increase in waste generation to 16 tonnes per day [12]. This said increase in waste generation is because of the parallel increase in student’s population and if the generation of waste is not checked, it will pose a threat and unfriendly atmosphere for both human and other living organisms [7].
Figure 8. UTM solid waste from 2009 to 2013
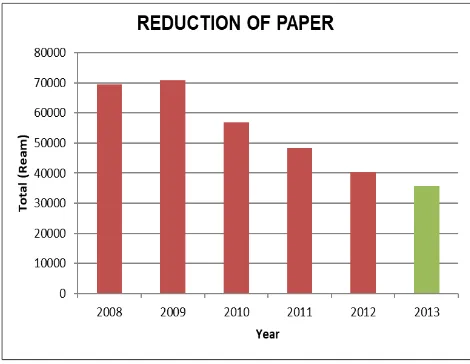
Figure 9. Reduction in paper usage in UTM from 2009 to 2013
Nine (9) researchers conducted a seven (7) months research program titled: ON-CAMPUS BIO-RECYCLING OF FOOD AND GREEN WASTE INTO COMPOST”. This research aimed at scaling up the bio recycling and composting of waste collection of food which ranges from 80 kg/day to 400 kg/day. It was this research that set the stage for UTM green waste.
4. Conclusions
From this study, it is however seen that UTM is having a positive impact on some of the initiatives program helping in achieving the mission on carbon dioxide emission reduction in response to global climate issues. Shifting towards a sustainable campus is not an easy option as it necessitates the full participation of all administrators. UTM policy makers need to set up mechanism such as education, and increase research toward the achievement of environmental sustainability.
In the case of Transportation, UTM has tried
tremendously by securing new shuttle buses with parallel construction of bus stops within UTM campus. Besides this development, green plants are grown along roads as this will encourage sidewalk for both students and other workers within UTM aside the absorption of CO2, the
creation of ponds, parks and growing of green plants also aid photosynthesis and provide good habitat for human and other species.
For the electricity part, UTM already showed it potential in using solar energy so it can decrease emission and can help the university towards achieving sustainable environment target by clinching to excellent position in the ranking, green metric ranking and environmental sustainability index in last report for example Universiti Putra(UPM) ranked 27th while UTM ranked 66th .It was
mentioned that UPM had lot of improvement at green campus and environmental sustainability.in the compared .
Acknowledgements
Author would like to thank Masilah Bandi UTM Energy Manager for the sharing information about energy saving.
REFERENCES
[1] Aziz, M. B. A., et al. "Air-conditioning energy consumption of an education building and its building energy index: a case study in engineering complex, UiTM Shah Alam, Selangor." Control and System Graduate Research Colloquium (ICSGRC), 2012 IEEE. IEEE, 2012.
[2] Alshuwaikhat, Habib M., and Ismaila Abubakar. "An integrated approach to achieving campus sustainability: assessment of the current campus environmental management practices." Journal of Cleaner Production 16.16 (2008): 1777-1785.
[3] Zen, Irina Safitri, Rahmalan Ahamad, and Wahid Omar. "The Development and Measurement of Conductive Campus Environment for Universiti Teknologi Malaysia (UTM) of Campus Sustainability." Jurnal Teknologi 68.1 (2014). Kirkpatrick, S. Gelatt, C. D. and Vecchi, M. P. Optimization by simulated annealing. Science 220(1983), 671-678.
[4] Abdul-Azeez, Isiaka Adeyemi, and Chin Siong Ho. "Realizing Low Carbon Emission in the University Campus towards Energy Sustainability." Open Journal of Energy Efficiency 4.02 (2015): 15.
[5] Hoe, Yap Koh. "Achieving sustainable campus in Malaysia University." Department of Civil Engineering. University Teknologi Malaysia, Malaysia (2011).
[image:6.595.57.292.295.477.2]Materials Science and Engineering. Vol. 88. No. 1. IOP Publishing, 2015.
[7] Yen, Ng Sock, E. S. Abdul Shakur, and Choong Weng Wai. "Energy conservation opportunities in Malaysian universities." Malaysian Journal of Real Estate 5.1 (2010): 26-35.
[8] Klemeš, Jiří, and Sauro Pierucci. "PRES 2007: Carbon footprint and emission minimisation, integration and management of energy sources, industrial application and case studies." Energy 33.10 (2008): 1477-1479.
[9] Hassan, J. S., et al. "Building energy consumption in Malaysia: an overview." Jurnal Teknologi 70.7 (2014).
[10]Zen, Irina Salitri, and Masilah Bandil Rozana Zakaria Abdul Latifah. "The UTM Sustainable Campus: institutionalize Sustainability, The Living Lab Approach and Sustainable Energy Management Program." International Workshop on Ul Greenmatric. Vol. 8.
[11]MasilahBandi UTM SUSTAINABILTY ENERGY
MANAGEMT PROGRAM 3 April 2013 KSL Hotel & Resort Johor Bahru


