Macroeconomic Variables & Its Impact on
KSE-100 Index
Muhammad Salman Khan
Institute of Management Sciences, Hayatabad, Peshawar, Pakistan *Corresponding Author: [email protected]
Copyright © 2014 Horizon Research Publishing All rights reserved
Abstract The study examines the relationships between
the KSE-100 index and a set of macroeconomic variables over sampling period from (1992) to (2011) Statistical tools i.e. Multiple Regressions and Pearson’s correlation models were used to study the relationship between stock prices (KSE-100index) and macroeconomic variables. The finding from the test shows (80%) variations in the dependent variable were explained by the independent variable. Therefore, the model was good fitted and there was a strong relationship between dependent and independent variables, variation in the stock prices explained up to (80%) by the variation in the independent variables. The results further suggested that exchange rate, inflation and GDP (Gross domestic product) growth rate were positively related with stock prices (KSE-100index). While negative impact found on the stock prices of KSE-100 index of the interest rate.Keyword
Macroeconomic Variables, KSE-100 Index, Pearson’s Product Movement Correlation Coefficient and Multiple Regression Models1. Introduction
Impacts of micro and macroeconomic variables were extremely significant for the researchers in past eras. Researchers, economists and students have attempted a lot for several years for determining the relationship between macro-economic factors and stock prices. Many factors which leads to change in the stock prices. For these purpose, researchers have applied different models in the captivation to determine the relationship between macro-economic variables and stock prices of stock exchange. Therefore, the importance of the study increased and scientist started study to determine the impact of macroeconomic factors on the prices of the stock index. Stock market plays very important rule in the development of an economy and acts like intermediary.
In the secondary stock market, Securities traded. In the stock market, security is mainly the exchange of funds. Stock markets provide investment opportunity. Change in stock
exchange index causes disturbance in the macroeconomic factors (Adam et al. 2008). Stock market by liquidity and risks sharing, accelerate the economic growth. The increase and decrease in stock prices is an understandable phenomenon of economies among the investors, corporation, policy makers and researcher. Market forces i.e. demand and supply, determined the stock prices, and if supply equal to demand of seller, at that position stock price is fixed.
Researchers are trying to find out the factors, which effect stock prices. The fundamental macroeconomic variables are inflation, industrial production index, interest rate, gross domestic product, export, exchange rate, money supply, foreign exchange reserves and unemployment has causality with prices index of stock exchange (Booth 1997 and Chan 2003). The study of (Adamet al. 2008) concluded that fluctuations in macroeconomic variables, which leads to the change the structure of stock exchange index. The government polices whether it is fiscal or monitory have a greater impact on the economic activities and stock prices of a country (Abdulland1997).
2. Literature Review
Different researchers used multiple features to find out the relationship between stock market and macroeconomic variables. Booth (1997) and Chan (2003) present that exchange rate, inflation rate, interest rate; foreign exchange reserves, money supply and industrial production index are the main factors that affect the stock market prices. Brown (1990) and Mukherjee in (1995) used different factors i.e. inflation, money supply, government bonds and call money rates to find out the link between stock market and macroeconomic variables.
Nishat and Shaheen (2004) study the relationship between macroeconomic variables and Karachi stock exchange (KSE) index. The most prominent variables used by them are money supply, consumer prices index, industrial production and interest rate. As a result they arrive to the conclusion that industrial production is directly proportional to the stock prices and inversely proportional to the rate of inflation.
inflation and exchange rate are the back bone variables of an economy. An Increase in the demand of exporting goods, the home currency depreciated because of cost of exporting goods decreases. A negative relationship was found between inflation and stock index by the study of Roll and Gaske (1983) and Rose, Chen and Rall (1986) in Tokyo stock exchange (TSE).
The study of Asperm (1989) argues that interest rate, money supply plus inflation affect the stock prices. Stock retune should be positive e related with inflation, if the stock hedge against inflation. However, the investigation of Naka (1994) show that there is an indirect relationship between inflation and stock prices. According to the Tivoli and Bulmash (1996) that when the money supply increases in the market, first it affects the wealth, impact on stock prices is positive. However, in the view of investors devaluation in currency, future uncertainty and inflation declines the stock price in the future, which is not a good sign.
According to Fama and Schwert (1977) and Schwer at (1981), proxy hypothesis describe that increase in the development activities, it decreases the inflation and because of decrease in the inflation, stock prices will increase because of indirect relationship.
Muhammad Akbar and Shahid Ali (2008) analyzed the relationship between macroeconomic variables and stock prices of Karachi stock exchange. They ride to the conclusion that macroeconomic variables co-integrated with stock prices. The study further suggests that positive relation with money supply and interest rates in the short term and negative relation with foreign exchange reserves and inflation.
The relationship between macroeconomic variables and stock prices of Karachi stock exchange (KSE) was study by Akbar and Kundi (2009). According to the study that the stock prices of Karachi stock exchange (KSE) correlated with monetary policy variables (money supply, interest rate, inflation, industrial production).
Research of Granger, Husang and Young's (2008) describe that stock market and devaluation in currency can both affect each other. Zietz and Pemberton (1990) and Hsing (2004) consider monthly data and design model and at the same time figure out macroeconomic variables.
The study of Robert Johnson (2010) in eight advanced economies investigates the short and long run relationship between exchange rate and stock. Conclusion of the study shows, that significant and direct relationship between inflation and real output. Relationship between stock index and real output in current period is positive and significant.
Heinz Herrmann et al. (2006) collect data from the U.S market and reached to the conclusion that currency deprecation lead to a decline in the stock index in the short run. Exchange rate reduction suggests higher inflation in the future, which makes investors skeptical about the company’s future performance. As a result, the stock prices start to decline.
Frank and Young (1972) study for the first time the relationship between exchange rate and stock prices. Six
different stock exchange data had taken for the study, which shows no relationship. Agrawal (1981) took monthly data of U.S stock prices and exchange rate from (1974) up to (1978) to explain the relationship between exchange rate of dollar and stock prices. For analysis, he used simple regression model and found that U.S dollar ware directly related with the stock prices, which is stronger in short term, then the long term.
The research study of Robert (2008) explain in the following words, in significant relationship between exchange rate and oil prices on the stock market index prices of BRICs (brazil, Russia, India and china). The study of Ibrahim (2000) finds out the relationship amongst exchange rate, money supply, and official resaves with stock prices. He determines bi-vitiate relationship between macroeconomic variables and stock prices.
Another research was conducted by Habib Ullah (1996) analyzed the long run relationship between stock prices, real output and money supply out of exchange rate. According to Habib Ullah, in short run the relationship between money supply and stock prices is positive but negative in long run.
Zahid (2010) also studied the relationship between macroeconomic variables and stock prices movements. He arrives to the conclusion that the impact of inflation and exchange rate on stock prices are negative and significant and the impact t of economic growth is positive but weak on the stock prices of Karachi stock exchange.
Rozina and Nishta (2004) described a causal relationship between stock market and the economy of Pakistan. Muhammad (2009) also analyzed the relationship between macroeconomic variables and stock prices. They conclude that after the financial reforms In Pakistan, foreign exchange reserves and foreign exchange rates significantly affect the stock prices.
The research study of Mustafa (2007) took variables like GDP (Gross domestic product), size of stock exchange, stock exchange liquidity and production. He used co-integration model technique in Pakistan and determined that stock exchange depends on overall development of economy. On the real economy, movement in stock prices of Karachi stock exchange has not such a significant affect. His analysis is different from other because he used different variables.
3. Methodology
To study the important factors which affect the stock prices of KSE-100 index are exchange rate, interest rate, inflation rate and GDP (Gross domestic product) growth rate. The research model explained with the help of variables. Several other variables, which affect the stock prices index, but these variables are considered stable.
2.1. Variables
Independent variables are exchange rate, interest rate, inflation rate and GDP (Gross domestic product). The Independent variables that are used in the study are discussed below one by one.
2.2. The Model
The theoretical frame work to study the factors of stock exchange is explained by the equation shown below, change in KSE-100 stock index are affected by change occurs in exchange rate, change in interest rate, inflation and GDP (Gross domestic products) growth rate. The research model is as follow,
Y = a+b1(x1) +b2(x2) +b3(x3) +b4(x4) +e
∆KSE = a+b1 (∆EXC) +b2 (∆IR) +b3 (∆INF) +b4 (∆GDP)
Where;
Y = dependent variable (Karachi stock exchange - 100index)
X1 = Independent variable (exchange rate) X2 = Independent variable (interest rate) X3 = Independent variable (inflation rate)
X4 = Independent variable (gross domestic product growth rate)
Where “a” is the y-intercept, b1, b2, b3 and b4 in the research model stand for the slope or regression coefficient and “e” is random error.
2.3. Data
The main objective of the paper is to examine the relationship between macroeconomic variables and stock exchange market. Variables are exchange rate, interest rate, inflation rate, GDP (Gross domestic product) and stock prices of KSE-100 index. Yearly data collected from the period of 1992 to 2011 for the above variables.
The secondary data used to study the above objective of the research. Secondary data about the macroeconomic variables i.e. exchange rate, interest rate, inflation rate, GDP growth rate and stock prices of KSE-100 have taken from different web sites i.e. Trading economic website, (www.tradingeconomics.com), website of state bank of Pakistan (www.sbp.org.pk), KSC website (www.kse.com.pk), and (www.google.com) to determine the impact of macroeconomic variables on KSE-100 index. Nineteen years of yearly data are used to determine the relationship between macroeconomic variables and KSE-100 index.
The data of 19 century was collected, because tried to find out the relationship between Macroeconomic variables and stock prices of KSE-100 index and KSE-100 index was started in November (1991).Therefore, trying from the very beginning, to determine the movements of stock prices of KSE-100 index with macroeconomic variables.
2.4. Statistical Tool
Pearson’s product movement correlation coefficient and multiple regression models are used for analysis to find out
the main objective of the study.
3. Data Analysis
3.1. Regression Analysis
Dependent KSE
3.2. Dependent Variable
Method Enter
3.3. Method
From data found, relationship between the dependent variable and independent variables, which shown in the above table1. There aggression model should concluded by using the result of the above mention table.
∆KSE-100 index = a+b1 (∆EX) +b2 (∆IR) +b3 (∆INF) +b4 (∆GDP)
KSE-100 índex = (-65.777) + (1.5385) EX+ (-2.3134) IR+ (4.1827) INF+ (5.3032) GDP
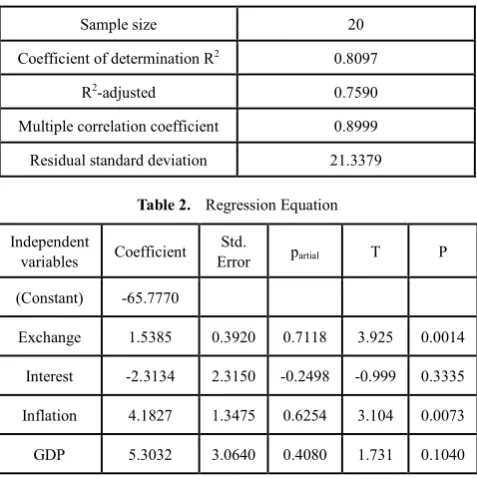
From the above data mentioned in table 1, it is clear that changes occur in the independent variable, which also to bring changes the dependent variable. Also clear from the data given in table 2 that exchange rate, interest rate, inflation rate and GDP growth rate are the independent variables which bring change in the dependent variable KSE-100 index. From the data given in table 2 exchange rate, inflation rate and GDP growth rate show positive relationship p with stock prices of KSE-100 index. All independent variables except interest rate show negative relationship with stock prices of KSE-100 index.
Table 1. Coefficient of Determination
Sample size 20 Coefficient of determination R2 0.8097
R2-adjusted 0.7590
Multiple correlation coefficient 0.8999 Residual standard deviation 21.3379
Table 2. Regression Equation
Independent
variables Coefficient Error Std. partial T P
(Constant) -65.7770
Exchange 1.5385 0.3920 0.7118 3.925 0.0014
Interest -2.3134 2.3150 -0.2498 -0.999 0.3335
Inflation 4.1827 1.3475 0.6254 3.104 0.0073
[image:3.595.313.552.515.755.2]Interpret the model from the data given in table 2, relationship between exchange rate, and stock prices of KSE-100 index is positive because when (100%) change occur in the exchange rate, it brings (1.5385%) positive change in the stock prices of KSE-100 index. Negative relationship between interest rate and stock prices of KSE-100 index, if there is (100%) change in the interest rate it brings (-2.3134%) negative changes in the stock prices of KSE-100 index. If there is (100%) change occurs in the inflation it leads to (4.1827%) positive change in the stock prices of KSE-100 index. At the end in the regression line model, if there is (100%) change in the independent variable GDP growth rate, it lead to change (5.3032%) positive change in the stock prices of KSE-100 index.
Check the significance level of the model, that the variables are significant or insignificant in the data analysis. Therefore, first use the t-ratio.
3.4. T-Ratio
T-ratio is used to check the individual significance of the regression coefficients. For this purpose, first find the degree of freedom, with the help of the following formula.
Degree of freedom = total number of observations – total number of variables
Degree of freedom = 20-5 = 15
Find the confident level which is α = 0.05
Find the value of t-tabulated from the t – distribution table and in the t– distribution table the value of the t-tabulated is (1.753). Look at the above table; find out the value of t-calculated for each independent variable. Compare the value of t-calculated with the t-tabulated, which show either the independent variables are significant or insignificant.
If t – calculated > t-tabulated then the coefficient of variables are significant
If t – calculated < t-tabulated then the coefficient of variables are insignificant
T-calculated value for exchange rate from table 2 is (3.925), interest rate is (-0.999), inflation is (3.104) and GDP growth rate is (1.731). Look at the above data so; conclude in the following words that exchange rate and inflation are statistically significant, while interest rate and GDP growth rate is statistically insignificant.
3.5. F-Ratio
F-test is used to check the overall model is significance or insignificance. For this purpose, first find the degree of free demand confidence interval value of f-tabulated from the f-distribution table.
F – Tab = (0.05) (4, 15) = 3.06
If f – calculated > f – tabulated then the overall model is significant
If f – calculated < f-tabulated then the overall model is insignificant
The value of f-calculated from table 4 is (15.9592) and the
[image:4.595.313.552.124.260.2]f–tabulated value is (3.06). Compare the value of f -calculated with f - tabulated. Therefore, the overall model is statistically significance.
Table 3. Analysis of Variance
Source DF Squares Sum of Mean Square
Regression 4 29065.1540 7266.2885
Residual 15 6829.5822 455.3055
Table 4. F-Ratio
F-ratio 15.9592
Significance level P<0.001
3.6. Coefficient of Determination (R2)
To check that the model is fit or not the coefficient is determined. It range from (0) to (1). In the above table 1, the value of R2 is (0.8097), which is near to (1). It shows that (80%) variation in the dependent variable has explained by the independent variable. Therefore, the model is good fit and there is a strong relationship between dependent and independent variation in the stock prices explained up to (80%) by the variation in the independent.
3.7. Pearson’s Product Movement Correlation Coefficient
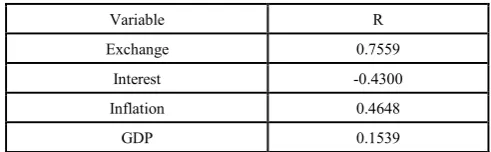
[image:4.595.308.554.533.609.2]Pearson’s products movement correlation coefficient was used to test the relationship between the variables, denoted by Greek letter ρ. Its range from (+1 to -1) when (ρ > +1) it indicates positive liner relationship and if (ρ < -1) it indicate negative liner relationship and if (ρ = 0) it show no relationship among the variables.
Table 5. Zero order correlation coefficients
Variable R
Exchange 0.7559 Interest -0.4300 Inflation 0.4648
GDP 0.1539
3.8. Exchange Rate → KSE-100 Index
the same with the research conducted by (Aggrawal 1981), found that U.S dollar is positive with stock prices. The study of (Ibrahim 2001) also shows positive relationship between stock prices and exchange rate.
Table 6. Exchange rate → KSE-100 index
KSE Exchange
KSE Correlation Coefficient Significance Level Pn 0.0001 0.756 20
Exchange Correlation Coefficient Significance Level Pn 0.0001 0.756 20
3.9. Interest Rate → KSE-100 Index
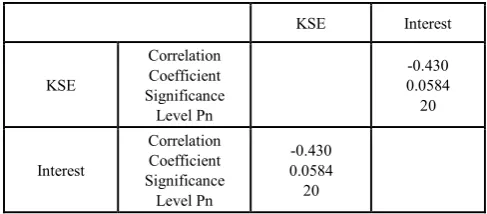
According to the Pearson’s correlation, analyzed the relationship between interest rate and stock prices of KSE-100 index is moderate but negative in table 5 and 7. The analysis suggests that there are (-43%) negative relations between stock prices index and independent variable interest rate .Correlation between interest rate and stock prices is statistically insignificant because the value of (p i.e. 0.0584) which is greater than (0.05). The negative correlation confirmed the previous research study. The study of (Nishat and Shaheen 2007) and (Asperm 1989) shows negative correlation between interest rate and stock prices.
Table 7. Interest rate → KSE-100 index
KSE Interest
KSE
Correlation Coefficient Significance
Level Pn
-0.430 0.0584 20
Interest
Correlation Coefficient Significance
Level Pn
-0.430 0.0584 20
The above study verified economic theory regarding the inverse relationship between the interest rate and investment. In July (2008) when the inflation moved to double the digits, the government also wants to control the hipper inflation, they increase the rate of interest, which caused bad effect on stock prices.
3.10. Inflation Rate → KSE-100 Index
Moderate positive correlation between inflation and stock prices KSE-100 index in table 5 and 8. According to the Pearson’s correlation coefficient result, suggest (46.5%) moderate positive correlation between dependent variable KSE-100 index and independent variable inflation. The value is less then (0.05), therefore, the correlation between inflation and stock prices of KSE-100 index is statistically significant. This correlation is somehow against the correlation given in literature as reviewed. The research of
(Neshat and Shaheen 2004), (Akbar and Shahid Ali 2008), (Roll and Gaske (1983), (Zahid and Naka 1994), (Fama, and Schart 1977) all of them have shown negative correlation founded between inflation and stock prices. However, the study of the (Asperm 1989) shows positive correlation with stock prices. The study of (Robert Johnson) shows positive relationship between inflation and stock prices.
Table 8. Inflation rate → KSE-100 index
KSE Inflation
KSE
Correlation Coefficient Significance
Level Pn
0.465 0.0389
20
Inflation
Correlation Coefficient Significance
Level Pn
0.465 0.0389
20
3.11. GDP Growth Rate → KSE-100 Index
From the analysis of the data in the table 5 and 9, relationship between GDP growth rate and stock prices of KSE-100 index is very weak positive. The model suggests only (15.4%) positive correlation between GDP growth rate and stock prices and statistically insignificant. The study analysis follows the previous researcher study. The research study of (Gevit Duca) show positive relationship between the stock prices and GDP. The study of (Mustafa 2007), the study of (Zahid 2010) and (AL-Tamimi 2007) analyzed the same result according to this study i.e. GDP and stock prices show very weak and positive correlation with stock prices index of Karachi stock exchange.
Table 9. GDP Growth rate → KSE-100 index
KSE GDP
KSE
Correlation Coefficient Significance
Level Pn
0.154 0.5171
20
GDP
Correlation Coefficient Significance
Level Pn
0.154 0.5171
20
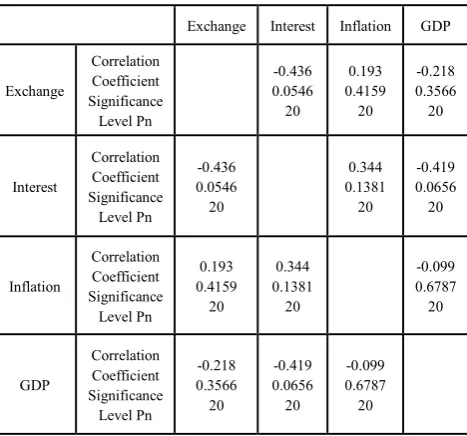
[image:5.595.55.299.422.529.2]10, which confirm the study of (Chen et al.1986) and (Fama 1990). The interrelations between interest rate and GDP growth is moderate negative .Relationship between interest rate and GDP growth rate is negative but very weak correlation between these two independent variables.
Table 10. Correlation amongst Independent Variables
Exchange Interest Inflation GDP
Exchange
Correlation Coefficient Significance
Level Pn
-0.436 0.0546 20
0.193 0.4159
20
-0.218 0.3566 20
Interest
Correlation Coefficient Significance
Level Pn
-0.436 0.0546 20
0.344 0.1381
20
-0.419 0.0656 20
Inflation
Correlation Coefficient Significance
Level Pn
0.193 0.4159
20
0.344 0.1381
20
-0.099 0.6787 20
GDP
Correlation Coefficient Significance
Level Pn
-0.218 0.3566 20
-0.419 0.0656 20
-0.099 0.6787 20
From the relationship it was Concluded that independent variables show positive and negative or direct and indirect relationship but not strong enough to consider important, because each independent variable show moderate or weak correlation.
4. Conclusions
Fluctuation in the macroeconomic variable i.e. exchange rate, interest rate, inflation and GDP growth rate have an impact on the stock prices of KSE-100 index. The brief summary of the whole paper are discuss below.
A number of variables in the economy that affect the stock prices of stock exchange of any nation. In the Pakistani economy, there are three stocks exchange market are operating i.e. Karachi stock exchange, Lahore stock exchange and Islamabad stock exchange. Karachi stock exchange is the oldest and biggest stock exchange in Pakistan. Karachi stock exchange captures (74%) of capital market of Pakistan. It play very important role in the development of Pakistani economy. Four different macroeconomic variables are used to find out the impact of these variables on stock prices of KSE-100 index. Data was collected from (1992) to (2011) and used for the study.
From the analysis of the data in the table 1, R2 is the coefficient of determination that is used to check that the overall model is good fitted or not. It shows the total variation in independent variables. In the table, the value of R2 is (0.8097 or 80.97%), which suggest that the model is good fitted and explained all independent variables. The
model suggest that independent variables like exchange rate, inflation and GDP growth rate shows directly and positive correlation with stock prices of KSE-100 index and interest rate shows inverse and negative correlation with stock prices of KSE-100 index.
To identify about the statistical significantly use T-test and F-test. Use T-test for individual significantly of variables .Macroeconomic variables like exchange rate and inflation are statistically significant, while interest rate and GDP growth rate is statistically insignificant. The overall model is statistically significant, according to the F-test analysis.
According to the Pearson’s correlation model, the relationship between exchange rate and stock prices of KSE-100 index show strong positive correlation with stock prices and also statistically very significant. The result of this study is the same as the research of (Agrawall 1981), (Ibrahim and Nadeem Sohail) and (Zakir Hussain 2002).
Moderate positive correlation between inflation and stock prices and it is also statistically significant, that confirmed the result of the (Asperm 1989) research study. GDP growth rate correlation with stock prices of Karachi stock exchange is positive but very weak and also statistically insignificant. Therefore, it does not require too much consideration.
The relationship between interest rate and stock prices is moderate but negative in nature. It means that when rate of interest increase, the stock prices of stock exchange decrease, which confirmed the previous research studies, which wear conducted by different researchers. (Nishat and Shaheen 2007), (Asperm 1989) shows negative correlation between interest rate and stock prices.
Analysis among the independent variables suggests no such strong correlation amongst the independent variables as shown in table 10. All the variables show direct and indirect, positive and negative relationship whose consideration is not important.
REFERENCES
[1] Abbas Z. (2010). Dynamics of Exchange Rate and Stock Prices: A study on Emerging Asian Economics.
[2] Abdullah, D. w. (1993). Macro econometrics of stock prices fluctuation Quarterly journal of business and Economics, 49-63.
[3] Adjas, C. (2008) Effect of Exchange Rate Volatility on the Ghana Stock Exchange. 28-47.
[4] Agrawal D G (2010) A Study of Exchange Rates movement and Stock Market Volatility 62-73. Ahmed R, M .K .Real stock returns and inflation in Pakistan.
[5] Aisyah Abdul Rahman1, N. Z. (2009). Macroeconomic determinants of Malaysian Stock Market.
[image:6.595.62.296.157.375.2][7] E. E. et al. Real Macro Economic Variable and Stock Prices: Test of Proxy Hypothesis in Turkey.
[8] S. D. et al. (2009). Impact of Macroeconomics Variables on Stock Prices: Empirical Evidence in Case of KSE.
[9] S. N.et al. (2013). The Relationship between inflation and stock prices.
[10] Bhattacharya, M. J. The nature of the causal relationship between stock market and
[11] Macroeconomics aggregates in India: an empirical analysis. [12] Broun, SA Macroeconomic factors and the Japanese equity
market The CAPMD project.
[13] Cheah Lee Hen, Z. A. (2006). Causal relationship between stock price and macroeconomic variables in Malaysia. [14] Chen N R (1986) Economic forces and the stock market
Journal of business 59 583-403.
[15] Dimitrova, D. (2005). The Relationship between Exchange Rates and Stock Prices: Studiedina Multivariate Model. [16] Duca, G. (Autumn2007). The Relationship between the stock
Market and the Economy: Experience from International Financial Markets.12.
[17] Gaski, R. (1985). The fiscal and Monitory linkage between stock return and inflation. Journal of finance, 38, 7-33. [18] Kadir, H. B. (2011). Predictability Power of Interest Rate and
Exchange Rate Volatility on Stock Market Return and Volatility: Evidence from Bursa Malaysia. 4.
[19] Lutfur Rahman. (2008). Dynamic Relationship between Stock Prices and Exchange Rates: Evidence from Bangladesh. 52-57.
[20] LutfurRahman. (2009). Dynamic Relationship between Stock Prices and Exchange Rates: Evidence from Three South
Asian Countries. 167-174.
[21] M, A. A. (2007). Do macroeconomic variables play any role in the stock market movement in Ghana 12.
[22] Mansor H Ibrahim, W. S. (2001). Macroeconomic variables, exchange rate and stock price: a Malaysian perspective. [23] Mohammed Husain A, A. A. (2009). Impact of
Macroeconomics Variables on Stock Prices: Empirical Evidence in Case of KSE.
[24] Muhammad Akbar, S.A. (February, 2012). The relationship of stock prices and macroeconomic variables revisited: Evidence from Karachi stock exchange.
[25] Muhammad, N. Stock Prices and Exchange Rates: Are they related? Evidence from South Asian Countries.
[26] Mukherjee, T.a .Dynamic linkage between macroeconomic variables and the Japanese stock market. An application of a vector error correction model, 461-471.
[27] Nadeem Sohail, Z. H. (2009). Long-run and short-run relationship between macroeconomics variables and Stock process in Pakistan, The case of Lahore Stock Exchange. 183-198.
[28] Nadeem Sohail, Z. H. (2011). The Macroeconomic Variables and Stock Returns in Pakistan: The Scale of KSE-100 Index. 67-74.
[29] Stavarek, D. (2004). Linkages between stock Prices and Exchange Rates in the EU and the United States. 27. [30] Subair, K. Exchange Rate Volatility and the Stock Market:
The Nigerian Experience.14.
[31] T (2001), H. a. (2001). The stock market and the economy of Pakistan. The Pakistan development review, 40; 2,107-114. [32] Tangjitprom, N. (2012). Macroeconomic Factors of