Webometrics Ranking in the Context of Accessibility
of Higher Education
Margarita Bershadskaya
1, Yulia Voznesenskaya
2,*, Olga Karpenko
21Center for Development of Sociological Education, Research University-Higher School of Economics, Russia 2Modern University for the Humanities, Russia
Copyright©2016 by authors, all rights reserved. Authors agree that this article remains permanently open access under the terms of the Creative Commons Attribution License 4.0 International License
Abstract
The purpose of this study is a comparative assessment of the development of mass higher education in the regions and countries on the basis of the results of Webometrics. Main tasks: Comparison of national educational systems in terms of the scale of mass higher education; assessment of the quality of mass higher education; study of the growth of the network activity of Russian universities (2007-2014) in Federal districts. The methodology is based on the comparison of the number of universities in the country/region included in several thousands of best universities in the world (6 indicators: N2000, N3000, N4000, N5000, N10000, N20000). Evaluation of thequality of mass higher education is made on a conditional parameter - the share of ranked universities in the country/region included in top 5000 (N5000) in the total
number of ranked universities among 20000 (N20000).
Originality of research: new aspects of leadership of countries and regions in the Webometrics ranking, their quantitative expression. Among new facts – the leadership of China by the conditional indicator of quality of mass higher education.
Keywords
Accessibility, Webometrics, Mass Higher Education, Network Activity, World Rankings, Federal Districts of Russia1. Introduction
Inequality in access to education is one of the global problems of higher education. For developing countries, especially for Asian countries with a growing population and increasing demand for higher education, this issue is particularly relevant.
Among the fundamental research on the accessibility of higher education in the countries of the world are the works of Alex Usher and other Canadian researchers [1, 2] who provide a comparison of a number of national educational systems on the basis of quantitative indicators. However, the
number of countries considered by the authors is limited due to the lack of statistical data. The rough estimation of Russia's place in the global rankings, although it proved to be very labor-intensive, has led us to the important results of applied character [3]. Comprehensive information on mass higher education in the BRIC countries is given in the joint work of researchers from England, India, China and Russia [4] The data on the enrolment of young people in higher education programmes in these countries, the ratio of elite and mass higher education and the issues of quality of mass higher education are considered in detail.
In general, the problem of the global comparison of the world countries by accessibility and affordability of higher education, by the level of development of mass higher education remains open and requires the elaboration of simple and dynamic approaches to its solution.
In this context it seems important to analyze the results of Webometrics ranking of world universities – the only one of the global rankings of universities, stimulating the development of not only the elite but also of mass higher education.
However, publications devoted to the analysis of the Webometrics ranking mostly consider the reliability of ranking indicators [5-7] and the results of the individual countries and universities. Authors are limited to the selection of university- leaders, not taking the advantage to examine many thousands of universities for the characteristics of mass higher education. Being adherents of mass higher education, we carry out regular multidisciplinary analysis of the results of Webometrics ranking since 2007 and on the basis of summarizing of the analytical data have come to the possibility of obtaining evaluation indicators for comparison of higher education systems in terms of the development of mass higher education, taking into account the scale factor.
The purpose of this study is a comparative assessment of the development of mass higher education in the countries and regions of the world on the basis of the analysis of the results of Webometrics ranking.
we were focused on simplicity and dynamics of comparison taking into account the fact that the results of the comparative assessment may change with each next version of Webometrics ranking. So we are talking only about estimates indirectly characterizing the scale and quality of mass higher education without taking into account such important factors as the country's population, the share of enrolment of young people in higher education and others. The introduction of appropriate correction factors for a more rigorous quantitative assessment of the level of mass education is a subject of separate study that goes beyond the scope of this work.
2. Materials and Methods
2.1. Webometrics Ranking: Main Ideas, the Dynamics of Development
Four recognized global university rankings - the Shanghai Academic Ranking of World Universities [12], QS World University Rankings (Quacquarelli Symonds) [13], The Times Higher Education World University Ranking [14] and National Taiwan University Ranking [15] - are aimed at the selection of leading universities, thus stimulating the elite education in the world.
The main feature of Webometrics ranking [16] is wide coverage of universities - more than 20 thousand ranked universities compared to 200 - 800 in other rankings. It provides a unique opportunity to compare national systems of higher education not only by individual universities- leaders, but also by the entire set of universities that make up the system. Number of national universities in several thousands of the best universities in the world is becoming an important indicator of the magnitude of the higher education system in the country, its willingness to accept new technologies.
The ranking results including the position of universities by all indicators are published twice a year. Almost any University in the world gets the opportunity to constantly analyze its strengths and weaknesses and on the basis of such analysis not only regulate the web policy of the university, but also assess the competitiveness of its educational and research activities. Thereby the development of not only the elite, but also of mass higher education is stimulating, both in individual countries and globally.
Webometrics ranking has been held since 2004. Universities are evaluated by their presence in the Internet on the basis of the analysis of University Web sites. The main ideas, originally laid down by the authors of the ranking include the solution of such important problems as growth of online publications,
increased communication between scientists and teachers,
formation of new connections,
efficiency, and simplicity of information exchange.
At the same time, it should be emphasized that the indicators of Webometrics ranking evaluate not only the openness of information, but also the quality of scientific research. The methodology of the ranking is developing precisely in this direction in the last few years.
Currently more than 20 thousand world universities are being ranked. Such a scale of research was presented for the first time in January 2012.
The increase in the number of ranked universities from 12 to 20 thousand in January 2012 was accompanied by methodological failures, violation of the transparency of the results [17]. In July 2013 there were published the changes in the methodology of the ranking.
These methodological changes largely approximate the evaluation of scientific activities of the university to modern methods of bibliometrics considering on-line publications (in contrast to other recognized global rankings of universities).
2.1. Analysis of the Results of the Ranking: Objectives, Methodological Foundations
Analysis of the results of the ranking with thousands of university coverage is made in three main aspects: Comparison of national educational systems in terms of the scale of mass higher education; Assessment of the quality of mass higher education in the region/country; Study of the growth of the network activity of Russian universities (2007-2015).
Performing of each of these tasks contributes to a comparative assessment of the development of mass higher education in the regions and countries of the world.
Methodological framework for the comparative assessment of magnitude of mass higher education is based on a synthesis of the results of countries by the number of national universities included in several thousands of the best world universities.
Unlike most authors, considering the performance of the country in top 100, 200, 500, 1000 (N100, N200, N500, N1000),
and thereby characterizing the elite education in the country, we determine the number of national universities starting with 1000 best universities in the world and up to 20000. The comparison is made by 6 main indicators: N2000, N3000,
N4000, N5000, N10000, N20000. This is a new aspect of
leadership that we came in 2007 when we discovered that Russia entered the top ten countries in terms of N5000. With
the increase in selection of the best universities we can see among the leaders the developing countries from different regions. By the same performance indicators N2000, N3000,
N4000, N5000, N10000, N20000 we carried out an appropriate
assessment of magnitude of mass higher education in the regions (Asia, America, Africa and Europe).
000 (N20000): N5000/N20000. The observation of the drafters of
Webometrics ranking [16] made in January 2013, saying that even in the United States more than 2000 universities occupy places after the top 5000, has led the authors of this paper to the idea to use this index - N5000. The
development of mass higher education in Russia was estimated by indicators N3000, N5000, N20000 characterizing the network activity of Russian universities.
2.3. Finding Results
The number of ranked universities in each of the 6 rankings 2012-2015 was about 20 000. Of 215 countries considered in these rankings only 22 countries have more than 200 national universities among all ranked universities (top 23 800) and only 19 countries in the top 20000 - Fig. 1.
[image:3.595.322.545.79.275.2] [image:3.595.60.292.331.473.2]In January 2015 the number of ranked Chinese universities has more than doubled compared with the previous ranking of July 2014. In other countries a significant increase was noted only in Russia (over 37%) - Fig. 2.
Figure 1. Countries with a number of national universities more than 200 in the top 20 000: dark bars - economically developed countries; light bars - developing countries
Figure 2. The increase in the number of national universities in the top 20 000 (indicator N20000) for the period January 2014 - January 2015
2.4. Comparative Evaluation of the Development of Mass Higher Education in the World
Comparison of regions in terms of N20000 (Fig.1) shows
that 95, 6% in the top 20000 are in Asia, America and Europe, with the noticeable advantage of Asia (Fig.3a). For indicators N10000 and N5000 (Fig.3b) Asia is leading. In the
top 4000 and 3000 Asian leadership is also evident. In the top 2000 (indicator N2000) Asia and America noticeably lag
behind Europe.
As we can see (Fig.4) , the ratio of the number of Asian, American and European universities in the top 5000 to the number in the top 20000 of corresponding area varies in the range 25-27%: 25% (Asia), 27% (USA) and 26% (Europe).
a) b)
[image:3.595.148.457.518.691.2]Figure 4. The ratio of the number of Asian, American and European universities in the top 5000 to the number in the top 20000
2.5. Comparison of National Educational Systems in Terms of the Scale of Mass Higher Education
The results of the top 20 000 (comparison of countries in terms of N20000 - Fig. 1) is a clear evidence of the magnitude
of mass higher education in developing countries: 7 developing countries of Asia, Africa and America (China, India, Brazil, Mexico, Iran, Indonesia, Colombia) count total 7072 universities in the top 20 000 (more than 35% of N20000). The first five of these countries are in the top ten
countries in terms of N20000 and three of them are in the top
5.
Table 1 presents seven indicators for 19 countries with large-scale system of higher education (N20000 more than
200 countries). In each column of the table the top ten indicators are marked in gray. The countries in the top ten by all seven indicators are also grayed out. Of nineteen countries only four countries are not among the top ten by these indicators.
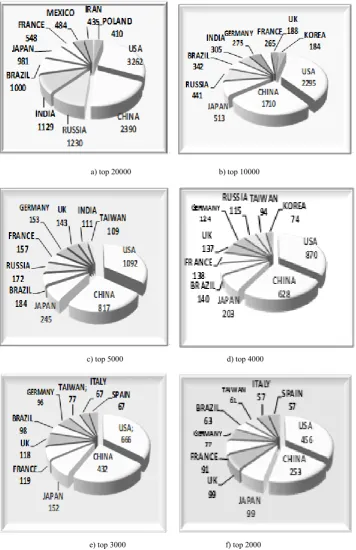
According to table 1 and fig. 5 we can see how the composition of ten leading countries in the number of national universities is changing depending on the sampling of the best world universities. Five countries – the United States, China, Japan, Brazil and France – are leaders by all major indicators. Two more countries - Germany, the United Kingdom - are among the top ten countries by five main indicators. Russia and Taiwan are leading by four indicators. Mexico, Iran and Poland are among the leading countries only by the number of ranked universities.
Fig. 5 shows the distribution of national universities of ten leading countries in each sample - top 20000 (N20000), top
10000 (N10000), top 5000 (N5000), top 4000 (N4000), top 3000
(N3000), top 2000 (N2000). As we can see the first three places
in all samples, except for the top 20000, belong to the United States, China and Japan. India, the fourth in the top 20000 is among the top ten in 10000 and top 5000 and then falls out from among the leaders. Russia and Brazil (the third and fifth places in the top 20000) have similar results in samples 10000 and 5000 Russia lags behind Brazil in the top 4000 and is not included in the 10 leading countries, starting with the top 3000. Brazil takes fourth place in the top 5000 and 4000, sixth place in the top 3000, seventh – in the top 2000. Germany, France, Great Britain is the seventh-ninth place in the top 10000, six to eight - in the top 5000, fifth to seventh - in the top 4000, fourth , fifth, seventh in the top 3000 and top 2000.
[image:4.595.312.552.340.650.2]The absolute leader in the magnitude of higher education (the first aspect of leadership) is the United States, occupying the first place in all six indicators far ahead of other countries. Second place takes China, third – Japan; France is on the fourth, followed by Brazil and Russia.
Table 1. Indicators of magnitude of mass higher education Country N20000 N10000 N5000 N4000 N3000 N2000
USA 3262 2295 1092 870 666 456 China 2390 1710 817 628 432 253 Russia 1230 441 172 115 61 26
India 1129 305 111 72 41 16 Brazil 1000 342 184 140 98 63 Japan 981 513 245 203 152 99 France 548 265 157 138 119 91 Mexico 474 97 55 39 30 20 Iran 435 147 85 68 43 21 Poland 410 163 74 67 53 27 Germany 405 275 153 124 96 77 Korea 375 184 94 74 64 43 Indonesia 309 142 72 55 41 16 Canada 309 153 79 61 60 49 UK 284 188 143 137 118 99 Taiwan 160 151 109 94 77 61 Ukraine 266 127 43 25 13 8 Columbia 225 99 50 32 22 13
a) top 20000 b) top 10000
c) top 5000 d) top 4000
[image:5.595.129.486.81.632.2]
e) top 3000 f) top 2000
Figure 5. The top ten countries by number of national universities in different samples of the best universities in the world.
2.6. Indicators of the Quality of Mass Higher Education
The use of the ratio of national universities in the top 5000 and top 20000 as a conditional indicator of the quality of mass universities leads to an unexpected result - the undoubted superiority of China in July 2014.
American universities, seemingly inaccessible by the results of all recognized rankings in all samples of the best
doubling of N20000. Among the countries with large-scale
systems of higher education China remains on top in January 2015 (dark bars in Fig.6), but in July 2015 is already noticeably inferior to the U.S. (Fig.7).
In January 2015 the first place among 19 countries by this index belongs to the UK -50%, Germany (second place) –38%, Spain (third place) and only on the fourth place is China at 35%. On the fourth – sixth place are the U.S. and Italy at 34%. Next are four countries (France, Canada, Korea, Japan,) with 25-29% which is no lower than the average level of the respective regions ranging, as shown above, from 25 to 27%. The following six countries presented in fig. 6, have scores from 16-23%, significantly below the average of the respective regions. And very low rates (from 10 to 14%) are in Russia, India, Mexico.
There is every reason to believe that China, which ranks second by all indicators of the magnitude (table 1, fig. 5) and the first place on the calculated quality score among the countries with the most large-scale systems, is a leader in the development of mass universities in the world countries.
As we saw earlier the index of the quality of mass higher education based on the ratio of the number of national universities in the top 5000 and top 20 000 was chosen conditionally. Choosing the top 5000 as the basis for determining the quality indicator is caused mainly by the accumulation of large amounts of data in this sample, which for several years was the maximum (see Fig. 1).Taking into account the conditionality of such choice we made comparison between similar parameters for different samples of the best universities in the world. In general, the comparison showed that the selected indicator based on the analysis of the top 5000 is suitable for comparing the quality of mass higher education in countries with different levels of development of educational systems. Indicators based on smaller samples are mainly suitable for advanced systems. For comparison of systems with low quality of mass higher education it is convenient to use an indicator based on the analysis of the top 10000.
Figure6. Share of N5000 in N20000 – a) July 2014, b) January 2015; dark bars– countries with large-scale systems (N20000 более 1000)
Figure7. Share of N5000 in N22000 (July 2015)
2.7. Analysis of the Results of Russian Universities in Webometrics
Transparency of information on developments in the educational and research activities of universities is of particular importance in view of the financial constraints associated with the economic crisis. The growth of online publications, increased communication between scientists and teachers, the formation of new relationships, efficiency and simplicity of information sharing - these are the basic ideas initially laid down in the Webometrics ranking (2004), have led to tangible results, which are recorded by us in the analysis of the dynamics of network activity of Russian universities.
We have been analyzing the results of Russian universities in "Webometrics" since July 2007.
We dare to hope that the publications of our research group have contributed to the popularity that the "Webometrics" has in Russia. After publication of each ranking, you can see on many university websites the discussion in identifying the strengths and weaknesses of the University that, ultimately, contributes to its development. 2.7.1. The growth of network activity
During the period under review (16 rankings: 2007-2015) there was a positive dynamics of development of Russian universities.
Only five of nineteen countries have increased the indicator N20000 compared with January 2012 ranking, when
the number of ranked universities in the world for the first time reached 20000. The greatest increase in network activity is in China (over 100%) - Fig. 8
50%
38% 35% 34% 34% 34%
29% 26% 25% 25%23% 22%
19,5%18% 18% 16%
Figure8. The increase in the number of national universities in the top 20 000: January 2012 - January 2015
Fig. 8 shows the change in indicators N5000 in 16 rankings 2007-2015. In general, the dynamics is positive, despite the fluctuations in the values from ranking to ranking – fig.9. The best results are of three rankings: January 2012, July 2012 and January 2013. It should be noted, that none of the countries traditionally included in the top ten in the top 5000, has such a significant improvement of the position as Russia, which in January 2012 for the first time ranked fourth compared to the seventh-tenth places in the rankings of previous years (2007 - 2010) [6]. In four of the six subsequent rankings, including July 2014, Russia has maintained its fourth place; in July 2013, January 2014 и January 2015 - took the sixth place - see fig.5.
Figure 9. Change in the number of Russian universities in 16 rankings (July 2007 – January 2015) - indicators N5000
2.7.2. Federal Districts of Russia in the world educational space
As in previous rankings (2007-2015), universities of different regions of the country (federal districts) are among the best universities of Russia.
[image:7.595.318.550.151.293.2]In the July 2014 ranking, starting with the sample of top 4000, the universities of all seven Federal districts are among the world best universities (Fig.10). In several previous rankings representation of all districts started with the top 3000.
Figure 10. Distribution of Russian universities by federal districts in the sample of top 4000 world universities
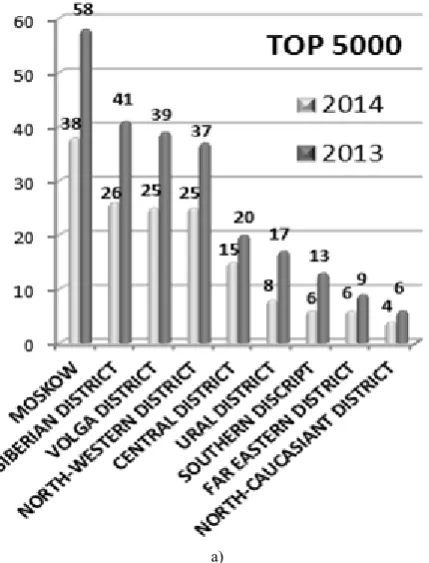
Analysis of the dynamics of changes in the positions of Russia, with regard to the distribution of the best Russian universities by federal districts shows the contribution of each of the eight federal districts of the Russian Federation into the deterioration or improvement of the overall result. So, a sharp deterioration in the position of Russia, compared with the record results of January 2013 ranking, is due to a significant worsening of the results in each district – Fig. 11.
[image:7.595.323.538.438.720.2] [image:7.595.61.295.447.623.2]b)
[image:8.595.68.282.77.662.2]c)
Figure 11. Number of universities in the federal districts of the Russian Federation among the best world universities in the rankings January -2013 and January -2014 (a – top 5000, b – top 4000, c – top 5000)
Thus, in accordance with the data presented, the promotion of Russia in the Webometrics ranking requires the development of universities from all regions of Russia.
3. Conclusions
A simple and dynamic methodology of comparing countries and regions on the magnitude and quality of mass higher education allows us to trace the dynamics of changes from ranking to ranking. The accumulation of estimates will later continue to develop more accurate indicators of the level of development of mass education in the country (region), taking into account the population size and the enrollment of young people in higher education .
However, even now ,without the introduction of appropriate correction coefficients, the generalization of the results of Webometrics ranking leads to interesting conclusions of direct relevance to the problems of mass education.
Estimates of the magnitude of mass higher education systems adopted for this study include only those universities that are among the best universities in the world. This means that each indicator, in contrast to the educational data statistics, includes qualitative aspect, which naturally increases with decreasing sample of top universities. The USA conceding by the number of students of India and China is in the lead by these indicators
At the same time, the use of the ratio of national universities in the top 5000 and top 20000 (the ratio of N5000
to N20000) as a conditional indicator of the quality of mass
universities leads to an unexpected result - the undoubted superiority of China in 2014. The changing of the position of China in 2015 (decrease of N5000 / N20000, – due to doubling
the number of Chinese universities among the top 20,000 universities in the world) – is a clear evidence of the conditionality of a quality indicator N5000 / N20000, because
the increase of N20000 itself is an important feature of improving the quality of mass universities.
Assessment of the development of mass education in the regions showed:
the leadership of Asia by number of universities among the world's best universities in samples from 3000 to 5000. In top 2000 the leader is Europe far ahead of Asia and America;
similar indicators of quality of mass universities - from 25% to 27% (America - 27%, Asia - 25%, Europe -26%).
Leading countries in terms of the scale of mass higher education:
The United States, China, Japan, Brazil and France (by all major indicators);
Germany, United Kingdom (by five major indicators);
Russia (by four indicators)
In assessing the position of Russia it must be kept in mind that this is one of the few countries where all universities are among the top 20000 world universities. Naturally, only a small part of them is in the top 5000.
It should be emphasized that the regular analysis of the results of Webometrics ranking provides important conclusions about the quantity and quality of mass universities in the regions and world countries and draws much attention to the regulation of national education policy.
REFERENCES
[1] Usher A.& Cervenan A.Global Higher Education Rankings: Affordability and Accessibility in Comparative Perspective. Toronto: The Educational Policy Institute, 2005.
[2] Usher A. & Medow J. Global Higher Education Rankings 2010: Affordability and Accessibility in Comparative Perspective. Toronto: Higher Education Strategy Associates, 2010.
[3] Karpenko O. & Bershadskaya M. Accessibility of higher education: socio-economic aspect. Poster presented at the International Conference How do educational systems shape educational inequalities? Luxembourg: University of Luxembourg, 2014.
[4] Carnoy M., Loyalka P., Dobyakova M., Dossani R., Froumin I., Kuhns K., Tilak J., Wang R. University Expansion in a Global Economy: Triumph of the BRICs? Stanford: Stanford University Press, 2013.
[5] Aguillo I. F., Bar-Ilan J., Levene M. & Ortega J. L. Comparing university rankings. Scientometrics, 2010, Vol. 85, 243-256.
[6] Aguillo I. F. Webometrics ranking of world universities. Introduction, methodology and future development. Higher Education in Europe, 2008
[7] Artyushina I. & Shutilin V. (2009). Reitingi vuzov v Rossii i v mire.Vyssheye obrazovaniye v Rossii. 2009 No 2, 15-18. [8] Karpenko O. & Bershadskaya M. Analysis of the results of
the international assessment of the content of university sites and its impact on the university web activity. The third international Evidence Informed Policy and Practice in
Education in Europe (EIPPEE) Conference. Oslo: Norwegian Knowledge Center for Education. 2014, P.15-16.
[9] Karpenko O. & Bershadskaya M. Webometrics ranking: the dynamics of network activity of world universities. ESA 11th Conference: Crisis, Critique and Change. Abstract Book. Torino, 2013, P.488.
[10] Karpenko O., Bershadskaya M., Voznesenskaya Y. Openness and accessibility of information of the university: the results of the international ranking of the universities’ internet- sites. Proceedings of the 11th international workshop on computer science and information technologies CSIT’2009, Crete, Greece,2009, Vol.1, P.220- 223
[11] Karpenko O., Bershadskaya M., Voznesenskaya Y. Russian Higher Education Institutions in the Webometrics Ranking of World Universities (WR). European Society or European Societies: a View from Russia. / Ed. by V.A. Mansurov. Moscow-Lisbon, 2009, P.163-166.
[12] Academic Ranking of World Universities (ARWU) http://www.arwu.org/
[13] The Times Higher Education World University Ranking http://www.timeshighereducation.co.uk/world-university-ran kings
[14] QS World University Rankings http://www.topuniversities.c om/qs-world-university-rankinпs
[15] NTU http://nturanking.lis.ntu.edu.tw/ [16] WEB http://www.webometrics.info/
[17] Bershadskaya M. Rossiya v reitinge “Webometrics”: dinamika setevoi aktivnosti rossiyskih vuzov (2007-2013). IV Vserossiyskiy sociologicheskiy congress. Ufa. 2013, P.5833- 5843.
[18] Olga Karpenko, Margarita Bershadskaya, Yulia Voznesenskaya. Webometrics ranking of world universities in the context of accessibility of higher education. // Paper presented at the 3-rd International Conference ELLTA 2014: Leadership and Learning in the Asian Century –17 -19 November 2014, University Sains Malaysia. - Penang, Malaysia, 2014. P.98.
[19] Olga Karpenko, Margarita Bershadskaya, Yulia