MEASURING HUMAN PERFORMANCE OF MALAYSIAN TRAIN DRIVERS:
A FACTOR ANALYSIS
Jalil Azlis-Sani1,2, Siti Zawiah Md Dawal2, Norhayati Mohmad Zakwan3 and Mohd Faizal Mohideen Batcha1
1Faculty of Mechanical & Manufacturing Engineering,
Universiti Tun Hussein Onn Malaysia (UTHM) 86400 Batu Pahat, Johor, MALAYSIA Corresponding author’s e-mail: [email protected]
2
Centre for Product Design & Manufacturing (CPDM), Faculty of Engineering, University of Malaya
Lembah Pantai, Kuala Lumpur, MALAYSIA
3
Faculty of Management and Human Resource Development, Universiti Teknologi Malaysia,
Skudai, Johor, MALAYSIA
Abstract: Performance of workers is an important factor for a designer or engineer in designing or improving related equipment, interface, job or system as a whole. Understanding human performance during design stage may reduce potential errors and improve safety aspects as well as effectiveness. Therefore, a study was done to identify factors in measuring human performance of train drivers. A self-administered survey, which was completed by the locomotive drivers and junior drivers, was conducted among train drivers from a local train operating company (TOC) in Malaysia. The survey was conducted in five railway depots across Peninsular Malaysia, namely Perai, Ipoh, Kuala Lumpur, Gemas and Kuala Lipis. A total of 229 responses were returned. Factor analysis technique was used for data reduction and to examine the relationship among variables. Step-by-step procedure of factor analysis was conducted to determine the number of factor solution appropriate for evaluating human performance. The final analysis result using Kaiser-Meyer-Olkin (KMO), which measured the sampling adequacy, was found to be 0.829 with 47.8% total variance. All 36 items had loading more than 0.4 and were loaded on five-factor solution without redundancy. The five-factor solution was the best proposed result upon item deletion and was measured with item loading as KMO value and eigenvalue were used as comparison.
1. INTRODUCTION
1.1 Importance of Human Performance in Railway Industry
Performance of workers is an important factor for a designer or engineer in designing or improving related equipment, interface, job or system as a whole. In railway, error-free system is critical to ensure the system safety. Circumstances from any train-related accident will involve high cost and cause devastation. Railway safety however is not bound to the train itself, but it has many facets including passengers, track staffs, control room staffs, and other staffs. Train drivers are one of the important stakeholders in ensuring safety of passengers, the train, and the system (Wilson, 2006; Wilson & Norris, 2005). Ladbroke Grove accident in 5th October 1999 was disastrous involving 400 injuries and 31 casualties. It was reported that accident was caused by human error, in particular was due to signal passed at danger (SPAD). The price to be paid due to the accident was too high (Stanton & Walker, 2011). Among other industries, rail ergonomics has become a forgotten branch of transport ergonomics as after so many years, rail business still evolves rather slowly compared to others (Wilson & Norris, 2005). However, the level of awareness on the importance of human factors in the railway is increasing and such awareness is very crucial in order to improve system reliability and human performance as well as safety (Clarke, 2005).
2. FACTORS AFFECTING HUMAN PERFORMANCE
2.1 Occupational Stress
Stress in psychological point of view is a descriptive term to describe the feeling of pressure and strain. This term also applies in biological sciences, including stress on physiological or biological nature. The body responds to stressors such as extreme environments, temperature, noise, diseases, sleepiness as well as emotions (Bourne, 2003).
Occupational stress or job stress describes stress caused by working and job environment. Workers feel the pressure and strain due to environmental factors thus leading to occupational stress to the workers. Poor job design, layout setting, and high workload are highly potential stressors (Jou, Kuo, & Tang, 2013). These stressors contribute to the increasing level of stress among workers when they interact with the work environment when conducting their job tasks. Interaction between these two elements (worker-work environment) requires proper planning. Therefore, job design is used to identify the suitable conditions for the workers to work in the best condition and environment (Genaidy, Salem, Karwowski, Paez, & Tuncel, 2007). The worker-work environment interaction is critical, not excluding in the transportation industry.
Strahan, Watson, and Lennonb (2008) study the relationship between safety climate, occupational stress and work-related driver fatigue. The study was initiated because work-related accidents are the leading cause of work-related injury and casualties in many countries. Work-related accidents also cost billions of dollars to the business and bring bad impacts to the community. The study report that fatigue-related behaviour is predicted through occupational stress measures. This significant predictor could early inform the organisation or company about the possibility of fatigue-related behaviour and risks. Then, the organisation is responsible to understand the factors affecting occupational stress among their workers and to take necessary action to reduce the level of stress among the workers (Bourne, 2003). Based on the review of the literature review above, the author hypothesises that:
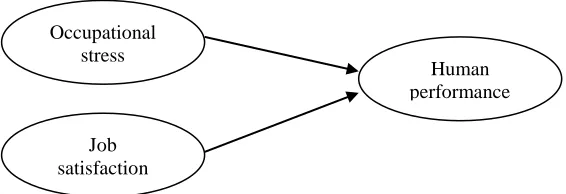
H1 Occupational stress has a direct positive effect on the performance of train drivers in Malaysia
2.2 Job Satisfaction
Job satisfaction is a feeling by an employee towards his job, work environments, and other factors affecting the job such as salary, motivation, and working hours (Jou et al., 2013). Improved working environment will increase the level of job satisfaction. Increased level of job satisfaction then leads to better human performance. Juslén and Tenner (2005) find that human performance increases with the improvement of the lighting in the work station and office. At the same time, job satisfaction increases with age. Older employees have ability to adapt with the working environment and adjust it with their expectations to satisfy themselves (Dawal, Taha, & Ismail, 2009). By being satisfied with their job, it will reduce the tendency among the employees to quit their job. Job satisfaction can be achieved by avoiding office conflicts and improving physical work environment (Jou et al., 2013).
Job satisfaction and perception towards job and working environment have now shifted to a new paradigm. Job satisfaction is one of the important constructs in measuring performance of employees. Previous theories and approaches indicate that job satisfaction is a basic need of employees, but now job satisfaction is a requirement for the organisational performance as a whole (Genaidy et al., 2007). Therefore, it is important for the organisation to understand the factors motivating the employees and how they are motivated. Based on the literature review above, the author hypothesises that:
H2 Job satisfaction has a direct positive effect on the performance of train drivers in Malaysia
2.3 Research Model
Occupational stress
Job satisfaction
[image:2.612.140.423.593.690.2]3. DETERMINING FACTORS
3.1 Research Method
A self-administered survey, which was completed by the locomotive drivers and junior drivers, was conducted among train drivers from a local train operating company (TOC) in Malaysia. The survey was conducted in five railway depots across Peninsular Malaysia, namely Perai, Ipoh, Kuala Lumpur, Gemas and Kuala Lipis. Off-duty respondents from the depots were picked randomly. Upon receiving the questionnaire, they filled it immediately. Researcher was present at the survey location to provide assistance. A total of 229 responses were returned.
3.2 Survey Instrument
An adapted questionnaire using 5-point Likert scale was used to collect the data for each of the constructs from the respondents. The questionnaire was adapted from previous literatures namely Ryan, Wilson, Sharples, Morrisroe, and Clarke (2009), Strahan et al. (2008), (Johns, 1991, 1992, 1993), Johns and Hoaking (1997), and Gradisar et al. (2007).
3.3 Factor Analysis
Factor analysis technique was used for data reduction and to examine the relationship among variables (Russell, 2002). From this technique, smaller number of variables explained the maximum amount of common variance and it was called parsimony (Tinsley & Tinsley, 1987). Principal components analysis with Promax rotation (Russell, 2002) was used to reduce a large number of items in driver performance measures to smaller number of reliable factors (Glendon & Litherland, 2001; Lu & Shang, 2005), which consisted of two (2) possible constructs as planned in the research model, namely occupational stress and job satisfaction. So, principal components analysis was performed on the data collected in the 43-item questionnaire from 229 respondents.
Initially, principal components analysis with Promax rotation was performed without fixing the number of factors. Kaiser-Meyer-Olkin (KMO) measures of sampling adequacy value of 0.853 (Hair, Black, Babin, & Anderson, 2010) indicated the data deemed to be appropriate for the analysis. This analysis suggested eleven-factor solution with 62.9% of the variance. From scree plot as shown in Figure 2 (Cattell (1966) as mentioned by Reise, et al. (2000)), the results showed an eleven-factor solution with eigenvalue greater than 1.0 and the total variance explained was 62.9% of the total variance. To determine the number of factors, parallel analysis (Reise et al., 2000) as shown in Table 1 was conducted by comparing eigenvalues from actual data and simulated data. This procedure was better than scree plot alone to determine the number of factors (Russell, 2002). Simulated data were generated using Monte Carlo simulation.
Table 1. Parallel analysis
Factor Actual data Simulated Decision
Eigenvalue % of Variance Cumulative % Eigenvalue
1 9.804 22.801 22.801 1.9447 Accepted
2 3.457 8.039 30.840 1.8434 Accepted
3 2.498 5.809 36.649 1.7608 Accepted
4 2.264 5.265 41.914 1.6893 Accepted
5 1.679 3.905 45.819 1.6247 Accepted
6 1.515 3.523 49.342 1.5682
7 1.391 3.235 52.577 1.5134
8 1.173 2.727 55.304 1.4619
9 1.128 2.624 57.928 1.4172
10 1.107 2.574 60.502 1.3722
11 1.038 2.414 62.916 1.3304
12 .968 1.2907
13 .958 1.2517
14 .872 1.2106
Eigenvalues of actual and simulated data were compared. Factors were accepted if the eigenvalues of the actual data were more than the simulated data. As shown in Table 2 and Figure 3, five factors of the actual data showed higher eigenvalues than the simulated data. However, this suggested solution was problematic to be interpreted because five items had loading less than 0.4 (Hair et al., 2010) and one item (JRT10) was loaded on two factors with the differences less than 0.1 (Snell and Dean, 1992). The items deleted from further analysis were STR20, STR7, STR6, JRT6, STR17, and JRT10.
Figure 2. Scree plot Figure 3. Comparison of actual and simulated data
[image:4.612.81.525.426.733.2]A consequent analysis of 37 remaining items with six deleted item indicated KMO value of 0.838 and eleven-factor solution with 66.4% total variance. One item (STR15) was loaded less than 0.4. Comparison of eigenvalues between actual and simulated data generated using Monte Carlo simulation still indicated five-factor solution.
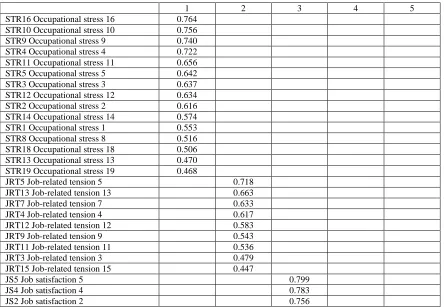
Table 2. Five-factor solution
1 2 3 4 5
STR16 Occupational stress 16 0.764 STR10 Occupational stress 10 0.756 STR9 Occupational stress 9 0.740 STR4 Occupational stress 4 0.722 STR11 Occupational stress 11 0.656 STR5 Occupational stress 5 0.642 STR3 Occupational stress 3 0.637 STR12 Occupational stress 12 0.634 STR2 Occupational stress 2 0.616 STR14 Occupational stress 14 0.574 STR1 Occupational stress 1 0.553 STR8 Occupational stress 8 0.516 STR18 Occupational stress 18 0.506 STR13 Occupational stress 13 0.470 STR19 Occupational stress 19 0.468
JRT5 Job-related tension 5 0.718
JRT13 Job-related tension 13 0.663
JRT7 Job-related tension 7 0.633
JRT4 Job-related tension 4 0.617
JRT12 Job-related tension 12 0.583
JRT9 Job-related tension 9 0.543
JRT11 Job-related tension 11 0.536
JRT3 Job-related tension 3 0.479
JRT15 Job-related tension 15 0.447
JS5 Job satisfaction 5 0.799
0 2 4 6 8 10 12
1 3 5 7 9 11 13 15 17 19
JS1 Job satisfaction 1 0.711
JS3 Job satisfaction 3 0.618
JS6 Job satisfaction 6 0.860
JS7 Job satisfaction 7 0.835
JS8 Job satisfaction 8 0.792
JRT2 Job-related tension 2 0.753
JRT1 Job-related tension 1 0.544
JRT8 Job-related tension 8 0.417
JRT14 Job-related tension 14 0.410
The third analysis was conducted with 36 items (with one item, STR15 deleted) and limited to five-factor solution as depicted in Table 2. Kaiser-Meyer-Olkin (KMO) measures of sampling adequacy were 0.829 with 47.8% total variance. All the 36 items had loading of more than 0.4 (Hair et al., 2010) and were loaded on five-factor solution without redundancy.
4. CONCLUSION
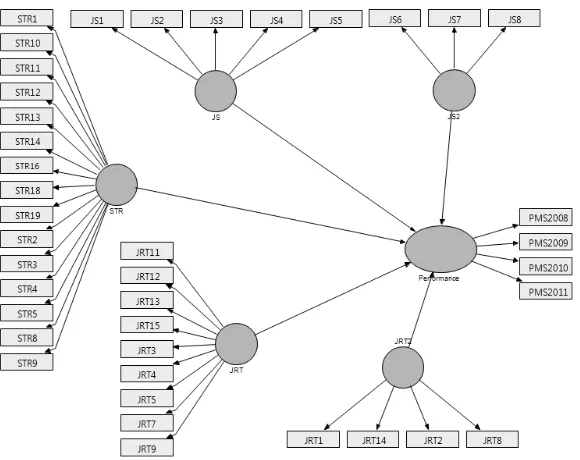
[image:5.612.163.453.368.598.2]The main objective of this paper is to empirically identify the number of factors that will be used to measure human performance of train drivers. Results from the factor analysis suggested the number of factors to be used in evaluating human performance of the Malaysian train drivers. Instead of two factors as proposed in the research model, namely occupational stress and job satisfaction, factor analysis technique suggested five-factor solution for better interpretation of human performance. From the occupational stress variables, three variables namely occupational stress, job-related tension (internal conflicts), and job-related tension (external conflicts) were developed, while job satisfaction was divided into two variables namely job satisfaction 1 and job satisfaction 2.
Figure 4. Human performance model of train drivers
5. REFERENCES
1. Bourne, L. a. Y., RA (2003). Stress and cognition: A cognitive psychological perspective Final Report National Aeronautics and Space Administration Grant Number NAG2-1561.
2. Clarke, T. (2005). The Ergonomics Programme at Network Rail. In J. R. Wilson, B. Norris, T. Clarke & A. Mills (Eds.), Rail Human Factors: Supporting the Integrated Railway (pp. 19 - 21): Ashgate.
3. Dawal, S. Z., Taha, Z., & Ismail, Z. (2009). Effect of job organisation on job satisfaction among shop floor employees in automotive industries in Malaysia. International Journal of Industrial Ergonomics, 39(1), 1-6.
4. Genaidy, A., Salem, S., Karwowski, W., Paez, O., & Tuncel, S. (2007). The work compatibility improvement framework: An integrated perspective of the human-at-work system. Ergonomics, 50(1), 3-25.
5. Glendon, A. I., & Litherland, D. K. (2001). Safety climate factors, group differences and safety behaviour in road construction. [doi: DOI: 10.1016/S0925-7535(01)00006-6]. Safety Science, 39(3), 157-188.
6. Gradisar, M., Leon Lack, Hayley Richards, Jodie Harris, Julie Gallasch, Michelle Boundy, & Anna Johnston. (2007). The Flinders Fatigue Scale: Preliminary Psychometric Properties and Clinical Sensitivity of a New Scale for Measuring Daytime Fatigue associated with Insomnia. Journal of Clinical Sleep Medicine, 3(7), 722-728.
7. Hair, J. F., Black, W. C., Babin, B. J., & Anderson, R. E. (2010). Multivariate Data Analysis (7th ed.): Prentice Hall.
Johns, M. W. (1991). A New Method for Measuring Daytime Sleepiness: The Epworth Sleepiness Scale. Sleep, 14(6), 540-545.
8. Johns, M. W. (1992). Reliability and Factor Analysis of the Epworth Sleepiness Scale. Sleep, 15(4), 376-381.
9. Johns, M. W. (1993). Daytime Sleepiness, Snoring and Obstructive Sleep Apnea: The Epworth Sleepiness Scale. Chest, 103, 30-36.
10. Johns, M. W., & Hoaking, B. (1997). Excessive Daytime Sleepiness: Daytime Sleepiness and Sleep Habits of Australian Workers.
Sleep, 20(10), 844-849.
11. Jou, R.-C., Kuo, C.-W., & Tang, M.-L. (2013). A study of job stress and turnover tendency among air traffic controllers: The mediating effects of job satisfaction. Transportation Research Part E: Logistics and Transportation Review(0).
doi: http://dx.doi.org/10.1016/j.tre.2013.01.009
12. Juslén, H., & Tenner, A. (2005). Mechanisms involved in enhancing human performance by changing the lighting in the industrial workplace. International Journal of Industrial Ergonomics, 35(9), 843-855. doi: 10.1016/j.ergon.2005.03.002
13. Lu, C.-S., & Shang, K.-c. (2005). An empirical investigation of safety climate in container terminal operators. [doi: DOI: 10.1016/j.jsr.2005.05.002]. Journal of Safety Research, 36(3), 297-308.
14. Reise, S. P., Waller, N. G., & Comrey, A. L. (2000). Factor analysis and scale revision. Psychol Assess, 12(3), 287-297.
15. Russell, D. W. (2002). In Search of Underlying Dimensions: The Use (and Abuse) of Factor Analysis in Personality and Social Psychology Bulletin. Personality and Social Psychology Bulletin, 28(12), 1629-1646. doi: 10.1177/014616702237645
16. Ryan, B., Wilson, J. R., Sharples, S., Morrisroe, G., & Clarke, T. (2009). Developing a Rail Ergonomics Questionnaire (REQUEST).
Applied Ergonomics, 40(2), 216-229.
17. Shahrokhi, M., & Bernard, A. (2009). A framework to develop an analysis agent for evaluating human performance in manufacturing systems. CIRP Journal of Manufacturing Science and Technology, 2(1), 55-60.
18. Stanton, N. A., & Walker, G. H. (2011). Exploring the psychological factors involved in the Ladbroke Grove rail accident. [doi: DOI: 10.1016/j.aap.2010.12.020]. Accident Analysis & Prevention, 43(3), 1117-1127.
21. Wickens, C. D., Lee, J. D., Liu, Y., & Becker, S. E. G. (2004). An Introduction To Human Factors Engineering (2nd Edition ed.): Pearson - Prentice Hall.
22. Wilson, J. R. (2006). Interaction with virtual environments. International Journal of Human-Computer Studies, 64(3), 157-157.