Journal of Chemical and Pharmaceutical Research, 2012, 4(1):901-912
Research Article
CODEN(USA) : JCPRC5
ISSN : 0975-7384
901
Solvent Effect on the Stability Constants of Charge Transfer Complexes of
Iodine and Certain Ethers at 303 K
S. J. Askar Ali
1*, P. A. Abdullah Mahaboob
2and M. NizamMohideen
21
PG and Research Department of Chemistry, The New College, Chennai, India
2Department of Physics, The New College, Chennai, India
___________________________________________________________________________________________
ABSTRACT
Ultrasonic velocity (U), density (ρ), and coefficient of viscosity (η) values are measured for solutions containing iodine and one of the following ethers in equimolar concentration in the range 0.001 - 0.01M at 303 K. Diphenyl ether, 4-chloroanisole, anisole and 1,4-dioxane are used as donors. Dichloromethane, chloroform, carbon tetrachloride and n-hexane have been used as solvents. Acoustical parameters such as adiabatic compressibility (β), absorption coefficient (α/f2), internal pressure (πi) and cohesive energy (CE) values are calculated from the values
of u, ρ and η. The trend in the acoustical parameters establishes the formation of charge transfer complexes between iodine (acceptor) and ethers (donors). The formation constants (K) are calculated for these complexes. The free energy of formation of these complexes (∆G) are also reported. Attempt has been made to correlate the formation constants with polarizability (α), dielectric strength (ε) and dipole moment (µ) of the donor and solvent molecules. The free energy of activation (∆G#) and viscous relaxation time (ד) are found to be almost constant for these complexes indicating the formation of similar charge transfer complexes in these systems.
Keywords: Solvent effect, formation constants, donor-acceptor complexes, iodine, ethers, ultrasonic method. ________________________________________________________________________________________
INTRODUCTION
Ultrasonic velocity measurements have been successfully employed to detect and assess weak and strong molecular interactions, in binary [1-5] and ternary [6-11] liquid mixtures. These studies can also be used to detect complexation and for the evaluation of stability constants of complexes [12-14], in particular the charge transfer complexes formed between organic compounds containing electron rich centers and electron deficient compounds. Ethers are Lewis bases as they contain electron rich ethereal oxygen and thus they can function as donors. Among halogens, iodine has basic character and it can function as electron acceptor. It forms charge transfer complexes with electron donors [15]. In the present work, charge transfer complexes are detected between iodine and ethers in four different solvents by ultrasonic method and the stability constants of these complexes are calculated using modified Bhat equation [16]. In this paper, we report the results obtained in the ultrasonic study of molecular interaction between iodine and four ethers namely, diphenyl ether, 4-chloroanisole, anisole and 1,4-dioxane in dichloromethane, chloroform, carbon tetrachloride and n-hexane at 303K.
_____________________________________________________________________________
902
EXPERIMENTAL SECTION
Materials
Iodine (Merck-GR) was purified by sublimation. The solvents dichlromethane (bp 313 K), chloroform (bp 335 K), carbon tetrachloride (bp 350 K) and n-hexane (bp 341 K), are distilled before use. The four ethers diphenyl ether, 4-chloroanisole, anisole and 1,4-dioxane used as donors are of AnalaR grade (SDS). Accurately weighed amounts of donors and acceptor were dissolved in suitable solvent to obtain solution in the concentration range 1x10⁻³ - 1x10⁻² M.
Methods
Ultrasonic velocity measurements were performed with ultrasonic interferometer (Model F81) supplied by ‘Mittal Enterprises, New Delhi’ operating at a frequency of 2 MHz. It has an accuracy of ± 0.1 ms-1. Viscosities of pure compounds and their mixtures were determined using Oswald’s viscometer calibrated with double distilled water. The densities of pure compounds and their solutions were measured accurately using specific gravity bottles with accuracy of 0.001 kg/m3. The temperature is maintained constant at 303 K with a precision of ± 0.1K with a thermostat. The ternary liquid mixtures containing n-hexane, equimolar concentration of donor and acceptor are thermostated at 303 K for 30 minutes before measuring ultrasonic velocity to attain equilibrium. Acoustical parameters such as adiabatic compressibility (β), absorption coefficient (α/f2), free length (Lf), internal pressure (πi),
cohesive energy (CE), relaxation time (ד), stability constant (K) and the thermodynamic parameter free energy change (∆G) for the complexation and free energy of activation (∆G#) were calculated using standard equations [15-20].
RESULTS AND DISCUSSION
The measured ultrasonic velocities, densities and viscosities at various equimolar concentrations of diphenyl ether, 4-chloroanisole, anisole and 1,4-dioxane with iodine in dichloromethane, chloroform, carbon tetrachloride and n-hexane at 303 K are given in Tables 1–3. The plots of ultrasonic velocity vs concentration of four ethers in four different solvents are presented in Figs.1-4. From the plots it is seen that the ultrasonic velocities vary non-linearly with concentration for all the sixteen systems. At a characteristic concentration, the ultrasound velocity of solution is less than that of ideal mixing indicating the formation of charge transfer complex between the donor and acceptor. The ultrasonic velocity is minimum at characteristic concentration indicating that the extent of complexation is maximum at this concentration. This concentration depends on the system. There is decrease in density (Table 2) at a specific concentration (3x10⁻³ - 6x10⁻³M) and this also suggests that the complexation is concentration dependant. This is also supported by the trend in the viscosity values (Table 3).
The adiabatic compressibility is a measure of intermolecular association between the donor and acceptor. The plots of adiabatic compressibility vs concentration of four ethers are given in Figs.5–8. From these plots, it is evident that there is considerable variation in adiabatic compressibility values in the concentration range 3x10⁻³ – 9x10⁻³ M indicating that the complex formation is significant in this concentration range.
The calculated absorption coefficient (α/f2), internal pressure (πi) and cohesive energy (CE) for all the above systems
are given in Tables [4-6]. The absorption coefficient (α/f2) generally increases with increase in concentration and this trend suggest that the extent of complexation increases with increase in concentration.
The internal pressure (πi) is a measure of cohesive forces between the constituent molecules in liquids. In order to
assess the cohesive forces in the ternary liquids investigated; ‘πi’ values are calculated for all the systems (Table 5).
It is found that the internal pressure in ternary solution is generally greater than that of pure solvent which shows that the intermolecular attractive forces between the molecules of components are strong in solution. Further, the internal pressure for a given system increases with increase in concentration which suggests that there is an increase in the extent of complexation with increase in concentration.
903
4-chloroanisole
≈
anisole > 1,4-dioxane. During complexation between ether and iodine, ethereal oxygen being electron rich donates electron which is attracted by positive end of iodine molecule. Diphenyl ether contains electron releasing phenyl groups on either side of the donor atom and similarly in 4-chloroanisole, chlorine atom in the para position to methoxy group releases electron by mesomeric effect. But in anisole molecule the resonance effect is limited although methoxy group is directly attached to a phenyl ring. In dioxane molecule, absence of mesomeric effect is the reason for the least stability constant value.
From the stability constants obtained for the above systems, the free energy of formation (∆G) are calculated at 303 K and they are given in Table 7. For all the systems, ∆G values are negative indicating that the charge transfer complexes are thermodynamically stable. The free energy of activation (∆G#) and relaxation time (ד) are intrinsic properties of a charge transfer complex. Since similar complexes are formed in the four systems these two properties are almost constant.
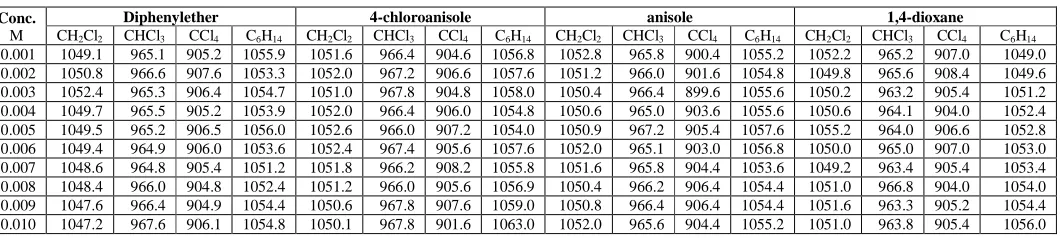
Table 1. ULTRASONIC VELOCITY (ms-1) VALUES OF IODINE - ETHER SYSTEMS IN DIFFERENT SOLVENTS AT 303 K
Conc. M
Diphenylether 4-chloroanisole anisole 1,4-dioxane
CH2Cl2 CHCl3 CCl4 C6H14 CH2Cl2 CHCl3 CCl4 C6H14 CH2Cl2 CHCl3 CCl4 C6H14 CH2Cl2 CHCl3 CCl4 C6H14
[image:3.595.37.567.257.376.2]0.001 1049.1 965.1 905.2 1055.9 1051.6 966.4 904.6 1056.8 1052.8 965.8 900.4 1055.2 1052.2 965.2 907.0 1049.0 0.002 1050.8 966.6 907.6 1053.3 1052.0 967.2 906.6 1057.6 1051.2 966.0 901.6 1054.8 1049.8 965.6 908.4 1049.6 0.003 1052.4 965.3 906.4 1054.7 1051.0 967.8 904.8 1058.0 1050.4 966.4 899.6 1055.6 1050.2 963.2 905.4 1051.2 0.004 1049.7 965.5 905.2 1053.9 1052.0 966.4 906.0 1054.8 1050.6 965.0 903.6 1055.6 1050.6 964.1 904.0 1052.4 0.005 1049.5 965.2 906.5 1056.0 1052.6 966.0 907.2 1054.0 1050.9 967.2 905.4 1057.6 1055.2 964.0 906.6 1052.8 0.006 1049.4 964.9 906.0 1053.6 1052.4 967.4 905.6 1057.6 1052.0 965.1 903.0 1056.8 1050.0 965.0 907.0 1053.0 0.007 1048.6 964.8 905.4 1051.2 1051.8 966.2 908.2 1055.8 1051.6 965.8 904.4 1053.6 1049.2 963.4 905.4 1053.4 0.008 1048.4 966.0 904.8 1052.4 1051.2 966.0 905.6 1056.9 1050.4 966.2 906.4 1054.4 1051.0 966.8 904.0 1054.0 0.009 1047.6 966.4 904.9 1054.4 1050.6 967.8 907.6 1059.0 1050.8 966.4 906.4 1054.4 1051.6 963.3 905.2 1054.4 0.010 1047.2 967.6 906.1 1054.8 1050.1 967.8 901.6 1063.0 1052.0 965.6 904.4 1055.2 1051.0 963.8 905.4 1056.0
Table 2. DENSITY (kgm-3) VALUES OF IODINE - ETHER SYSTEMS IN DIFFERENT SOLVENTS AT 303 K
Conc. M
Diphenylether 4-chloroanisole anisole 1,4-dioxane
CH2Cl2 CHCl3 CCl4 C6H14 CH2Cl2 CHCl3 CCl4 C6H14 CH2Cl2 CHCl3 CCl4 C6H14 CH2Cl2 CHCl3 CCl4 C6H14
[image:3.595.47.554.550.670.2]0.001 1268.9 1413.4 1518.6 640.4 1261.1 1408.3 1520.7 638.3 1258.3 1409.8 1519.8 634.3 1260.1 1408.3 1519.5 636.2 0.002 1264.1 1413.6 1514.2 638.5 1258.0 1407.0 1516.6 636.5 1257.8 1406.6 1515.0 637.0 1257.7 1407.2 1519.1 635.5 0.003 1270.5 1434.2 1514.8 640.1 1260.1 1406.2 1512.6 637.2 1263.2 1407.3 1516.1 635.2 1257.6 1405.8 1516.2 636.2 0.004 1269.4 1410.7 1519.6 643.6 1261.6 1405.9 1521.8 638.7 1258.2 1413.0 1520.1 633.3 1262.8 1411.0 1516.4 637.5 0.005 1259.8 1404.2 1519.0 636.1 1261.6 1410.9 1508.9 634.9 1260.1 1409.9 1518.0 637.6 1262.2 1408.0 1514.1 635.6 0.006 1267.5 1418.0 1520.0 641.4 1262.6 1409.5 1519.7 639.1 1258.7 1412.2 1523.0 636.7 1260.7 1409.7 1520.0 637.8 0.007 1263.3 1419.6 1514.9 639.0 1258.0 1408.0 1515.2 637.3 1260.7 1407.5 1516.8 638.5 1258.8 1407.0 1517.5 636.6 0.008 1269.8 1434.8 1520.3 643.0 1258.0 1406.7 1514.3 638.6 1264.5 1408.2 1516.1 635.4 1259.7 1406.5 1517.3 638.2 0.009 1269.5 1409.6 1514.9 643.6 1261.0 1413.5 1519.7 641.0 1258.6 1413.3 1521.8 633.5 1263.8 1410.9 1515.3 638.9 0.010 1261.5 1403.0 1518.9 637.8 1262.7 1405.6 1509.8 635.1 1259.7 1411.0 1519.5 637.9 1262.2 1407.8 1515.8 636.5
Table 3. VISCOSITY (x10-4 Nsm-2) VALUES OF IODINE - ETHER SYSTEMS IN DIFFERENT SOLVENTS AT 303 K
Conc. M
Diphenylether 4-chloroanisole anisole 1,4-dioxane CH2Cl2 CHCl3 CCl4 C6H14 CH2Cl2 CHCl3 CCl4 C6H14 CH2Cl2 CHCl3 CCl4 C6H14 CH2Cl2 CHCl3 CCl4 C6H14
_____________________________________________________________________________
904
.
Fig.1 Plots of Ultrasonic velocity Vs Concentration of iodine and ethers in dichloromethane
.
Fig.2 Plots of Ultrasonic velocity Vs Concentration of iodine and ethers in chloroform
1046 1047 1048 1049 1050 1051 1052 1053 1054 1055 1056
0.000 0.002 0.004 0.006 0.008 0.010 0.012
U
(
m
s
-1)
Concentration (M)
diphenyl ether 4-chloroanisole anisole 1,4-dioxane
962.0 963.0 964.0 965.0 966.0 967.0 968.0 969.0
0.000 0.002 0.004 0.006 0.008 0.010 0.012
U
(
m
s
-1)
Concentration (M)
905
.
Fig.3 Plots of Ultrasonic velocity Vs Concentration of iodine and ethers in carbon tetrachloride
.
Fig.4 Plots of Ultrasonic velocity Vs Concentration of iodine and ethers in n-hexane
899.0 900.0 901.0 902.0 903.0 904.0 905.0 906.0 907.0 908.0 909.0
0.000 0.002 0.004 0.006 0.008 0.010 0.012
U
(
m
s
-1)
Concentration (M)
diphenyl ether 4-chloroanisole anisole 1,4-dioxane
1048.0 1050.0 1052.0 1054.0 1056.0 1058.0 1060.0 1062.0 1064.0
0.000 0.002 0.004 0.006 0.008 0.010 0.012
U
(
m
s
-1)
Concentration (M)
_____________________________________________________________________________
906
.
Fig.5 Plots of Adibatic compressibility Vs Concentration of iodine and ethers in dichloromethane
.
Fig.6 Plots of Adibatic compressibility Vs Concentration of iodine and ethers in chloroform
0.710 0.712 0.714 0.716 0.718 0.720 0.722 0.724
0.000 0.002 0.004 0.006 0.008 0.010 0.012
β
(x
1
0
-9
k
g
-1m
s
2
Concentration (M)
diphenyl ether 4-chloroanisole anisole 1,4-dioxane
0.745 0.750 0.755 0.760 0.765 0.770
0.000 0.002 0.004 0.006 0.008 0.010 0.012
β
(x
1
0
-9
k
g
-1m
s
2
Concentration (M)
907
.
Fig.7 Plots of Adibatic compressibility Vs Concentration of iodine and ethers in carbon tetrachloride
.
Fig.8 Plots of Adibatic compressibility Vs Concentration of iodine and ethers in n-hexane
0.796 0.798 0.800 0.802 0.804 0.806 0.808 0.810 0.812 0.814 0.816
0.000 0.002 0.004 0.006 0.008 0.010 0.012
β
(x
1
0
-9
k
g
-1m
s
2
Concentration (M)
diphenyl ether 4-chloroanisole anisole 1,4-dioxane
1.385 1.390 1.395 1.400 1.405 1.410 1.415 1.420 1.425 1.430 1.435
0.000 0.002 0.004 0.006 0.008 0.010 0.012
β
(x
1
0
-9
k
g
-1m
s
2
Concentration (M)
_____________________________________________________________________________
908
Table 4. ABSORPTION COEFFICIENT (x10-15 Npm-1s2) VALUES OF IODINE - ETHER SYSTEMS IN DIFFERENT SOLVENTS AT 303 K
Conc. M
Diphenylether 4-chloroanisole anisole 1,4-dioxane
CH2Cl2 CHCl3 CCl4 C6H14 CH2Cl2 CHCl3 CCl4 C6H14 CH2Cl2 CHCl3 CCl4 C6H14 CH2Cl2 CHCl3 CCl4 C6H14
[image:8.595.22.574.131.248.2]0.001 10.106 13.884 19.994 11.822 10.026 13.927 20.311 11.706 9.703 13.620 20.526 11.671 9.978 20.143 20.175 11.950 0.002 10.089 13.827 20.041 11.952 10.002 13.699 20.231 11.607 9.779 13.730 20.314 11.564 10.017 20.044 20.311 11.935 0.003 10.067 14.056 20.186 11.948 10.133 13.600 20.261 11.604 9.828 13.679 20.669 11.621 10.019 20.224 20.464 11.778 0.004 10.134 13.973 20.093 11.863 9.852 13.679 20.205 11.744 9.870 13.858 20.171 11.548 10.111 20.229 20.497 11.814 0.005 10.126 13.955 19.857 11.808 10.027 13.676 20.227 11.708 9.849 13.532 20.196 11.480 9.781 20.109 20.218 11.856 0.006 10.121 14.098 20.085 11.803 9.927 13.512 20.347 11.718 9.878 13.714 20.457 11.511 10.017 20.025 20.105 11.707 0.007 10.158 14.102 19.977 11.994 9.981 13.609 20.148 11.692 9.918 13.844 20.387 11.682 10.138 20.385 20.435 11.801 0.008 10.148 13.893 20.232 11.903 10.022 13.812 20.240 11.625 9.902 13.722 20.186 11.627 10.044 20.033 20.551 11.739 0.009 10.259 13.964 19.754 11.859 9.949 13.488 20.315 11.538 9.828 13.689 20.380 11.574 9.974 20.304 20.494 11.679 0.010 10.156 13.949 20.181 11.781 10.099 13.502 20.711 11.436 9.852 13.629 20.341 11.613 9.962 20.173 20.464 11.618
Table 5. INTERNAL PRESSURE (X103 atm) VALUES OF IODINE - ETHER SYSTEMS IN DIFFERENT SOLVENTS AT 303 K
Conc. M
Diphenylether 4-chloroanisole anisole 1,4-dioxane
CH2Cl2 CHCl3 CCl4 C6H14 CH2Cl2 CHCl3 CCl4 C6H14 CH2Cl2 CHCl3 CCl4 C6H14 CH2Cl2 CHCl3 CCl4 C6H14
0.000 4.928 4.073 3.753 2.333
[image:8.595.35.561.280.408.2]0.001 4.980 4.093 3.727 2.399 4.936 4.088 3.760 2.380 4.849 4.045 3.760 2.356 4.923 4.065 3.754 2.378 0.002 4.960 4.091 3.728 2.397 4.917 4.053 3.749 2.363 4.858 4.051 3.731 2.355 4.909 4.055 3.771 2.374 0.003 4.991 4.189 3.738 2.405 4.953 4.037 3.732 2.366 4.890 4.047 3.759 2.354 4.911 4.055 3.764 2.364 0.004 4.988 4.097 3.738 2.409 4.894 4.042 3.758 2.378 4.877 4.086 3.741 2.337 4.958 4.071 3.762 2.376 0.005 4.940 4.070 3.719 2.375 4.939 4.056 3.728 2.355 4.881 4.036 3.744 2.353 4.894 4.052 3.740 2.372 0.006 4.973 4.136 3.741 2.391 4.917 4.032 3.763 2.382 4.887 4.062 3.773 2.349 4.921 4.053 3.749 2.366 0.007 4.958 4.141 3.714 2.393 4.906 4.036 3.743 2.366 4.903 4.068 3.754 2.367 4.937 4.073 3.765 2.371 0.008 4.983 4.166 3.750 2.403 4.912 4.060 3.737 2.367 4.910 4.054 3.742 2.349 4.926 4.058 3.769 2.372 0.009 5.004 4.093 3.690 2.405 4.904 4.042 3.768 2.372 4.866 4.066 3.776 2.334 4.930 4.071 3.763 2.369 0.010 4.939 4.073 3.746 2.371 4.945 4.017 3.750 2.344 4.881 4.046 3.757 2.358 4.916 4.055 3.763 2.355
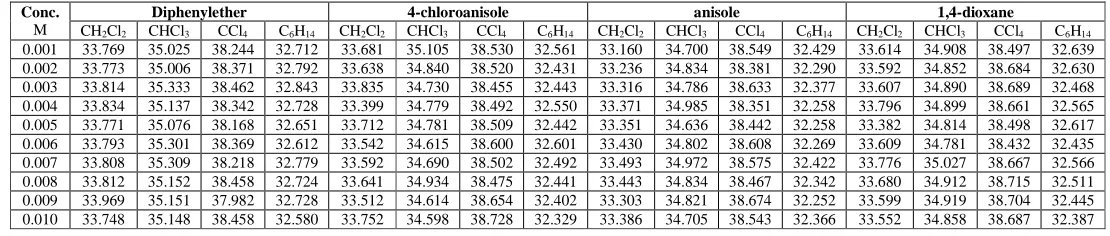
Table 6. COHESSIVE ENERGY (kJmol-1) VALUES OF IODINE - ETHER SYSTEMS IN DIFFERENT SOLVENTS AT 303 K
Conc. M
Diphenylether 4-chloroanisole anisole 1,4-dioxane
CH2Cl2 CHCl3 CCl4 C6H14 CH2Cl2 CHCl3 CCl4 C6H14 CH2Cl2 CHCl3 CCl4 C6H14 CH2Cl2 CHCl3 CCl4 C6H14
0.001 33.769 35.025 38.244 32.712 33.681 35.105 38.530 32.561 33.160 34.700 38.549 32.429 33.614 34.908 38.497 32.639 0.002 33.773 35.006 38.371 32.792 33.638 34.840 38.520 32.431 33.236 34.834 38.381 32.290 33.592 34.852 38.684 32.630 0.003 33.814 35.333 38.462 32.843 33.835 34.730 38.455 32.443 33.316 34.786 38.633 32.377 33.607 34.890 38.689 32.468 0.004 33.834 35.137 38.342 32.728 33.399 34.779 38.492 32.550 33.371 34.985 38.351 32.258 33.796 34.899 38.661 32.565 0.005 33.771 35.076 38.168 32.651 33.712 34.781 38.509 32.442 33.351 34.636 38.442 32.258 33.382 34.814 38.498 32.617 0.006 33.793 35.301 38.369 32.612 33.542 34.615 38.600 32.601 33.430 34.802 38.608 32.269 33.609 34.781 38.432 32.435 0.007 33.808 35.309 38.218 32.779 33.592 34.690 38.502 32.492 33.493 34.972 38.575 32.422 33.776 35.027 38.667 32.566 0.008 33.812 35.152 38.458 32.724 33.641 34.934 38.475 32.441 33.443 34.834 38.467 32.342 33.680 34.912 38.715 32.511 0.009 33.969 35.151 37.982 32.728 33.512 34.614 38.654 32.402 33.303 34.821 38.674 32.252 33.599 34.919 38.704 32.445 0.010 33.748 35.148 38.458 32.580 33.752 34.598 38.728 32.329 33.386 34.705 38.543 32.366 33.552 34.858 38.687 32.387
Table 7. STABILITY CONSTANT (dm-3 mol-1), FREE ENERGY (kJmol-1), FREE ENERGY OF ACTIVATION (kJmol-1) AND
RELAXATION TIME (x10-13 s) VALUES OF CERTAIN CHARGE TRANSFER COMPLEXES OF IODINE - ETHER SYSTEMS AT
303 K
DONOR K ∆∆∆∆G ∆∆∆∆G
# ττττ
CH2Cl2 CHCl3 CCl4 C6H14 CH2Cl2 CHCl3 CCl4 C6H14 CH2Cl2 CHCl3 CCl4 C6H14 CH2Cl2 CHCl3 CCl4 C6H14
DIPHENYL
ETHER 74.2 51.2 50.4 37.3 -10.7 -9.5 -9.7 -9.0 3.4 4.0 4.9 3.8 5.4 6.8 9.2 6.3 4-CHLORO
ANISOLE 58.9 43.4 36.4 34.6 -10.1 -9.2 -9.0 -8.9 3.4 4.0 4.9 3.8 5.3 6.7 9.3 6.2 ANISOLE 53.3 37.6 35.5 31.2 -9.7 -9.0 -8.8 -8.6 3.3 4.0 4.9 3.8 5.2 6.7 9.3 6.2 1,4-DIOXANE 40.3 31.5 33.5 24.0 -9.2 -8.3 -8.8 -8.0 3.4 4.0 4.9 3.8 5.3 6.8 9.4 6.3
Correlation of stability constant with molecular properties
[image:8.595.19.574.436.554.2]909
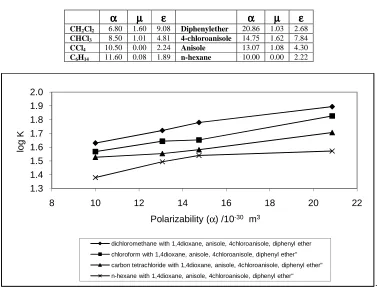
[image:9.595.109.487.161.448.2]Plots of log K against polarizability of the donor in different solvents are given in Fig.9. These plots show that formation constant (K) increases with increase in polarizability of donor molecules. Thus, polarizability of donor molecules plays significant role during complexation.
Table 8. POLARIZABILITY, DIPOLE MOMENT AND DIELECTRIC STRENGTH FOR ETHERS AND SOLVENTS
α
αα
α
µµµµ
εεεε
α
αα
α
µµµµ
εεεε
CH2Cl2 6.80 1.60 9.08 Diphenylether 20.86 1.03 2.68
CHCl3 8.50 1.01 4.81 4-chloroanisole 14.75 1.62 7.84
CCl4 10.50 0.00 2.24 Anisole 13.07 1.08 4.30
C6H14 11.60 0.08 1.89 n-hexane 10.00 0.00 2.22
.
Fig.9. Plots of log K Vs Polarizability of ethers
The plots of log K against dipole moment of the donor are given in Fig.10. From these plots it is clear that stability constant K increase with dipole moment in three systems. But in the case of diphenyl ether, the stability constant is abnormally high even with different ethers having low dipole moment. This may be due to high π electron density in diphenyl ether. Plots of log K against dielectric constant of the donor are given in Fig.11. These plots also show that the stability constant value increases with increase in dielectric constant of donor molecules except diphenyl ether.
1.3 1.4 1.5 1.6 1.7 1.8 1.9 2.0
8 10 12 14 16 18 20 22
lo
g
K
Polarizability (α) /10-30 m3
_____________________________________________________________________________
910
.
Fig.10. Plots of log K Vs Dipole Moment of ethers
.
Fig.11. Plots of log K Vs Dielectric Strength of ethers
These correlations of K with molecular properties indicate that it is the polarizability factor which mainly determines the ease of complexation. Thus, the acceptor molecule first polarizes the donor molecule during the formation of a charge transfer complex. The stability of charge transfer complex is also influenced by the polarity of the medium (Table 8). The plots of log K Vs dielectric strength of the solvents are presented in Fig.12. As the dielectric constant of the medium increases, the stability constant of the charge transfer complex also increases. This can be explained as follows. The charge transfer complex is more polar than the donor and acceptor molecules and hence it is more soluted. Therefore, high dielectric constant of the medium favours the formation of such a complex.
1.2 1.3 1.4 1.5 1.6 1.7 1.8 1.9 2.0
0 0.5 1 1.5 2
lo
g
K
Dipole Moment (m) D
dichloromethane with 1,4dioxane, anisole, 4chloroanisole, diphenyl ether chloroform with 1,4dioxane, anisole, 4chloroanisole, diphenyl ether carbon tetrachloride with 1,4dioxane, anisole, 4chloroanisole, diphenyl ether n-hexane with 1,4dioxane, anisole, 4chloroanisole, diphenyl ether
1.2 1.3 1.4 1.5 1.6 1.7 1.8 1.9 2.0
0 2 4 6 8 10
lo
g
K
Dielectric Strength (ε)
911
.
Fig.12. Plot of log K Vs Dielectric strength of solvents
CONCLUSION
Iodine forms thermodynamically stable charge transfer complexes with ethers. The formation constants correlate with the molecular properties of donor molecules and the correlation is better with polarizability. The stability of such complexes is also influenced by the dielectric constant of the medium.
Acknowledgement
The authors thank the Principal and the Management of The New College, Chennai – 600 014, for their constant support and encouragement.
REFERENCES
[1]V. Kannappan, R. Jaya Santhi, Indian J Pure and Applied Physics, 2005, 43, 750 [2]SJ. Askar Ali; K. Rajathi and A. Rajendran, J Chem. Pharm. Res., 2011, 3(5), 348-358 [3]VD. Bhandarkkar; OP. Chimankar and NR. Pawar, J Chem. Pharm. Res., 2010, 2(4), 873-877 [4]SR. Aswale, SS. Aswale, AB. Dhote and DT. Tayade, J Chem. Pharm. Res., 2011, 3(6), 233-237 [5]OP. Chimankar, R. Shiriwas and VA. Tabhane, J Chem. Pharm. Res., 2011, 3(3), 587-596 [6]S. Jayakumar, N. Karunanithi, V. Kannappan, S. Gunasekaran, Asian Chem Letters, 1999, 3, 224 [7]MS. Neuman, Blum, J Am Soc, 1964, 86, 5600
[8]Rose Venis and Rosario Rajkumar, J Chem. Pharm. Res., 2011, 3(2), 878-885 [9]S. Thirumaran and S. Sudha, J Chem. Pharm. Res., 2010, 2(1), 327-337
[10] OP. Chimankar, R. Shiriwas and VA. Tabhane, J Chem. Pharm. Res., 2011, 3(3), 579-586 [11] OP. Chimankar, R. Shiriwas and VA. Tabhane, J Chem. Pharm. Res., 2011, 3(3), 587-596 [12] V. Kannappan, R. Jaya Santhi, S. Xavier Jesu Raja, Phys Chem Liq, 2003,14(2), 133 [13] V. Kannappan, S. Kothai, J Acous Soc India, 2002, 30, 76
[14] GP. Pethe, AA. Ranteka, TR. Lawankar and ML. Narwade, J Chem. Pharm. Res., 2010, 2(4), 68-74 [15] V. Kannappan, S. Kothai, Indian J Pure and Applied Physics, 2002, 40, 17
[16] V. Kannappan, R. Jaya Santhi R, EJP. Malar, Phys Chem Liq, 2002, 40, 507 [17] VA. Tabhane, Sangeeta Agarwal, KG. Revetkar, J Acous Soc Ind, 2000, 8, 369 [18] Anwar Ali, Anil Kumar Nain, Acoustics Letters, 1996, 19, 181
[19] SC. Bhatt, Harikrishnan Semwal, Vijendra Lingwal, J Acous Soc Ind, 2000, 28, 275 [20] PS. Nikam, Hiray, Indian J Pure and Applied Physics, 1991, 29, 601
[21] Timmerniam, J Physico-chemical constants of pure organic compounds, Elsevier, 1950 [22] S. Kothai, Ph D Thesis, University of Madras, 2003
10 20 30 40 50 60 70 80 90
0.00 2.00 4.00 6.00 8.00 10.00
lo
g
K
Dielectric Strength (ε)