University Students Use of Computers and Mobile Devices
for Learning and their Reading Speed on
Different Platforms
Bongeka Mpofu
School of Computing, University of South Africa, South Africa
Copyright©2016 by authors, all rights reserved. Authors agree that this article remains permanently open access under the terms of the Creative Commons Attribution License 4.0 International License
Abstract
This research was aimed at the investigation of mobile device and computer use at a higher learning institution. The goal was to determine the current use of computers and mobile devices for learning and the students’ reading speed on different platforms. The research was contextualised in a sample of students at the University of South Africa. Students indicated their use of computers and mobile devices for educational purposes in closed questions. The results of this case study showed that most students preferred reading from university supplied printed materials than from notes downloaded on computers or mobile devices. The percentages of students who use computers and mobile devices were calculated. Students currently use computers more than mobile devices for reading downloaded notes. A mobile eye tracker was used to analyse the students’ reading speed on paper, and on a mobile device. Screen based eye tracking was also used to analyse the participants’ reading speed when reading on a desktop screen. Participants who read on paper had the fastest reading speed than those who read on mobile device or computer screen.Keywords
Distance Education, E-learning, Mobile Devices, Digitised Books, Eye Tracker, Reading Speed, Fixations1. Introduction
The increased availability and evolution of technology has made it easier for computers and mobile phones to be accessible at educational institutions, homes and workplaces (Wei, Moldovan and Muntean, 2009). More students now have access to the Internet on both computers and mobile phones. E-learning refers to learning where learners and tutors are separated by distance, time or both (Raab, Ellis & Abdon, 2002; Cantoni, Cellario & Porta, 2004). It is the use of the Internet to deliver learning, training, or educational material (Stockley, 2003; Sun, Tsai, Finger, Chen and Yeh,
2008) and has decreased the distance learning limitation of learning location (Blocher, De Montes, Willis and Tucker, 2002). It also includes learning through other kinds of electronic mechanisms, e.g. computer based learning material distributed on CDs, video tape, TV, DVD, intranet, extranet, satellite broadcasts and personal organisers (Kahiigi, Kigozi, Ekenberg, Hansson, Tusubira and Danielson, 2008).
The University of South Africa (UNISA) is an open distance learning institution. A paper based education has been UNISA’s main delivery mechanism for many decades but the university’s educational content can now be delivered on computers and on mobile devices. The purpose of this study was to investigate the use of mobile devices and computers for learning. Comparison of the reading speed on mobile device, paper and computer screen was also undertaken.
1. Distance Education and E-Learning
Distance education consists of processes and methods of delivering educational instruction on an individual basis to students who are physically separated from the learning institution, tutors as well as other students (Adams, 2006; Unisa, 2008). Distance education began in 1728 when Caleb Phillips advertised weekly shorthand lessons by post to students in their country (Tejeda-Delgado, Millan and Slate, 2011).
2. Theoretical Framework
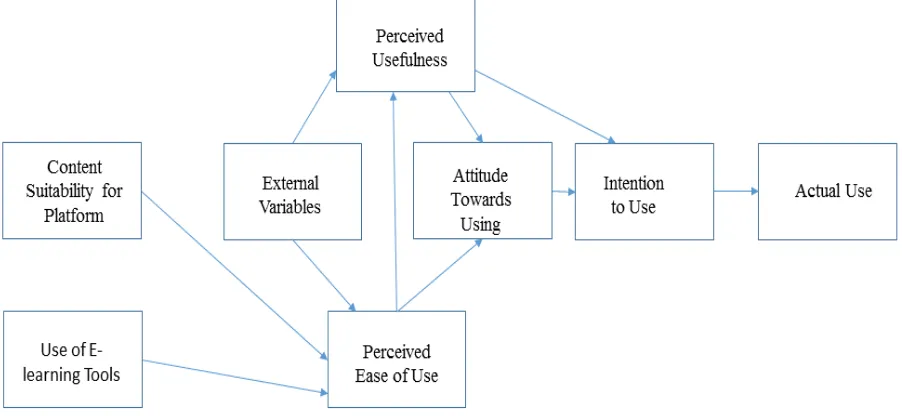
[image:2.595.88.525.140.359.2]Learning theories have been used to provide a basis on which to propose and evaluate different ways of teaching to meet the needs of learners. Davis (1989) presented the Technology Acceptance Model to model technology acceptance within organisations.
Figure 1. Technology Acceptance Model
The model proposes the following factors (Davis, 1989; Wang, Park, Chung, & Choi, 2014);
Perceived ease of use affects the adoption of a system. It is the degree of a user’s belief that a certain system can be used easily without assistance.
Perceived usefulness represents the degree of belief that a certain system will help them perform their job better.
External variables, such as users’ characteristics affect perceived usefulness and perceived ease of use.
Attitude towards use is the user desirability of using a system and it increases if the system is perceived to be easy to use and useful.
Behavioural intention is predicted by attitude towards use and perceived usefulness of a system.
Actual use of a system is affected by the behavioural intention.
These factors may be used to explain and determine the use of mobile devices and computers for educational purposes.
[image:2.595.79.530.518.726.2]In this study, the researcher proposes a model for the design of content suitable for a specific platform. The Content Platform Technology Acceptance Model (CPTAM), shown in Figure 2, proposes that e-learning content designers must implement the best design strategies to suit the specific platform so that e-learning could be carried out effectively. Students may utilise tools that support e-learning, e.g. online tutorials and e-books, digital library, email, discussion forums, blogs, and the announcements area. 3. Mobile Devices in E-Learning
Mobile learning is a form of distance learning where the sole technologies are handheld or palmtop devices. Educational content is delivered on devices such as mobile phones, smartphones, personal digital assistants (PDAs) and tablet devices e.g. iPads. Mobile phones are portable, have advanced capabilities and can be used for situated learning. In the situated learning approach, knowledge and skills are acquired in the same context in which they are applied. Some mobile phones have components such as a keyboard, touch screen, built in camera and secure email facilities (Traxler, 2005). Educators are considering mobile devices for the delivery of study materials due to their spontaneous access to online resources and their low cost compared to desktop computers and notebooks. Mobile devices can be used alongside paper and pencil due to their small size.
4. Eye Tracking of Paper, Computer Screen and Mobile Device Readers
Eye tracking is a process of measuring the location and sequence of eye movements. An eye tracker is used to record eye movements and eye fixations and to evaluate usability issues and understand human performance (Conati & Merten, 2007). An eye tracker can be a head mounted or a table mounted system (Almeida, Veloso, Roque, & Mealha, 2011). These eye trackers use infrared light that is reflected from the cornea and the retina to obtain data on participants’ eye movements (Cantoni, Perez, Porta, & Ricotti, 2012).
The application areas of eye tracking include usability research and market research. An analysis of user reaction to placement and variations of advertisements and products is done in order to design better products and advertisements
(Morimoto & Mimica, 2005). In the automotive industry, eye tracking can be used to detect drowsiness or distraction. A controller triggers an alarm if the head position drops or if eyes close (Dasgupta & George, 2013). In a study, eye tracking technology was used to investigate the association between cognitive abilities and the complexity of a web page. Tasks were performed on simple, medium and complex Web pages. The results were used to model human behaviour by designing suitable and adaptive environments based on the assumption that individuals interact differently in web pages of different complexity (Nisiforou, Michailidou, & Laghos, 2014). Eye tracking has also been used to monitor expert and non-expert students completing tasks on a Learning Management System (LMS). The results indicated usability problems faced by the students when using the LMS (Pretorius, van Biljon, & de Kock, 2010).
5. Research Questions and Objectives
The objective of this research was to study how students currently use computers and mobile devices for educational purposes. The research also sought to investigate if there were differences in reading speed on paper, mobile device and computer screen.
2. Methodology
Research Design
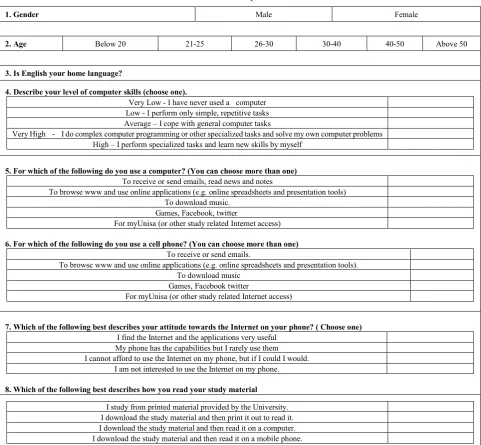
Table 1. Pre-test Questionnaire
1. Gender Male Female
2. Age Below 20 21-25 26-30 30-40 40-50 Above 50
3. Is English your home language?
4. Describe your level of computer skills (choose one).
Very Low - I have never used a computer Low - I perform only simple, repetitive tasks Average – I cope with general computer tasks
Very High - I do complex computer programming or other specialized tasks and solve my own computer problems High – I perform specialized tasks and learn new skills by myself
5. For which of the following do you use a computer? (You can choose more than one) To receive or send emails, read news and notes
To browse www and use online applications (e.g. online spreadsheets and presentation tools) To download music.
Games, Facebook, twitter
For myUnisa (or other study related Internet access)
6. For which of the following do you use a cell phone? (You can choose more than one) To receive or send emails.
To browse www and use online applications (e.g. online spreadsheets and presentation tools). To download music
Games, Facebook twitter
For myUnisa (or other study related Internet access)
7. Which of the following best describes your attitude towards the Internet on your phone? ( Choose one) I find the Internet and the applications very useful
My phone has the capabilities but I rarely use them I cannot afford to use the Internet on my phone, but if I could I would.
I am not interested to use the Internet on my phone.
8. Which of the following best describes how you read your study material I study from printed material provided by the University. I download the study material and then print it out to read it. I download the study material and then read it on a computer. I download the study material and then read it on a mobile phone.
In this study, quantitative methods were employed to analyse eye tracking results obtained from the experiments and qualitative methods were used to enhance interpretation of the results, thus the study was based on both the positivist and the interpretivist paradigms.
This research was conducted in the context of the University of South Africa (UNISA). In this research, convenience sampling was used. It is the selection of participants from the population using non-random procedures. Convenience sampling is a non-probability sampling technique that involves obtaining responses from people who are available and willing to take part (Kitchenham & Pfleeger, 2002). The researcher sent an invitation email to registered students. Available, accessible and registered UNISA students took part in the study.
The questionnaire comprised a set of questions to investigate the level of the participants’ computer skills and
the use of computers or mobile devices for educational purposes. Students had to state the platform they used for reading their study material. They were also requested to describe their attitude towards the Internet.
2. Eye Tracking
[image:5.595.134.476.78.282.2]
a.Tobii X120 and iPad b.Tobii T120 Eye Tracker Figure 3. Eye trackers – Left: Tobii X120, Right: Tobii T120 Eye Tracker
The Tobii T120 and X120 eye trackers have an accuracy of 0.5 degrees, a drift that is less than 0.3 degrees, sampling frequency of either 60 or 120 Hz and use infrared diodes to generate patterns on a participant’s eyes. Eye tracking is the process of measuring the point of gaze or the motion of an eye relative to the head. Normal reading consists of a series of saccadic eye movements along lines of text, separated by periods of brief fixations during which the eye is relatively stationary and visual information is acquired from the text (Rayner, 2009). The eye tracking data was exported from Tobii Studio™. It is the eye tracking software that allows researchers to record and analyse eye tracking tests. The software supports the calculation of key eye tracking metrics in addition to tables and graphs to enable quantitative analysis and interpretation as well as display of results. The metrics can be exported to text, spreadsheet or to an analysis application. In this study, the researcher exported the statistical data to Microsoft Excel® . The inferential statistical analysis was done using the IBM SPSS Statistics. Validity or Reliability of the Instruments
Calibration of the participant’s eyes was carried out before the eye tracking sessions. Calibration enables the identification of a participant’s eye characteristics so as to estimate the gaze point with high accuracy. Eye tracking produces precise eye tracking data, i.e. fixations and saccades. The exported statistics file also includes areas where the eye gaze was lost. The areas are indicated by a validity column whose values range from 0 to 4. If the validity is 0, it implies that the gaze point was computed with high accuracy. If validity is 4, it indicates that the eye tracker was unable to locate the participant’s eye gaze. The areas that the eye tracker was not able to measure were not included in the data analysis.
Questions included in the questionnaire were tested for reliability and content and construct validity.
Content validity was done to assess whether the assessment content and composition were appropriate, given what was being measured. The Lawshe formula was used to calculate the content validity ratio. A pre-test that involved a differential groups study, was conducted to test construct validity. There were two different groups, one with the construct and one without.
The Cronbach’s internal consistency reliability and test– retest reliability were used to assess the reliability of the questions. The Cronbach’s reliability test was used to measure internal consistency of a psychometric test. The value of alpha (α) was calculated to test the reliability score. The group was also re-tested at a later date to ensure there was a correlation between the results.
3. Data Analysis and Results
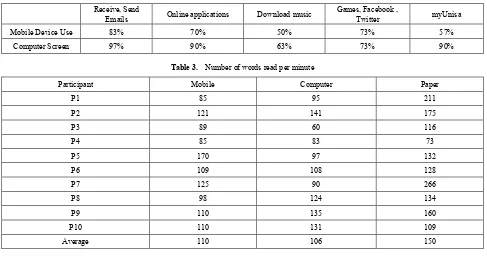
1. Use of computers and mobile devices for learning The aim was to determine the current use of computers and mobile devices for learning. Students indicated their use of computers and mobile devices for educational purposes in closed questions that were in the questionnaire, see Table 2.
Table 2. Current Use of Computers and Mobile Devices
Receive, Send
Emails Online applications Download music Games, Facebook , Twitter myUnisa
Mobile Device Use 83% 70% 50% 73% 57%
[image:6.595.62.549.89.352.2]Computer Screen 97% 90% 63% 73% 90%
Table 3. Number of words read per minute
Participant Mobile Computer Paper
P1 85 95 211
P2 121 141 175
P3 89 60 116
P4 85 83 73
P5 170 97 132
P6 109 108 128
P7 125 90 266
P8 98 124 134
P9 110 135 160
P10 110 131 109
Average 110 106 150
2. Reading Speed
The page that was read by participants consisted of seven sections. The participant’s reading speed for the whole page was calculated. The average speed for participants who read on paper was 150 words per minute.
Participants who read on computer screen had an average of 106 words read per minute. Those who read on mobile device had an average speed of 110 words per minute, see Table 3.
The results indicated that participants read more words on paper than on computer screen or mobile device.
The One Way Analysis of Variance, (ANOVA) was used to test if the differences in reading speed when reading on different platforms were significant. The p-value was 0.029, which was less than the alpha level of 0.05. This meant that there were statistically significant differences in the reading speed among the groups of participants that read on mobile, paper and computer screen.
4. Recommendations and Conclusion
The study sought to find out how students use computers and mobile devices for reading. A comparison of the number of words read per minute on the different platforms was undertaken. In this study, more students indicated that they use computers more than mobile devices for reading notes online. In the experiment students read the least words per minute on the computer screen. E-learning designers may split computer screen text into columns in order to increase the reading speed on computer screen. Reading is slightly faster for text in two columns (Dyson, 2004).
Students must be educated on the potential use of computers and mobile technology for learning. Resources
and collaborative tools that are available on myUnisa include official study materials, literature search and announcements. Collaborative tools that students may make use of include discussion forums and blogs.
E-learning designers may utilise tools and technologies to improve the usability and the quality of content, such as the annotation tools that provide students the capability to annotate directly on Web documents or pages and highlight sections of digitised books.
REFERENCES
[1] Adams, J. (2006). The Part Played by Instructional Media in Distance Education. Studies in Media & Information Literacy
Education, 6(2), 1-12. Retrieved February 2013, from
www.pilotmedia.com
[2] Almeida, S., Veloso, A., Roque, L., & Mealha, Ó. (2011). The Eyes and Games: A Survey of Visual Attention and Eye Tracking Input in Video Games. SBGames.
[3] Blocher, J. M., De Montes, L. S., Willis, E. M., & Tucker, G. (2002). Online Learning: Examining the Successful Student Profile. The Journal of Interactive Online Learning, 1-12. [4] Cantoni, V., Cellario, M., & Porta, M. (2004). Perspectives
and challenges in e-learning: towards natural interaction paradigms. Journal of Visual Languages and Computing, 333–345.
[5] Cantoni, V., Perez, C. J., Porta, M., & Ricotti, S. (2012). Exploiting Eye Tracking in Advanced E-Learning Systems. Ruse: ACM.
[7] Dasgupta, A., & George, A. (2013). An on-board vision based system for drowsiness detection in automotive drivers. Int J
Adv Eng Sci Appl Math, 94–103.
[8] Davis, F. D. (1989). Perceived Usefulness, Perceived Ease of Use, and User Acceptance of Information Technology. MIS
Quarterly, 13(3), 319-340.
[9] Dharmawansa, A. D., Nakahira, K. T., & Fukumura, Y. (2013). Detecting eye blinking of a real-world student and introducing to the virtual e-Learning environment. Procedia
Computer Science, 717 – 726.
[10]Dyson, M. C. (2004). How physical text layout affects reading from screen. Behaviour & Information Technology, 23(6), 377–393.
[11]Kahiigi, E. K., Ekenberg, L., Hansson, H., Tusubira, F., & Danielson, M. (2008). Exploring the e-Learning State of Art.
The Electronic Journal of e-Learning Volume 6 Issue 2,
77-88.
[12]Kitchenham, B., & Pfleeger, S. L. (2002). Principles of Survey Research Part 5: Populations and Samples. Software
Engineering, 17-20.
[13]Morimoto, C. H., & Mimica, M. R. (2005). Eye gaze tracking techniques for interactive applications. Computer Vision and
Image Understanding, 4-24.
[14]Nisiforou, E. A., Michailidou, E., & Laghos, A. (2014). Using Eye Tracking to Understand the Impact of Cognitive Abilities on Search Tasks. UAHCI/HCII 2014 (pp. 46-57). Springer International Publishing Switzerland 2014.
[15]Pretorius, M. C., van Biljon, J., & de Kock, E. (2010). Added Value of Eye Tracking in Usability Studies: Expert and Non-expert Participants. IFIP International Federation for
Information Processing, (pp. 110-121).
[16]Raab, R. T., Ellis, W. W., & Abdon, B. R. (2002).
Multisectoral Partnerships in E-learning A Potential Force for Improved Human Capital Development in the Asia Pacific.
Internet and Higher Education, 217–229.
[17]Rayner, K. (2009). Eye movements and attention in reading, scene perception, and visual search. The Quarterly Journal of
Experimental Psychology, 62(8), 1457–1506.
[18]Stefanescu, R., Dumitru, R., & Moga, L. (2009). Motivation for distance education. Lex ET Scientia International Journal. [19]Stockley, D. (2003). E-learning Definition and Explanation. Retrieved from http://derekstockley.com.au/elearning-definit ion.html
[20]Sun, P.-C., Tsai, R. J., Finger, G., Chen, Y.-Y., & Yeh, D. (2008). What drives a successful e-Learning? An empirical investigation of the critical factors influencing learner satisfaction. Computers and Education, 1183–1202.
[21]Tejeda-Delgado, C., MilLan, B. J., & Slate, J. R. (2011). Distance and face-to-face learning culture and values: A conceptual analysis. Administrative Issues Journal:
Education, Practice and Research, 1(2), 118-131.
[22]Traxler, J. (2005). Defining Mobile Learning. IADIS
International Conference Mobile Learning 2005, (pp.
261-266).
[23]Unisa. (2008). Open Distance Learning Policy. Retrieved May 30, 2013, from http://www.unisa.ac.za: http://www.unisa.ac. za/contents/faculties/service_dept/ice/docs/Policy%20-%20 Open%20Distance%20Learning%20-%20version%205%20-%2016%2009%2008%20_2_.pdf
[24]Wang, B. R., Park, J.-Y., Chung, K., & Choi, I. Y. (2014). Influential Factors of Smart Health Users according to Usage Experience and Intention to Use. Wireless Pers Commun, 2671–2683.