Numerical characterisation of biomedical titanium surface texture
using novel feature parameters
Jian Wang
1, Xiangqian Jiang
1,*, Elzbieta Gurdak
2, Paul Scott
1, Richard Leach
2, Paul Tomlins
2and Liam
Blunt
11
Centre for Precision Technologies, School of Computing and Engineering, University of Huddersfield,
Queensgate, Huddersfield HD1 3DH, UK
2
Materials Division, National Physical Laboratory, Hampton Road, Teddington, Middlesex TW11 0LW,
UK
* Corresponding author, [email protected]
Abstract
In biomedicine, titanium materials with specific surface textures (for example, those produced using consecutive polishing, sandblasting and acid etching) are widely used to facilitate osseointegration of human/animal tissue with implant surface structures. The surface texture has a critical role on the material‟s functionality in terms of cellular adhesion and proliferation. However, conventional surface topography characterisation parameters pertinent to cellular attachment such as Sds (density of summits of a surface) and Ssc (arithmetic mean summit curvature of a surface) are liable to be influenced by low amplitude high spatial frequency components or measurement noise. In this research, a novel feature characterisation, based on pattern recognition techniques is implemented on specially processed titanium surfaces. The mean dimensions and densities of the micro-scale features of the surfaces are extracted. The statistical analysis results demonstrate the efficiency and stability of the feature analysis compared to the use of conventional surface texture parameters. Additionally, potentially efficient parameters for characterisation of biomedical surfaces are indicated through the use of a one-way analysis of variance. As a case study, from the point of view of surface metrology, limited experimental data is presented; the intention of the authors is to give a guide to innovative use of the novel surface characterisation techniques. A large amount of biomedical experiments would be needed in the future to fully validate the correlation between the surface texture parameters and its biomedical functions but the present work provides a useful start point for a larger study.
Keywords: surface texture, characterisation, feature parameters, biomedical titanium surface, ANOVA
1. Introduction
differentiation of cells can be enhanced by increasing the particle size up to 300 m used in the blasting process. However, the accurate role of surface topography on osseointegration remains poorly understood.
Conventional surface texture characterisation parameters such as Ra, Rt and Rz [3] of a surface profile or Sa, Sds and Sdr [4, 5] on an areal surface have been used to ascertain the functionality of titanium surfaces and have been proven to be of limited use. However, surfaces are complex entities which cannot be described completely by a single or even a few numerical descriptors [6]. Numerous numerical parameters have been proposed in the past most of which are now redundant [7]. For example, Sa and Sq are a pair of highly correlated parameters. Only one of them should be selected for use in most applications. Choosing a set of significant parameters which are functionally correlated is a notoriously difficult topic. The solutions in engineering are usually based on a large amount of empirical experimental data [8]. Very little progress has been made in this area except where a excellent correlation model has been developed, by which the functionalities and the surface geometric characteristics are connected. In the recent few years, some generic methods have been suggested or used, such as parameter classification [6, 8], Analysis of Variances (ANOVA) and correlation analysis [9]. In this case study, the ANOVA method is adopted as a tool to show functional correlation.
Specifically when considering the surface topography of titanium bio-implants, one of the main elements is the micro-scale concave pore features generated by acid etching, which lay on the relatively large scale sandblasted areas (see Fig 1a). Clearly, conventional profile (two-dimensional) or even areal (three-dimensional) statistical based parameters are deficient in separating and quantifying these multi-scale geometrical features. It is considered that multi-scale roughness descriptors quantifying the mean spacing between the micro-features, mean depth or their densities would provide improved tools for predicting the surface functionality.
The draft standard ISO/FDIS 25178-2 [10] provides a robust solution for this type characterisation challenge. It retains the most typical conventional parameters but also proposes several novel solutions such as pattern recognition techniques. Two parameter sets are defined as “field parameters” and “feature parameters”. The field parameter set applies statistics to the continuous point cloud of the areal surface data [11] which contains the majority of the conventional areal surface texture parameters. The “feature parameters” apply statistics to a subset of predefined topographical features [12] such as significant peaks yielding parameters such as Spd (density of peaks of a surface), S5v (five point pit height of a surface), Spc (arithmetic mean peak curvature of a surface). The basic philosophy behind feature parameters is to treat a surface as a collection of features (edge and facet features or Maxwellian features: hills, dales saddle points, ridge lines and course lines) [13]. A surface is segmented into a series of regions that containing individual topographically significant features. The segmented surface geometrical features can then be analyzed individually or statistically. A feature characterisation toolbox - “five steps to a feature parameter” - has been defined [10].
In this research, advanced parameter sets [10] are utilized to characterize the micro-features that are generated mainly by the acid etching process of titanium bio-implant surfaces. The densities and dimensions of the micro-pores generated are calculated innovatively by means of the feature characterisation toolbox. Based on a one-way analysis of variance (ANOVA) [14], the potential significant parameters are indicated. The higher significance of the feature parameters is demonstrated compared to the field parameters. It should be borne in mind that selection of significant parameters that are functional correlated requires a large amount of experiments and empirical data.
As a case study, from the point of view of surface metrology, limited experimental data is presented here; the intention of the authors is to give a guide to innovative use of the novel surface characterisation techniques. A large amount of biomedical experiments would be needed in the future to fully validate the correlation between the surface texture parameters and its biomedical functions but the present work provides a useful start point for a larger study.
2. Measurement conditions
etched surface is shown in Figure 1(a). The numerous micro-pores generated mainly by the acid etching process are clearly resolved. The AFM was then used to measure the geometric form of the micro-cells. Due to the re-entrant and relatively rough nature of the surface features, a sharp tip used in tapping mode (cantilever 910M-NSC15) was implemented to minimise the smoothing effect due to tip geometry. Two repeated measurements were carried out for each sample. A typical AFM measurement result (wavelengths over 8 m filtered out) is shown in Figure 1(b).
The protocol used for choosing the sampling conditions was as follows. Firstly, the instrument capability and the size of the features to be measured determine the sampling area. For example, for a particular micro-scale geometric structure, the minimum sampling area should cover at least a representative number of critical features. In order to make full use of the bandwidth and band resolution of the instruments employed, the maximum sampling size was chosen which was 256 by 256 points. To obtain statistically significant data, several continuous features should be covered within a sampling area. If the sampling area is too small it may not contain enough information and have less statistical significance. Thus the sampling area in this work was set as 10 m 10 m (the scale of the micro-features was around 2 m from visual examination of the SEM images and from previous experience).
3. Field parameters
The field parameters comprise of a number of different groupings: „height parameters‟, „spatial parameters‟, „hybrid parameters‟, „functional parameters‟ and others. After form removal by sequential levelling and 8 m L-filtering [15] large scale components of the AFM measurement results are removed as in Figure 1(b). Then the field parameters, listed in Table 1, were calculated. Also in Table 1, the F-test of the one-way ANOVA [14] is given.
One-way ANOVA is an efficient approach to test for differences among sample variances – it is usually applied to three or more groups of samples. For example, I groups of samples, each group having J test values, are chosen randomly from the same population. The statistical significance is tested by comparing the F statistic of the selected samples, thus:
MS1
F
MS2
where MS1 is the between-group variability, explained as the variations of the group means
2 1 1 ( ) 1 I i i
MS1 J x x
I
where
x
i is the within-group mean value, and x is the overall mean value, 1 1 J
i i j
j x x J
and , 1 11 I J i j i j
x x
IJ
.2 , 1 1 1 ( ) ( 1) I J
i j i i j
MS2 x x
I J
STD is the standard deviation of the overall samples,
2 2 , 1 1
1
(
)
1
I J i j i jSTD
x
x
IJ
.The F statistic reflects the differentiation of the parameters among the groups of samples. If the F value is greater than the critical value
1 2
(f f, )
F
which is 49.8 under the significance level = 0.005 in this study, there issignificant difference among the selected groups. In contrast if the F value is less than the critical value, the selected parameter can be seen as of potential significance. This does not indicate the significant parameters must be efficient for analysis of the current biomedical compliant surfaces, rather that they are statistically stable.
The analysis results are listed in Table 1. By using the one-way ANOVA method, the highlighted parameters (F > 49.8 under the significance level, = 0.005) are unstable for characterisation of the biomedical titanium surfaces. The remaining parameters could potentially be significant.
As presented earlier, surface roughness has proved indicative of surface functionality by other authors [3, 5]. However, conventional analysis methods (which use all the data at all scales) may be deficient if only the functionally significant topographic features need to be characterised. For example, to evaluate functionally significant attributes, such as the area and peak curvature of micro-scale cells caused solely by the etching process, the feature parameters should be used.
4. Feature parameters
4.1. Five steps to a feature parameter
The conventional surface texture parameters do not take individual surface features into consideration. Alongside the development of computing techniques and pattern recognition techniques, many groups [16-18] have combined the technologies to investigate novel characterisation techniques based on feature recognition. With this approach, a surface is considered as a stochastic or deterministic assembly of different scale features. Pattern recognition techniques such as „edge recognition‟ and „Wolf pruning‟ [19] are utilized to carry out topology analysis. These methods provide a stable approach for extracting features of functional interest by accurately excluding insignificant geometrical features that are induced, such as measurement noise.
Feature characterization analyzes a discrete surface that is generated by finite point sampling in accordance with a continuous surface in topology: for any continuous surface, the number of different features – peaks, pits, and saddle points – satisfies the Euler characteristic:
Number of peaks + Number of valleys – Numbers of saddles = Euler characteristic.
For example the Euler characteristic for a plane is two [16]. Another very important point is that all the critical geometrical features of a surface are connected by the so-called “change tree” [17]. Based on the Wolf pruning principle, the unwanted features are eliminated sequentially in the light of their insignificance degree.
4.2. Parameters calculation
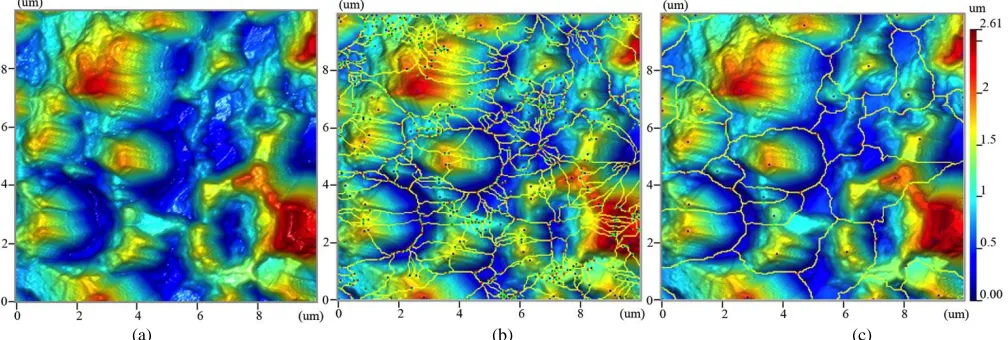
By selecting “hill” as the feature type and 5 % Sz as the Wolf pruning threshold the sample surfaces were segmented into a series of significant hills. The segmentation illustration of an AFM image is shown in Figure 2.
Five selected feature parameters Spd, Spc, S10z (ten point height of a surface), S5p (five point peak height of a surface) and S5v, which are defined in [10] and the other two user-defined parameters Svd (density of pits of a surface), Svc (arithmetic mean pit curvature of a surface), were calculated. These parameters reflect the basic geometric information of the micro-features. Complying to the feature characterisation convention [10], the two user-defined parameters are expressed as follows:
Svd = FC; D; Wolfprune: 5 %; All; Count; Density,
Svc = FC; V; Wolfprune: 5 %; All; Curvature; Mean.
A stability comparison is presented below for Spd and Spc as compared with their corresponding conventional versions – Sds and Ssc – which were previously defined in the “Birmingham 14” parameters [20]. The ANOVA analysis results are given in Table 2.
Taking sample S3 as an example, the calculated summit density Sds based on the 8-nearest neighbour method [17] gave a value of 3.28 106 mm-2, while the peak density Spd based on feature characterization by Wolf pruning at 5 % Sz was only 2.22 105 mm-2. Over 90 % of insignificant features (or noise) have been eliminated. The visual effect of the stabilization mechanism can be observed by comparing Figure 2(b) and 2(c).
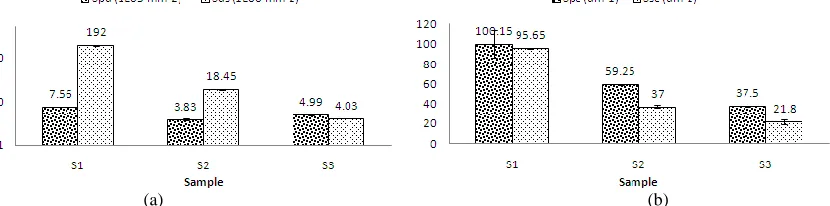
According to Table 2, it can be seen that all the selected feature parameters, with the exception of Spd and S5v (highlighted), have F values lower than the critical F statistic of 49.8. As mentioned earlier, these parameters would be potentially efficient for geometrical analysis of the biomedical implant surfaces. Note that the F values of the Spd and the Spc are less than the Sds and Ssc respectively. Although the value is higher than the critical F statistic, it can be understood that the feature parameters Spd and Spc are more robust than their conventional versions Sds and Ssc. An intuitive understanding of the stability can be found in a comparison graph of the four parameters. In Fig 4(a), Sds has a big variation among the three group means compared to Spd. Thus it can be thought that Sds displays a lack of robustness since the three samples have the same surface treatment. As for Ssc and Spc in Fig 4(b), although both the parameters have large variations among the group means, large variations within each group for Spc also exist which suggests instability. The instability in induced by overestimation of the noise peak points which has been discussed elsewhere [17, 21].
The F statistics of Spc and Svc, which are close to unity indicate that the two parameters may be promising as the new surface descriptors from the viewpoint of characterising functional attributes of implant surfaces.
Based on the stable parameter estimations, the overall arithmetic mean values for each feature attribute are calculated: the peak density Spd = (1.97 0.82) 105 mm-2; the peak curvature Spc = 32.6 14.6 m-1; the pit curvature Svc = 43.8 14.7 m-1 and the ten point height S10z = 1.57 0.23 m (at a confidence level of 68 %). Thus the micro-feature‟s area S and equivalent diameter D (assuming each feature is a circle) can be estimated as
1/
S
Spd
= 5.08 m2,2 S
D
4.3. Stability on sampling conditions
It is known that different sampling conditions (sampling area, size and interval) lead to different characterization results and the measurement results vary when different instruments are employed even using the same sampling conditions [20]. Roughness parameters are non-intrinsic parameters [22] and as a consequence they vary when the sampling conditions change. However, feature characterization exhibits its stability as shown in this section.
Sampling areas of 2 m by 2 m, 5 m by 5 m and 10 m by 10 m were sequentially tested on sample S1 in the same area. Each area was measured twice. To ensure that all the samples have the same maximum spectral components, all the samples are filtered by 2.5 m L-filtering [15]. Surface segmentation by Wolf pruning with thresholds at 7.44 %, 7.56 %, 6.85 %, 7.76 %, 5.22 % and 5 % Sz were implemented respectively to keep the pruning thresholds for all the samples the same. Thus the noise of the same altitude difference can be eliminated in different samples. In Figure 3, a segmentation illustration is shown.
Table 3 lists the ANOVA analysis results. Also an intuitive presentation of the statistic data is sketched in Fig 5. The high F statistic values of Sds and Ssc show significant differences among the three groups of data. This is understandable to some degree because they are captured using different sampling settings. However, the surprising F values of Sds and Ssc would make one to give an obvious conclusion that the three groups of data are significantly different. Since the three groups of data come from the same sample, the F statistics of Spd and Spc have indicated that they are a stable test. In particular, Spc (F value is less than 49.8) is believed to be distributed normally among the three surface samples, which indicates its significance.
Moreover, compared to the former results in Table 2 which come from the same sampling setting for different samples, it can be found the F statistic of Sds and Ssc have an illogical increase while the contrast of Spd and Spc is far more rational. Because of the limitation of the number of samples used in the present work it is considered that the results presented provide a simple practical demonstration of the stability of the feature parameters.
5. Conclusions
Surface topographies of three titanium samples fabricated by consecutive polishing, sandblasting and acid etching have been investigated. Feature parameters, based on pattern recognition techniques, have been used to uniquely characterize the micro-scale pores. Geometric parameters of the samples, such as the cell density, the mean cell diameter, the peak curvature and the pit curvature, have been extracted.
Based on a one-way ANOVA statistical analysis, the parameters such as Sdq, Vvv and most of the feature parameters such as Spc, Svc and S10z etc are highlighted as being statistically stable and hence promising for characterisation of functional features on biomedical titanium surfaces. However, it should be borne in mind that selection of significant parameters that are functionally correlated requires a large amount of experiments and empirical data. The techniques presented in the present study are thought to provide a general guide to the use of the advanced surface characterisation techniques. However, much more experimental data would need to be tested to fully validate the functional relevance of the approach.
Simultaneously, the efficiency and stability of the advanced parameter sets has been demonstrated based on ANOVA. It can be seen that most of the feature parameters have sound statistical stability compared with the more generally used field parameters. Based on statistical evidence, novel surface feature parameters can be assumed to be more effective in predicting functionality of bio-implant surfaces.
Acknowledgements
Wolfson Research Merit Award and the European Research Council under its programme ERC-2008-AdG 228117-Surfund.
References
1. Le Guéhennec, L., et al., Surface treatments of titanium dental implants for rapid osseointegration. Dental Materials, 2007. 23(7): p. 844-854.
2. Shalabi, M.M., et al., Implant Surface Roughness and Bone Healing: a Systematic Review. Journal of Dental Research, 2006. 85(6): p. 496-500.
3. Hatano, K., et al., Effect of surface roughness on proliferation and alkaline phosphatase expression of rat calvarial cells cultured on polystyrene. Bone, 1999. 25(4): p. 439-445.
4. Mustafa, K., et al., Determining optimal surface roughness of TiO2 blasted titanium implant material for attachment, proliferation and differentiation of cells derived from human mandibular alveolar bone. Clinical Oral Implants Research, 2001. 12(5): p. 515-525.
5. Sul, Y.-T., et al., The roles of surface chemistry and topography in the strength and rate of osseointegration of titanium implants in bone. Journal of Biomedical Materials Research Part A, 2009. 89A(4): p. 942-950.
6. Lonardo, P.M., H. Trumpold, and L. De Chiffre, Progress in 3D Surface Microtopography Characterization. CIRP Annals - Manufacturing Technology, 1996. 45(2): p. 589-598.
7. Whitehouse, D.J., The parameter rash -- is there a cure? Wear, 1982. 83(1): p. 75-78.
8. De Chiffre, L., et al., Quantitative Characterisation of Surface Texture. CIRP Annals - Manufacturing Technology, 2000. 49(2): p. 635-642, 644-652-635-642, 644-652.
9. Peng, Z., Osteoarthritis diagnosis using wear particle analysis technique: Investigation of correlation between particle and cartilage surface in walking process. Wear, 2007. 262(5-6): p. 630-640.
10. ISO/FDIS 25178-2:, Geometrical product specification (GPS) - Surface texture: areal - part 2: terms, definitions and surface texture parameters. 2010.
11. Leach, R., Fundamental Principles of Engineering Nanometrology. 2009: Elsevier Science Ltd. 12. Scott, P.J., Feature parameters. Wear, 2009. 266(5-6): p. 548-551.
13. Scott, P.J., Pattern analysis and metrology: the extraction of stable features from observable measurements. Proceedings of the Royal Society A 2004. 460: p. 2845-2864.
14. Tabachnick, B.G. and L.S. Fidell, Using Multivariate Statistics 4th edition. 2001: Allyn & Bacon.
15. ISO/DIS 25178-3:, Geometrical product specification (GPS) - Surface texture: areal - part 3: Specification operators. 2008.
16. Takahashi, S., et al., Algorithms for Extracting Correct Critical Points and Constructing Topological Graphs from Discrete Geographical Elevation Data. Computer Graphics Forum, 1995. 14(3): p. 181-192. 17. Scott, P.J., B. Liam, and J. Xiangqian, Novel Areal Characterisation Techniques, in Advanced Techniques
for Assessment Surface Topography. 2003, Kogan Page Science: Oxford. p. 43-61.
18. Kweon, I.S. and T. Kanade, Extracting topographic terrain features from elevation maps. CVGIP: Image Underst., 1994. 59(2): p. 171-182.
19. Wolf, G.W., A FORTRAN subroutine for cartographic generalization. Comput. Geosci., 1991. 17(10): p. 1359-1381.
20. Stout, K., et al., Development of Methods for the Characterisation of Roughness in Three Dimensions. 1993: University of Birmingham.
21. Blunt, L. and S. Ebdon, The application of three-dimensional surface measurement techniques to characterizing grinding wheel topography. International Journal of Machine Tools and Manufacture, 1996. 36(11): p. 1207-1226.
22. Thomas, T.R. and B.G. Rosén, Determination of the optimum sampling interval for rough contact mechanics. Tribology international, 2000. 33(9): p. 601-610.
(a) (b)
Figure 1. (a) Stereo SEM image of a representative titanium sample surface. (b) AFM image of sample S3 (form removal by levelling and 8 m L-filtering).
(a) (b) (c)
[image:8.612.55.559.326.496.2]Figure 3. Hill segmentation of 2 m 2 m, 5 m 5 m and 10 m 10 m (from left to right) sized AFM measurement results of sample S1.
[image:9.612.93.518.301.546.2](a) (b)
Figure 4. Comparison of means and variations of Spd and Sds, Spc and Ssc for the three titanium samples
(a) (b)
Figure 5. Comparison of means and variations of Spd and Sds, Spc and Ssc for stability tests using different sampling settings.
Table 1. ANOVA analysis ofthe field parameters for titanium samples which have been fabricated by consecutive polishing, sandblasting and acid etching. Two repeated measurements were carried out for each sample, for example, sample S1 was measured two times which were individually coded as S1.1 and S1.2.(Sa: arithmetic mean height; Sq: root mean square height; Sp: maximum peak height; Sv: maximum pit height; Sz: maximum surface height; Ssk: skewness; Sku: kurtosis; Sal: autocorrelation length; Str: texture aspect ratio; Sdq: root mean square gradient; Sdr: developed interfacial area ratio; Smr: areal material ratio at 1 m under the highest peak; Sdc: height at the material ratio 10 %; Sxp: height difference between the material ratio 50 % and 97.5 %; Vvv: dale void volume at the material ratio 80 %;
Vvc: core void volume between the material ratio 10 % and 80 %; Vmp: peak material volume at the material ratio 10 %; Vmc: core material volume between the material ratio 10 % and 80 %. Sk family can be referred to ISO 13565-2 [23]. The highlighted parameters are those where F is greater than 49.8)
SAMPLES S 1.1 S 1.2 S 2.1 S 2.2 S 3.1 S 3.2 STD MS1 MS2 F
[image:9.612.97.515.304.409.2] [image:9.612.103.518.442.545.2]Sa (m) 0.3 0.303 0.465 0.474 0.394 0.401 0.390 0.075 0.014 2.3E-5 613
Sq (m) 0.381 0.389 0.563 0.57 0.488 0.494 0.481 0.082 0.017 2.5E-5 670
Sp (m) 1.256 1.303 1.534 1.594 1.572 1.554 1.468 0.149 0.054 1.0E-3 52.6
Sv (m) 1.318 1.478 1.671 1.741 1.060 1.056 1.387 0.295 0.21 5.1E-3 41.3
Sz (m) 2.575 2.781 3.205 3.334 2.632 2.610 2.856 0.330 0.258 9.9E-3 26.0
Ssk 0.339 0.176 0.08 0.082 0.528 0.556 0.294 0.215 0.108 4.6E-3 23.7
Sku 3.136 3.399 2.457 2.402 2.968 2.957 2.887 0.389 0.360 0.0121 29.9
Spacing
Sal (m) 0.994 0.976 0.976 0.953 1.00 1.00 0.983 0.018 6.4E-4 1.4E-4 4.47
Str 0.433 0.42 0.707 0.677 0.427 0.392 0.509 0.143 0.050 3.8E-4 131
Hybrid
Sdq 1.315 1.266 1.338 1.378 1.419 1.429 1.358 0.063 8.9E-3 6.8E-4 13.0
Sdr (%) 67.55 65.76 75.01 78.25 83.98 84.55 75.85 7.99 156.0 2.338 66.7
Functional
Smr (%) 26 21.1 19.8 17.1 12.8 13.8 18.43 4.923 52.53 5.383 9.76
Sdc (m) 0.491 0.481 0.734 0.740 0.636 0.652 0.622 0.113 0.032 6.5E-5 493
Sxp (m) 0.712 0.782 1.01 1.02 0.776 0.758 0.843 0.136 0.045 8.9E-4 50.2
Functional - Sk family
Spk (m) 0.375 0.4 0.392 0.373 0.505 0.518 0.427 0.066 0.011 1.9E-4 55.5
Sk (m) 0.943 0.913 1.667 1.726 1.358 1.362 1.328 0.345 0.297 7.3E-4 405
Svk (m) 0.414 0.477 0.489 0.463 0.259 0.259 0.394 0.107 0.028 7.7E-4 35.7
Smr1 (%) 11 10.3 6.5 5.9 9.4 9.7 8.8 2.095 10.7 0.157 68.6
Smr2 (%) 89.6 87.2 93.2 93.8 94.1 94.3 92.03 2.938 20.0 1.027 19.5
Functional - Volume related
Vvv ( 104
m3/mm2) 3.93 4.29 4.72 4.76 3.50 3.42 4.10 0.587 0.819 0.023 35.7
Vvc (
m3/mm2) 4.54 4.38 6.83 6.92 6.00 6.12 5.80 1.10 3.01 8.0E-3 377
Vmp (
m3/mm2) 2.16 2.34 2.43 2.40 3.18 3.30 2.63 0.480 0.56 8.0E-3 70.8
Vmc (
[image:10.612.47.566.597.714.2]m3/mm2) 3.35 3.45 5.60 5.66 4.61 4.62 4.55 0.999 2.49 2.3E-3 1091
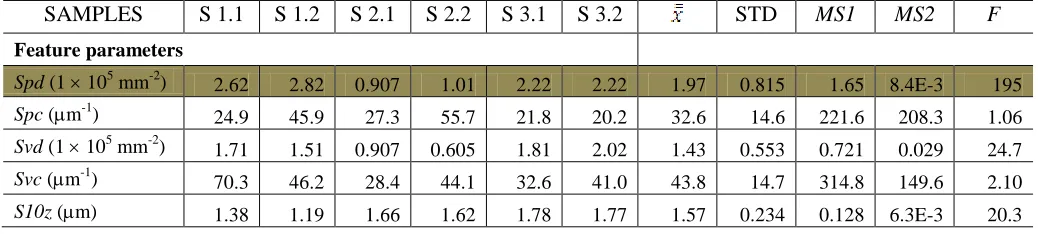
Table 2. ANOVA analysis of feature parameters Spd, Spc, Svd, Svc, S10z, S5p, S5v and the conventional “Birmingham 14” parameters Sds,
Ssc for titanium sample images (pre-processed by levelling and 8 m L-filtering to remove large scale components; brief explanations of the parameters can be found above; The highlighted parameters are those with F greater than 49.8).
SAMPLES S 1.1 S 1.2 S 2.1 S 2.2 S 3.1 S 3.2 STD MS1 MS2 F
Feature parameters
Spd (1 105 mm-2) 2.62 2.82 0.907 1.01 2.22 2.22 1.97 0.815 1.65 8.4E-3 195
Spc (m-1) 24.9 45.9 27.3 55.7 21.8 20.2 32.6 14.6 221.6 208.3 1.06
Svd (1 105 mm-2) 1.71 1.51 0.907 0.605 1.81 2.02 1.43 0.553 0.721 0.029 24.7
Svc (m-1) 70.3 46.2 28.4 44.1 32.6 41.0 43.8 14.7 314.8 149.6 2.10
S5p (m) 0.771 0.633 0.747 0.727 1.06 1.06 0.833 0.182 0.078 3.2E-3 24.0
S5v (m) 0.605 0.559 0.909 0.890 0.711 0.711 0.731 0.144 0.051 4.1E-4 123
“Birmingham 14” parameters
Sds (1 106 mm-2) 1.98 1.87 6.78 7.23 3.28 2.95 4.02 2.38 14.1 0.054 261
[image:11.612.45.565.216.410.2]Ssc (m-1) 27.0 22.5 33.9 38.6 19.4 19.4 26.8 7.97 148.2 7.06 21.0
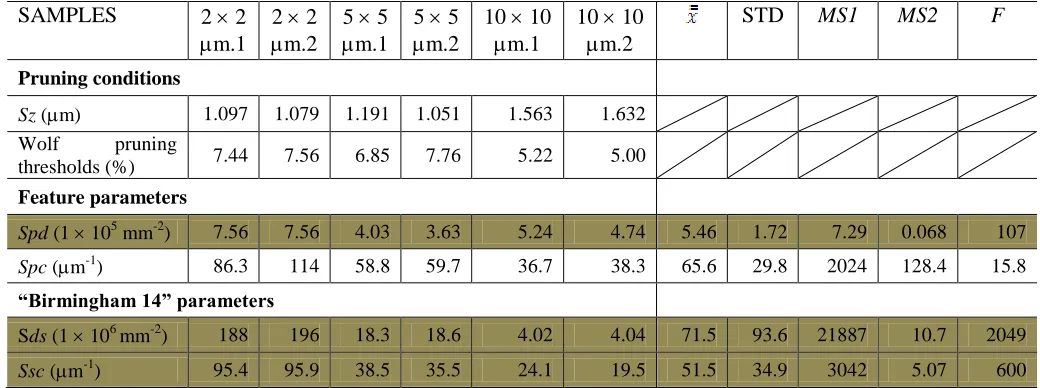
Table 3. Comparison of the feature parameter Spd, Spc and their conventional “Birmingham 14” parameter Sds, Ssc for different sampling conditions using sample S1 (pre-processed by 2.5 m L-filtering to retain the same maximum spectral components; explanations of the selected parameters can be found above; The highlighted parameters are those with F greater than 49.8).
SAMPLES 2 2 m.1
2 2 m.2
5 5 m.1
5 5 m.2
10 10 m.1
10 10 m.2
STD MS1 MS2 F
Pruning conditions
Sz (m) 1.097 1.079 1.191 1.051 1.563 1.632
Wolf pruning
thresholds (%) 7.44 7.56 6.85 7.76 5.22 5.00
Feature parameters
Spd (1 105 mm-2) 7.56 7.56 4.03 3.63 5.24 4.74 5.46 1.72 7.29 0.068 107
Spc (m-1) 86.3 114 58.8 59.7 36.7 38.3 65.6 29.8 2024 128.4 15.8
“Birmingham 14” parameters
Sds (1 106 mm-2) 188 196 18.3 18.6 4.02 4.04 71.5 93.6 21887 10.7 2049