Title: The crime-crime prevention relationship: A Manchester case study. Authors: Alex Hirschfield and Andrew Newton
ABSTRACT
Crime data analysis and the identification of crime ‘hot spots’ is now commonplace in police forces and local authorities in Britain. Significantly less attention has been paid to the systematic collection and analysis of data on crime prevention. This reflects a preoccupation with the problems (crime, anti social behaviour) and the context in which they occur (areas with poor natural surveillance, know crime generators) but a lack of attention to the attributes of the response (what is being done where, when and in what dosage). This paper breaks new ground by relating a crime problem, domestic burglary, to a burglary-prevention intervention (Target Hardening) using data for the City of Manchester in NW England. The results show a degree of mismatch between allocation of crime prevention and concentrations of burglary. The implications for further research and developments in this area are discussed.
Introduction
Much of the empirical research on exploring crime in urban areas focuses upon the spatial and temporal distribution of recorded crime and ‘incidents’ such as anti-social behaviour, neighbour disputes and other incivilities.
Using various combinations of recorded crime, incidents and contextual data on populations and land use, researchers and crime analysts typically go on to produce material that identifies the magnitude, concentration and prevalence of crime and disorder in urban areas. This might show how crime levels and patterns compare with other areas and in some cases how these patterns and comparisons change over time (Hirschfield, 2005). Outputs are often in the form of crime rate league tables, graphs and maps that reveal geographical and temporal ‘hot spots’. The latter are sometimes superimposed upon base maps depicting street networks, building foot prints and socio-demographic data (e.g. residential neighbourhood classifications). These types of analysis can produce useful insights into the manifestation of crime and disorder in urban areas and how these relate to other aspects of the physical and social environment (Chainey and Ratcliffe, 2006).
In common with other forms of analysis that profile urban problems (e.g. studies of deprivation, health inequalities, housing stress), the focus is predominantly problem-oriented. It concentrates on the manifestation of problems experienced within and by communities that need to be resolved through more effective policy interventions. The predominant concern is with the demand side; the nature and extent of needs within the community for a safer, fairer and healthier society.
2
The fact that crime data analysis widely is practised in Britain is not surprising given the long tradition of reporting and recording crime. The Home Office has a coding scheme for different types of offence that is adopted by all police forces in England and Wales. Attempts are also being made towards achieving consistency in the recording of calls for service to the police (Home Office et al, 2007; Audit Commission 2006).
However, there are no equivalent arrangements for reporting, or indeed, recording what has been done in terms of crime prevention interventions. Local databases may be constructed for some interventions but this is unsystematic and on an ad hoc basis. The Home Office does not have a coding frame for classifying interventions nor does any agency at national level. In fact, this is not routinely undertaken at any level of governance.
Just by considering the possibility of being able to produce such information raises the prospect of being able to explore entire new research areas. If sufficiently detailed information on the type, location, timing, source and levels of crime prevention activity could be made available it would be possible to pose and attempt to answer questions such as:
How geographically concentrated is crime prevention within different urban areas and neighbourhoods?
What is being implemented where and by whom?
Which areas have significantly high and significantly low levels of crime prevention investment?
Do areas with high levels of one type of crime prevention have high levels of another?
There are obvious parallels with crime data analysis in terms of deriving crime prevention prevalence rates (e.g. per capita) and identifying hot spots of crime prevention activity. New variables, indices and analytical approaches may need to be developed to measure the alignment between the location and timing of crime and that of crime prevention. This begs the question of the extent to which crime pattern analysis tools (e.g. spatial overlap analysis, Nearest Neighbour Analysis, Kernel Density Estimation,) can be used to analyse crime prevention activity patterns. Research questions that arise when relating crime prevention to crime might include:
How do crime prevention measures correspond to the location and timing of different types of crime?
How far is there an ‘inverse prevention law’ (i.e. where areas with lower crime receive more attention)?
Is there a variation in crime prevention investment across communities with similar levels and patterns of crime?
How can the coalescence between crime prevention and crime risk be measured?
How can crime prevention be better aligned with crime risk?
3
The ability to provide answers to such questions is bound to have policy implications. This would be especially true if such analyses identify substantial duplication of activity, mismatches between the timing, location and nature of urban crime problems and the policy response, contradictory interventions and a lack of synergy. The outcome might be a call for rationalizing agency responses to crime. Alternatively, a comparative analysis of crime prevention and crime might shed light on how far crime change can be attributed to policy interventions; the inability to do so being a persistent dilemma that confronts most policy evaluators (Pawson and Tilley, 1997, Eck, 2005).
The addition of policy data introduces a new dimension to crime analysis. It also potentially modifies existing, largely problem-focused resource allocation models for crime prevention.
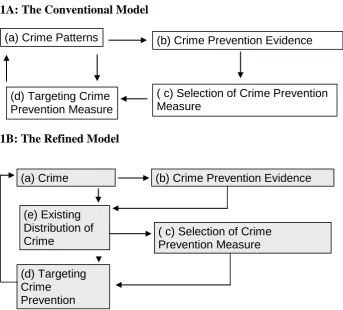
A simplified conventional crime prevention decision making model is shown in Figure 1a. It begins with the use of crime data and crime pattern analysis to identify local crime problems (a). The evidence base of ‘what works’ in crime prevention (e.g. Home Office toolkits) is then interrogated (b) and this informs potentially effective policy interventions that are short-listed, appraised, costed and selected (c). These are then tailored to local crime problems and targeted to where and when offences are found using intelligence from crime pattern analysis (d). Hopefully the interventions will impact upon crime. However, in applying this model there is the question as to whether it is sufficient to implement intervention policies based solely upon crime and land use data.
[image:3.595.90.434.456.766.2]
Figure 1 Simplified Models of Crime Prevention Resource Allocation
1A: The Conventional Model
1B: The Refined Model
(a) Crime Patterns
(b) Crime Prevention Evidence Base
( c) Selection of Crime Prevention Measure (d) Targeting
Crime Prevention Measure
(e) Existing Distribution of Crime
Prevention
(a) Crime Patterns (b) Crime Prevention Evidence Base
( c) Selection of Crime Prevention Measure
4
The inclusion of crime prevention activity data adds a new stage to the model. This is shown in Figure 1b. In the modified model, crime pattern analysis still plays a role (a) and knowledge on best practice in crime prevention is still accessed (b). The difference is that there then follows a systematic analysis of what is being provided already in terms of crime prevention and how this relates to crime(c). Intelligence on this informs both the selection of appropriate interventions (e.g. to maximise synergy with what currently exists)(d) and decisions on where, when and how they are to be deployed(e).
By combining intelligence on both crime and prevention activity, the refined model can be used to identify where there are gaps in current provision, to alter the deployment of existing measures (where feasible) and to coalesce with crime and maximise synergy with new interventions.
The above discussion provides a flavour of the breadth of issues that would need to be resolved in what is clearly a research frontier. Some of the questions posed above can be explored in part by examining, in some detail, the relationship between a specific crime category and a tried and tested method of crime prevention. The rest of this paper describes the aims, methods and results of a study of a crime problem, domestic burglary, and a policy response, target hardening, within the City of Manchester. It breaks new ground by bringing together data on the two in order to shed light on how the dispensation of target hardening over space and time relates to that of domestic burglary.
The Manchester Project
Burglary has been a key priority for Manchester Crime and Disorder Reduction Partnership (CDRP) since its inception following the 1998 Crime and Disorder Act. From 2001 the CDRP secured funding from the Government’s Neighbourhood Renewal Unit as part of the Places Project. The latter represented a collaborative approach between central and local government piloting work with three selected local authority districts - Manchester, Nottingham and Southwark - to explore the action needed to accelerate progress towards meeting government performance targets (Neighbourhood Renewal Unit, 2004). Burglary was chosen in Manchester because of the large fluctuations in the rates of burglary the need for the City to meet its Public Service Agreement target in 2003/4.
Extensive scrutiny from this initiative identified a need to provide better evaluation of crime reduction initiatives, by using a more targeted approach to analysis and evaluation. Government Office North West and Manchester City Council commissioned the University of Huddersfield to carry out some of this evaluation research and also to support and train Manchester’s crime analyst so that she could continue to provide this information post project.
5
window locks, bolts, security chains, alarms and other measures to residential dwellings in order to deter offenders (Hamilton-Smith and Kent, 2005).
This was to be examined across the City generally but also in greater depth within two target wards where burglary levels were identified as being particularly high. The wards in question were those of Harpurhey and Longsight. Both neighbourhoods were areas of substantial disadvantage but were distinctive in terms of their demographic profiles. Longsight had a sizeable student population, high unemployment and an over-representation of BME groups; 36% were Asian or Asian British and 9% were black or black British. Harpurhey also experienced high unemployment and social deprivation but had a predominantly white population (92%) and was not a student area.
The availability of comprehensive data on target hardening activity from the City of Manchester spanning four years provided an opportunity to tabulate, map and analyse burglary and the response to burglary on equal terms. Both the burglary and target hardening data have been captured at the individual address level, cover overlapping time periods, and contain a wealth of information. For burglary, this included address, postcode, police beat and ward, time of day, day of week, the offender’s Modus Operandi (MO), and the outcome in terms of an attempted or successful burglary. For target hardening, information was provided on address, start date and completion date, whether proactive or reactive, housing tenure, and contractor. Both data sets can be mapped at the address level using a 12 figure grid reference that pinpoints the property to a one metre accuracy.
Some Important Questions
The research results presented in this paper focus predominantly on the spatial
patterns of burglary and target hardening activity and how the combination of the two can inform resource allocation.
It was envisaged at the outset that the data would allow a number of questions to be explored. Some of these were posed at the aggregate or area level and could be explored by tabulating data on burglary and target hardening activity for the City’s 32 wards.
Analyses at ward level enabled questions to be explored about the geography of burglary and that of target hardening. For example, which wards had the highest burglary rates? Was there any change in the membership of this group of the ‘worst wards’ over time? What proportion of the City’s households did they contain? What proportion of the City’s burglaries? Was the share of the burglaries in proportion to that of the households? Were there any marked changes in the prevalence and in the concentration of burglary by ward over time?
6
As well as a focus on these key questions, the study also sought to establish how far the target hardening programme had resulted in an improvement in the positions of the two target wards on domestic burglary relative to the rest of Manchester. This would involve examining whether, over time, the gap in burglary rates between these two wards and the remainder of Manchester had narrowed (representing ‘convergence’) or indeed, had widened (i.e. divergence). Although it was possible to identify how far this had occurred using the burglary data, further analysis was required of the target hardening data to be able to correlate any observed changes in burglary to target hardening investment. Thus the gap between the two wards and the rest of Manchester in the target hardening rate (i.e. target hardened properties per 1,000 households) had to be calculated and tracked over time.
For certain analyses, other spatial units were used including the 2001 Census Output Areas and individual streets.
Although the target hardening records contained a wealth of information they did not document what was carried out at each address or how much was spent on target hardening measures. Therefore, it was not possible to look at the relationship between the intensity of target hardening activity (policy dosage)and subsequent outcomes.
Data and Methodology
The study used a range of data sets provided by the community safety team at Manchester City Council. These comprised:
Police recoded crime data on domestic burglary spanning the period April 2002 through to end of March 2005 (26,939 cases);
Population denominators for Manchester Wards from the 2001 Census;
Target Hardening Activity Data for the period January 2001 through to the end of May 2005 (16,776 cases);
The Ordnance Survey ADDRESS-POINT® Gazetteer covering Greater Manchester.
The burglary data and target hardening records were imported into the MapInfo Geographical Information Systems (GIS) software (MapInfo 7.5) and the Statistical Package for the Social Sciences (SPSS) Version 12 for processing and analysis. The MapInfo software was used for geo-coding (i.e. generating a mappable grid reference for each address), for mapping points (e.g. individual and repeat burglaries, target hardened properties) and for displaying burglary ‘hot spots’ and target hardened properties in relation to land use features (e.g. the street network).
Once in a GIS, the burglary and target hardening records were related to other geographies for which digital boundary information is available. Thus the GIS was used to identify which cases occurred within each ward, police beat and Census Output Area. Aggregate statistics were then produced giving the number of burglaries and target hardened properties in each zone.
7
financial year, was derived. Similarly, aggregated target hardening data was produced giving the number of completions by month, and quarterly period for each area.
The following analyses were conducted using these data sets:
Derivation of burglary/ target hardening counts, prevalence rates and concentration rates for Manchester wards;
Derivation of target ward versus rest of Manchester ratios for burglary and target hardening by financial year and quarterly time periods;
Correlation analysis between target hardening rates and burglary rates for Manchester Wards at different points in time;
Point mapping of burglaries and target hardened properties within each target ward;
Mapping of the top 15 streets for target hardening within each target ward in relation to the distribution of burglaries and repeat burglaries;
Derivation of measures of geographical clustering for burglaries (Nearest Neighbour Analysis);
Production of Resource Targeting Tables of burglary and target hardening at street level within each of the two target wards;
Measurement of the degree of convergence and divergence between the two target wards and the rest of Manchester in burglary and in target hardening rates by quarter for each financial year.
Changes in both domestic burglary and the delivery of target hardening were explored across all wards in the City of Manchester, within the two target areas for the Places Initiative (Longsight and Harpurhey) and in the rest of Manchester City (i.e. Manchester minus the two target wards). More in-depth analyses using disaggregate address-level data enabled the concentration of both burglary and target hardening activity to be identified at individual street level.
8
Key Findings
Burglary and Target Hardening across Manchester City
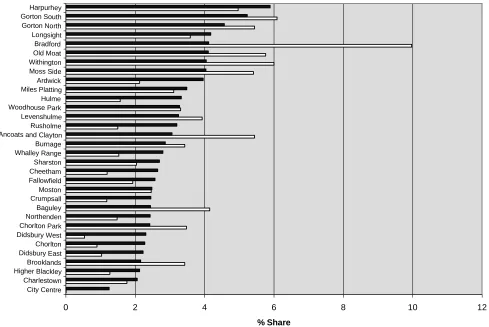
The availability of data for the whole of Manchester enabled some strategic analyses to be conducted on the overall patterning of burglary and target hardening across Manchester’s wards. Figure 2 shows the percentage of all of Manchester’s burglaries (2002/3 – 2004/5) and target hardened properties (2001/02 – 2004/05) in each of Manchester’s 32 electoral wards. There was a notable difference between the two. Target hardening was more unevenly distributed and was not necessarily allocated to wards with the greatest number of burglaries. Bradford Ward alone saw 10% of all the City’s target hardening but contained just over 4% of Manchester’s burglaries and 3.3% of its households. If the aim of crime prevention is to target resources in proportion to the size of the problem this does not seem to have happened in this case
It is interesting to speculate that if confronted with a picture such as this early on whether or not the City Council would have altered its resource allocation. At least having data on crime prevention provides intelligence on how scarce resources might be better deployed.
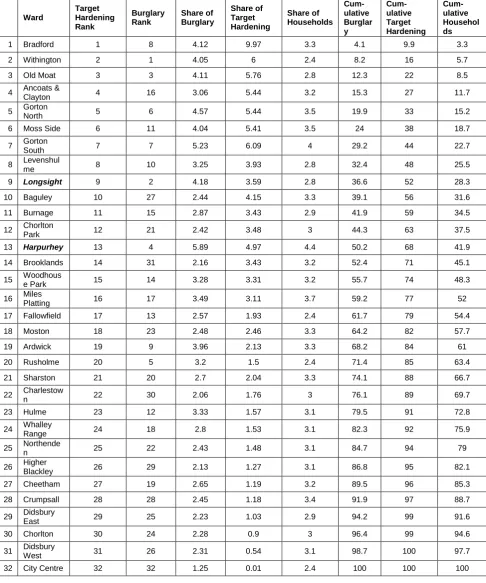
Table 1 compares each ward’s rank on target hardening with that on domestic burglary. The proportion of target hardening activity and the share Manchester's burglary accounted for by each ward is revealed and the percentage of the City’s households concentrated in each ward is also shown..
As is clear from both Table 1 and Figure 2, target hardening was more geographically concentrated than domestic burglary; 52% of all target hardening went into just nine of the 32 wards that collectively contained just over one-third of all domestic burglaries (36.6 per cent, Table 1). At the other end of the scale there were ten wards that had less than 10% of the City's target hardening but accounted for 25% of all burglaries.
Despite these contrasts, there was some evidence of a relationship between each ward’s rank on burglary and that on target hardening. The Spearman's Rank correlation coefficient between the two was positive and significant (0.674 at the 0.01 level). In other words, higher ranks on target hardening activity were generally associated with higher ranks on burglary rates.
Ward-level Shares of Burglary and Target Hardening
0 2 4 6 8 10 12
City Centre Charlestown Higher Blackley
Brooklands Didsbury East Chorlton Didsbury West
Chorlton Park Northenden
Baguley Crumpsall
Moston Fallowfield Cheetham
Sharston Whalley Range
Burnage Ancoats and Clayton
Rusholme Levenshulme Woodhouse Park
Hulme Miles Platting
Ardwick Moss Side Withington
Old Moat Bradford Longsight Gorton North Gorton South
Harpurhey
% Share
Share of Burglary
[image:9.842.123.612.145.472.2]Share of Target Hardening Figure 2 The concentration of burglary and target hardening in each ward
Table 1 Ranks on burglary and target hardening for Manchester Wards (Financial years 2002/ - 2004/05)
Ward
Target Hardening Rank
Burglary Rank
Share of Burglary
Share of Target Hardening
Share of Households
Cum- ulative Burglar y
Cum- ulative Target Hardening
Cum- ulative Househol ds 1 Bradford 1 8 4.12 9.97 3.3 4.1 9.9 3.3 2 Withington 2 1 4.05 6 2.4 8.2 16 5.7 3 Old Moat 3 3 4.11 5.76 2.8 12.3 22 8.5
4 Ancoats &
Clayton 4 16 3.06 5.44 3.2 15.3 27 11.7 5 Gorton
North 5 6 4.57 5.44 3.5 19.9 33 15.2 6 Moss Side 6 11 4.04 5.41 3.5 24 38 18.7
7 Gorton
South 7 7 5.23 6.09 4 29.2 44 22.7 8 Levenshul
me 8 10 3.25 3.93 2.8 32.4 48 25.5 9 Longsight 9 2 4.18 3.59 2.8 36.6 52 28.3 10 Baguley 10 27 2.44 4.15 3.3 39.1 56 31.6 11 Burnage 11 15 2.87 3.43 2.9 41.9 59 34.5
12 Chorlton
Park 12 21 2.42 3.48 3 44.3 63 37.5 13 Harpurhey 13 4 5.89 4.97 4.4 50.2 68 41.9 14 Brooklands 14 31 2.16 3.43 3.2 52.4 71 45.1
15 Woodhous
e Park 15 14 3.28 3.31 3.2 55.7 74 48.3 16 Miles Platting 16 17 3.49 3.11 3.7 59.2 77 52
17 Fallowfield 17 13 2.57 1.93 2.4 61.7 79 54.4
18 Moston 18 23 2.48 2.46 3.3 64.2 82 57.7 19 Ardwick 19 9 3.96 2.13 3.3 68.2 84 61 20 Rusholme 20 5 3.2 1.5 2.4 71.4 85 63.4 21 Sharston 21 20 2.7 2.04 3.3 74.1 88 66.7
22 Charlestow
n 22 30 2.06 1.76 3 76.1 89 69.7 23 Hulme 23 12 3.33 1.57 3.1 79.5 91 72.8
24 Whalley
Range 24 18 2.8 1.53 3.1 82.3 92 75.9 25 Northende
n 25 22 2.43 1.48 3.1 84.7 94 79 26 Higher
Blackley 26 29 2.13 1.27 3.1 86.8 95 82.1 27 Cheetham 27 19 2.65 1.19 3.2 89.5 96 85.3 28 Crumpsall 28 28 2.45 1.18 3.4 91.9 97 88.7
29 Didsbury
East 29 25 2.23 1.03 2.9 94.2 99 91.6 30 Chorlton 30 24 2.28 0.9 3 96.4 99 94.6
31 Didsbury
11
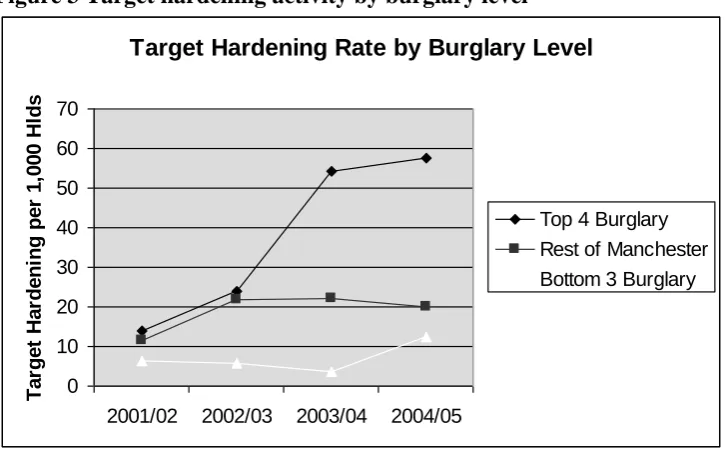
Figure 3 shows the rate of target hardening per 1,000 households in the four wards with the highest burglary rates in all three years (these included Harpurhey and Longsight), the three wards with the lowest rates and the rest of Manchester.
In the first two years of target hardening, there was very little difference in the target hardening rates between the top four wards on domestic burglary and the rest of Manchester. However, a sizeable difference opens up in the last two financial years with the target hardening rate significantly higher in the highest burglary areas than the rest of Manchester. The target hardening rate is lowest in the lowest burglary wards throughout but with rises to converge with that in the rest of Manchester by 2004/05. This implies that target hardening, although initially missing the worst areas, has increasingly been channelled into the highest crime areas during the last two years, although there are still anomalies.
Figure 3 Target hardening activity by burglary level
Target Hardening Rate by Burglary Level
0 10 20 30 40 50 60 70
2001/02 2002/03 2003/04 2004/05
T
a
rg
e
t
H
a
rd
e
n
in
g
p
e
r
1
,0
0
0
H
ld
s
Top 4 Burglary Rest of Manchester Bottom 3 Burglary
NotesHigh burglary rates (top 4 wards) exceeding 1 standard deviation above the mean in: 2002/03 >65.9 burglaries per 1,000 households
2003/04 >64.6 burglaries per 1,000 households 2004/05 >49.9 burglaries per 1,000 households
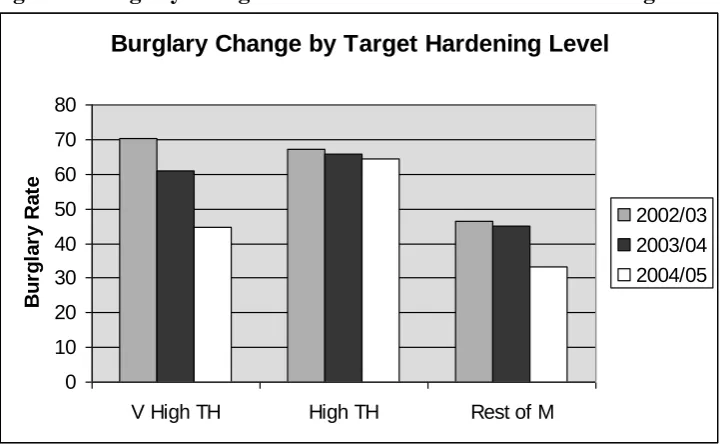
A further question is that of what has happened to burglary rates in wards that had the highest levels of target hardening. To explore this, two groups of wards were identified. The first group were those with very high target hardening rates (i.e. significantly above the mean in two of the four years). The six wards that met this criterion (with their rank out of 32 on their overall share of burglary in brackets) were Ancoats and Clayton(4), Bradford(8), Levenshulme(10), Moss Side(11), Old Moat(3) and Withington(1).
[image:11.595.93.456.277.503.2]12
[image:12.595.94.458.141.363.2]Figure 4 shows the burglary rates for each group in each year. There is evidence here that the wards with the highest rates for target hardening saw the greater reductions in burglary in each of the three years.
Figure 4 Burglary change for Wards with different levels of target hardening
Burglary Change by Target Hardening Level
0 10 20 30 40 50 60 70 80
V High TH High TH Rest of M
B
u
rg
la
ry
R
a
te
2002/03 2003/04 2004/05
Notes: TH = Target Hardening activity Rest of M = Rest of Manchester City
The two Target Wards
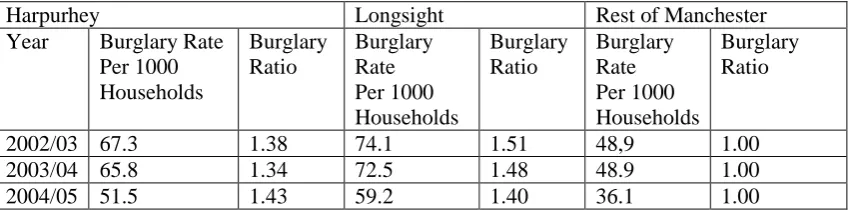
The association between burglary rates and target hardening was not particularly strong in Longsight and Harpurhey. These were ranked 9th and 13th, respectively, on target hardening but 2nd and 4th on domestic burglary (Table 1). Table 2 shows the burglary rate in each ward for each year and expresses this as a ratio to the burglary rate in the rest of Manchester.
13 Table 2 Burglary rates and ratios
Harpurhey Longsight Rest of Manchester
Year Burglary Rate
Per 1000 Households
Burglary Ratio
Burglary Rate Per 1000 Households
Burglary Ratio
Burglary Rate Per 1000 Households
Burglary Ratio
2002/03 67.3 1.38 74.1 1.51 48,9 1.00
2003/04 65.8 1.34 72.5 1.48 48.9 1.00
2004/05 51.5 1.43 59.2 1.40 36.1 1.00
[image:13.595.86.514.393.525.2]Table 3 shows target hardening rates and ratios in the two target wards and in relation to the rest of Manchester. There is a clear difference between the two wards in these rates over time. Harpurhey is characterised by initial intensive activity in 2001/02 but then reducing rates in 2002/03 and 2003/04 followed by an increase in 2004/05. Longsight displays a more stable pattern in the level of target hardening throughout the period. The position in the rest of Manchester was different again. Here target hardening activity was relatively low in 2001/02, doubled in 2002/03, rose again in 2003/04 and reduced slightly in 2004/05. The target hardening ratios were generally higher in the two target wards than in the rest of Manchester but fluctuate over time, particularly in Harpurhey.
Table 3 Target hardening rates and ratios
Harpurhey Longsight Rest of Manchester
Year Target
Hardening Rate Per 1000 Households
Target Hardening Ratio
Target Hardening Rate Per 1000 Households
Target Hardening Ratio
Target Hardening Rate Per 1000 Households
Target Hardening Ratio
2001/02 35.1 2.97 20.4 1.72 11.8 1.00
2002/03 23.4 1.04 27.0 1.20 22.5 1.00
2003/04 7.4 0.28 31.4 1.21 25.8 1.00
2004/05 30.9 1.29 31.0 1.30 23.8 1.00
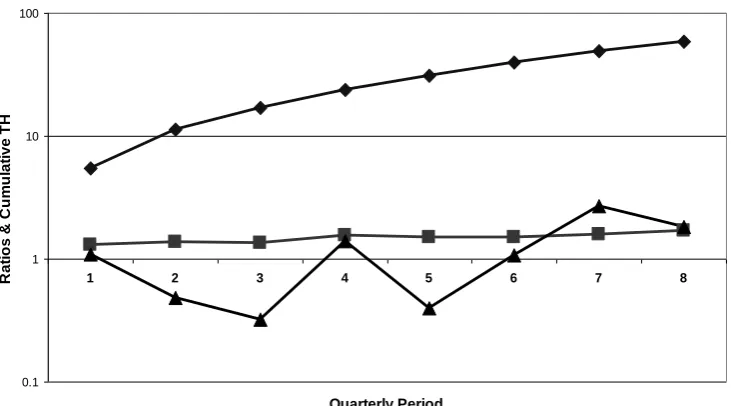
14 Figure 5 Change in burglary and target hardening relative to rest of Manchester
Note: Period covered is quarter 1 financial year 2003/04 to quarter 4 financial year 2004/05
The lower line is the target hardening ratio between the two target wards and the rest of Manchester City. When this line dips to below 1.0 it means that the target hardening rate was lower in the two wards than in the rest of Manchester. In other words there was a greater prevalence of target hardening activity in areas outside of the two wards.
In only three of the 8 quarters was target hardening relatively higher in the two wards than elsewhere. In quarter two and even more so in quarters three and five the target hardening rate was substantially higher in the rest of the City than in the two wards. Undoubtedly this would go some way to explain lack of convergence in burglary rates between these two wards and the rest of Manchester as indicated by the middle line. The relative position does improve for the two wards in quarters 7 and 8 but this is not enough to reduce the gap with the rest of the City. To do so would require redistributing substantially some of the target hardening from the rest of Manchester into these two higher burglary communities.
This analysis and strategic view of resources and needs would not be possible without data on target hardening. Bringing the two together in this way introduces a new dimension in the management and targeting of crime prevention.
Disaggregate spatial analysis
The availability of disaggregate data enabled intra-ward variations in burglary and target hardening to be examined. A more detailed examination of the alignment between burglary and target hardening was carried out by producing a Resource Targeting Table (RTT).
Cumulative % of Target Hardening plus Burglary & Target Hardening Ratios
0.1 1 10 100
1 2 3 4 5 6 7 8
Quarterly Period
R
a
ti
o
s
&
C
u
m
u
la
ti
v
e
T
15
An RTT is an innovative technique for identifying how much of a problem (domestic burglary) is concentrated in varying proportions of the street network. It can be used to pose questions such as: what proportion of streets would need to be brought into a target hardening programme to tackle 30% of the City or the ward’s burglary problem?
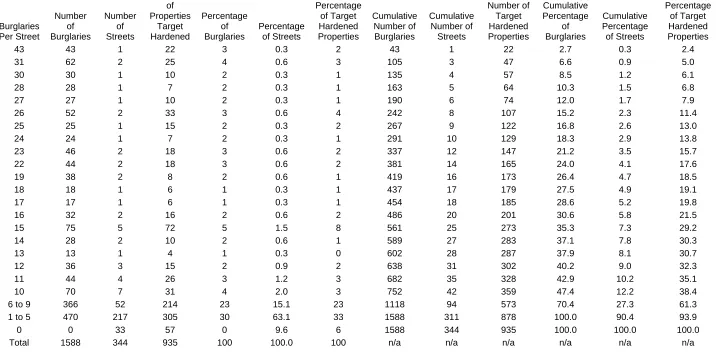
An RTT for Harpurhey appears in Table 4. It covers the period April 2002 through March 2005. It compares the proportion of burglaries per street with the number of streets in each ward. There is also an additional column to compare the proportion of burglaries per street to the proportion of target hardening per street.
From this table it is evident that burglary is concentrated in a small number of streets in the ward. The top row shows that one street in Harpurhey had 43 burglaries; the second row that there were two streets with 31 burglaries each. The top 16 burgled streets (4.7% of all streets) contained 26.4% of all burglaries in the ward and 18.5% of all target hardening. There were also 33 streets (10% of all streets) in Harpurhey with no burglaries, and 6% of all target hardening in the ward occurred in these streets
.
The RTT tells us that the target hardening was broadly in the right areas but that the correlation between target hardening and burglary at street level was far from perfect. Although covering several years RTTs can be produced for shorter periods to monitor how far target hardening is being channelled into areas of risk. Whether or not the ward had its fair share of target hardening is, of course, another matter.
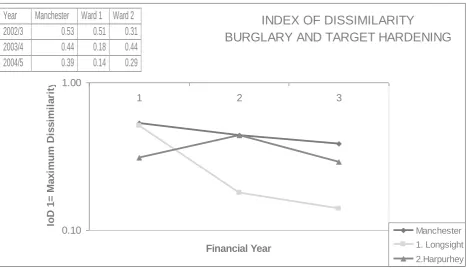
Another way to measure the alignment between where burglaries occur and where the target hardening is being channelled is to calculate the Index of Dissimilarity (IoD) between the two distributions. The formula for its derivation at Census Output Area level is:
IOD= 0.5 ∑ | bi/B - ti/T |
Where:
bi is the number of burglaries in Output Area i B is the number of burglaries in Manchester
ti is the number of target hardened properties in Output Area i and T is the number of target hardened properties in Manchester
IOD = 0.1 minimum dissimilarity 1.0 maximum dissimilarity
Table 4 Resource Targeting Table (RTT) for Harpurhey (April 2002 – March 2005)
Burglaries Per Street
Number of Burglaries
Number of Streets
Number of Properties
Target Hardened
Percentage of Burglaries
Percentage of Streets
Percentage of Target Hardened Properties
Cumulative Number of Burglaries
Cumulative Number of Streets
Cumulative Number of
Target Hardened Properties
Cumulative Percentage
of Burglaries
Cumulative Percentage of Streets
Cumulative Percentage of Target Hardened Properties
43 43 1 22 3 0.3 2 43 1 22 2.7 0.3 2.4
31 62 2 25 4 0.6 3 105 3 47 6.6 0.9 5.0
30 30 1 10 2 0.3 1 135 4 57 8.5 1.2 6.1
28 28 1 7 2 0.3 1 163 5 64 10.3 1.5 6.8
27 27 1 10 2 0.3 1 190 6 74 12.0 1.7 7.9
26 52 2 33 3 0.6 4 242 8 107 15.2 2.3 11.4
25 25 1 15 2 0.3 2 267 9 122 16.8 2.6 13.0
24 24 1 7 2 0.3 1 291 10 129 18.3 2.9 13.8
23 46 2 18 3 0.6 2 337 12 147 21.2 3.5 15.7
22 44 2 18 3 0.6 2 381 14 165 24.0 4.1 17.6
19 38 2 8 2 0.6 1 419 16 173 26.4 4.7 18.5
18 18 1 6 1 0.3 1 437 17 179 27.5 4.9 19.1
17 17 1 6 1 0.3 1 454 18 185 28.6 5.2 19.8
16 32 2 16 2 0.6 2 486 20 201 30.6 5.8 21.5
15 75 5 72 5 1.5 8 561 25 273 35.3 7.3 29.2
14 28 2 10 2 0.6 1 589 27 283 37.1 7.8 30.3
13 13 1 4 1 0.3 0 602 28 287 37.9 8.1 30.7
12 36 3 15 2 0.9 2 638 31 302 40.2 9.0 32.3
11 44 4 26 3 1.2 3 682 35 328 42.9 10.2 35.1
10 70 7 31 4 2.0 3 752 42 359 47.4 12.2 38.4
6 to 9 366 52 214 23 15.1 23 1118 94 573 70.4 27.3 61.3
1 to 5 470 217 305 30 63.1 33 1588 311 878 100.0 90.4 93.9
0 0 33 57 0 9.6 6 1588 344 935 100.0 100.0 100.0
INDEX OF DISSIMILARITY BURGLARY AND TARGET HARDENING
0.10 1.00
1 2 3
Financial Year
Io
D
1
=
M
a
x
im
u
m
D
is
s
im
il
a
ri
ty
Manchester 1. Longsight 2.Harpurhey Year Manchester Ward 1 Ward 2
2002/3 0.53 0.51 0.31
2003/4 0.44 0.18 0.44
2004/5 0.39 0.14 0.29
[image:17.595.66.533.142.410.2]IoD values have been calculated between the distributions of burgled and target hardened properties across Census OAs for each year. These appear in Figure 6.
Figure 6 The Index of Dissimilarity for Manchester Output Areas
In Longsight, the IoD between target hardening and burglary fell from 0.51 in 2002/03 to 0.18 by 2003/04 and further still to 0.14 by 2004/05. This suggests that over time target hardening activity was increasingly being channelled into areas affected by burglary. Thus in 2002/03 51% of protected properties would have needed to shift OAs to reflect the distribution of burglaries but only 14% in 2004/05. Although this was in line with the trend in Manchester as a whole it was markedly stronger in Longsight.
In Harpurhey, there was less change in the spatial mismatch between target hardening activity and burglary; a moderate increase was observed between 2002/03 and 2003/04 with a return to the 2002/03 pattern by 2004/05.
In both wards, there was a closer alignment between target hardening and burglary than in Manchester generally.
Although the IoD gives a general indication of the spatial alignment of crime prevention with crime further work is needed to explore the feasibility of applying this measure to residential streets and other spatial entities to guide resource allocation.
Conclusions
18
affecting two inner Manchester wards with relatively high levels of domestic burglary, namely, Harpurhey and Longsight.
Combining data on target hardening and burglary has undoubtedly produced new insights on how the targeting of crime prevention measures accords with crime risk. This information can be used better align resources to needs.
There is a need to develop a more systematic approach to capturing data on policy interventions. But to do this effectively requires vision and commitment as well as ownership of the task.
Even if the principle of capturing such information is agreed there are still a number of questions about how such information can be generated and maintained, by whom, for whom and at what cost. For example:
How can crime prevention activity be categorised?
How can one identify systematically what interventions are being implemented, where and when?
How can the amount of crime prevention that is being delivered (i.e. the dosage) be quantified?
How far is its capture fundamentally different from that of recording crime? Who will collect such data?
How much will it cost to do this well? (systematically and accurately)
Are there examples of good practice in capturing policy data that can be shared across agencies?
Clearly one dilemma is the sheer volume of information that would need to be captured and the number of agencies and gatekeepers who would need to be approached. Some form of prioritisation would need to be made about what to collect and what to update. This might be based on an assessment of the importance, size and expected impact of policy interventions on crime. It might be necessary to distinguish ‘major’ or high priority policy interventions from minor initiatives just as distinctions can be made between serious criminal offences and misdemeanours.
Before embarking on these tasks a case would need to be made for doing so in terms of proof of concept. The value that the analysis of crime prevention activity data generates over and above that gained solely from crime data would have to be demonstrated. Even if this is achieved, questions remain about which agency would assume responsibility for doing so, how much it would cost to collect and maintain and how funding would be provided.
19
improved performance monitoring and a supply of policy data for evaluation exercises.
This study has not been without its limitations. Firstly, only one intervention, target hardening, has been examined. Many other policies may be operative in an urban neighbourhood that could potentially influence offender decision-making and the burglary rate. These include other projects tackling acquisitive property crime, police initiatives targeting prolific offenders, youth diversion schemes, regeneration programmes and so on. The collection of data from these was beyond the scope of this project.
Secondly, the target hardening data did not include details of what form of target hardening was supplied and how much was spent at each address. This precluded the derivation of a policy dosage or intensity target hardening measure that could be brought into the analysis.
Thirdly, the data provides scope to track the progress of individual properties that have been burgled and subsequently target hardened. This can be used to identify if they are subsequently victimised and if so how long they remain free of burglary. Survival analysis could be applied to compare ‘treated’ properties to those that are not protected through target hardening. There may also be spatial variations in the effectiveness of target hardening as a means of reducing risk. These, together with additional hypotheses will be the subject of further research.
Despite these its limitations, this study has at least raised an awareness of the scale of additional data capture and the complexity of the analysis required to fully incorporate policy data into crime analysis.
References
Audit Commission (2006) Crime Recording 2005: Improving the Quality of Crime Records in Police Authorities and Forces in England and Wales.
Home Office, Association of Chief Police Officers (ACPO), Association of Police Authorities (APA) (2007) The National Standard for Incident Recording (NSIR):
Counting Rules, Instructions for Police Forces in England and Wales. Home Office,
ACPO and APA, 2007.
Boba, R.(2005) Crime analysis and crime mapping. Sage Publications.
Bowers,K.J., Johnson, S.D. and Hirschfield, A. (2004). The measurement of crime prevention intensity and its impact on levels of crime. The British Journal of
Criminology,44(3), 419-440
Brantingham, P. L., and Brantingham, P. J. (1995) Criminality of place: Crime generators and crime attractors. European Journal on Criminal Policy and Research 3: 5-26.
20
Duncan,O.D., and Duncan,B. (1955) Residential distribution and occupational stratification. American Journal of Sociology, 60,493-503.
Eck, J.E (2005) Evaluation for lesson learning In Tilley. N. (ed.) Handbook of Crime
Prevention and Community Safety, Willan Publishing, 699-733.
Hamilton-Smith, N., and Kent, A. (2005) The prevention of domestic burglary
In Tilley. N. (ed.) Handbook of Crime Prevention and Community Safety, Willan Publishing, 417-457.
Hirschfield, A. (2005) ‘Analysis for Intervention’. In Tilley. N. (ed.) Handbook of
Crime Prevention and Community Safety, Willan Publishing, 629-673.
Neighbourhood Renewal Unit (2004) Understanding and improving Floor Target
Performance in Manchester, Nottingham and Southwark. The Places Project. Interim
Report. http://www.neighbourhood.gov.uk/publications.asp?did=1502 Pawson, R., and Tilley, N.(1997) Realistic Evaluation. Sage Publications.
ACKNOWLEDGEMENTS
This research was commissioned by the Government Office North West. Our thanks go to Samantha Stabler at Manchester City Council for her support in this project and to her colleagues for supplying the data sets on target hardening and domestic