T
he
L
ondon
S
chool of
E
conomics and
P
olitical
S
cience
Essays on Public Service Delivery and
Agricultural Development
Florian Michael Blum
Declaration
I certify that the thesis I have presented for examination for the PhD degree of the London School of Economics and Political Science is solely my own work other than where I have clearly indicated that it is the work of others (in which case the extent of any work carried out jointly by me and any other person is clearly identified in it).
The copyright of this thesis rests with the author. Quotation from it is permitted, provided that full acknowledgment is made. This thesis may not be reproduced without the prior written consent of the author.
I warrant that this authorisation does not, to the best of my belief, infringe the rights of any third party.
Acknowledgments
I am indebted to a number of people for their insights, support and encouragement while writing this thesis. Most importantly, I wish to thank my supervisor Oriana Bandiera for her invaluable advice and trust. My advisor, Henrik Kleven, and faculty at the LSE and elsewhere, especially Robin Burgess, Gharad Bryan, Alessandro Gavazza, Greg Fischer, Maitreesh Ghatak, Gerard Padró i Miquel, Rohini Pande and Silvana Tenreyro, also deserve gratitude for their insights.
My work in Tanzania would not have been possible without the support of two exceptional people. Ugo Pica-Ciamarra’s ability to build relationships, solve problems and manage stakeholders has taught me more about the world of policy making than I could have hoped for. Longin Nsiima’s management and communication skills bridged the gap between the Tanzanian govern-ment and academic research. I am deeply indebted to both of them.
Clare Balboni, Kilian Huber, Stephan Maurer, Gustav Meibauer, Tom O’Keeffe, Julia Philipp, Francesco Sannino and Danielle Stein are remarkable colleagues and friends who, through collaboration, advice and friendship, have made my years at the LSE as special as they were. I also owe gratitude to members of the research community at the LSE and the Suntory and Toyota International Centre for Economics and Related Disciplines for their support.
I am deeply indebted to my wonderful family. Birgit, Jürgen, Inge,
Abstract
This thesis consists of three chapters that study public service delivery, nutrition and agricultural productivity in developing countries.
The first chapter investigates whether imposing price-caps on frontline service delivery agents enhances welfare. I implement a field experiment in which I randomize whether public extension agents are subject to a price-cap or not. I find that while price-caps are effective in enhancing the affordability of extension services and increasing recipients’ surplus, they also reduce the geographic coverage of services. This suggests that price-cap regulation creates a tension between making services affordable and providing incentives for agents to serve remote recipients. I then show that the marginal welfare effect of reducing discretion over prices can be expressed as a function of two sufficient statistics: the elasticity of geographic service coverage with respect to the price-cap and the price elasticity of demand. Calculating the welfare effects, I find that any reduction of agents’ discretion reduces social welfare.
The second chapter is concerned with contract design in public service
delivery when delivery agents are boundedly rational. A theoretically
efficient contract that minimizes moral hazard costs and avoids behavioural distortions charges agents a fixed fee for the usage of public assets and makes them residual claimants on its returns. I investigate whether such contracts are indeed efficient in practice by investigating whether imposing lump-sum fees on livestock extension agents distorts their choices. Using a field experiment, I first show that, contrary to classic economic theory, levying a fixed fee on agents leads them to increase user fees for a livestock vaccine and induces demand effects that reduce quantities. To understand the mechanisms underlying this result, I implement a series of lab-in-the-field experiments with a subset of the field-experimental participants. The results suggest that instead of setting prices for user fees as mark-ups over marginal costs agents use simplified rules-of-thumb that anchor pricing decisions on aggregate profits. The results highlight that boundedly rational behavior can reduce the effectiveness of adopting fixed fee contracts.
Contents
1 The Value of Discretion - Price-Caps and Public Service Delivery 11
1.1 Introduction . . . 12
1.2 Setting . . . 18
1.2.1 Agents . . . 18
1.2.2 User Fees . . . 19
1.2.3 Services . . . 20
1.3 Experimental Design and Data . . . 21
1.3.1 Experimental Design . . . 22
1.3.2 Implementation Procedures . . . 22
1.3.3 Price-Cap Treatment . . . 23
1.3.4 Data . . . 24
1.4 Results . . . 26
1.4.1 Impact of the Price-Cap on Prices . . . 26
1.4.2 Who benefits from the Price-Cap? . . . 28
1.4.3 Impact on Service Allocation . . . 29
1.5 Sufficient Statistics Model for Welfare Analysis . . . 32
1.5.1 Model Setup. . . 33
1.5.2 Theoretical Effect of Price-Cap on Observables. . . 33
1.5.3 Effect of Price-Cap on Welfare . . . 36
1.6 Welfare Analysis . . . 40
1.6.1 Estimation . . . 40
1.6.2 Results . . . 43
1.7 Caveats . . . 44
1.8 Conclusion . . . 46
2 Are Fixed Fees Distortionary? Experimental Evidence 62 2.1 Introduction . . . 63
2.2 Setting . . . 68
2.3 Conceptual Framework . . . 70
2.3.2 Choosing Prices to Maximize Profits. . . 71
2.3.3 Confusion of Marginal and Average Costs . . . 72
2.3.4 Rules-of-Thumb. . . 73
2.3.5 Summary of Model Implications . . . 75
2.4 Evidence from a Field Experiment . . . 76
2.4.1 Experimental Design . . . 76
2.4.2 Data . . . 78
2.4.3 Estimation and Results . . . 79
2.5 Evidence from Lab-in-the-Field Experiment 1. . . 80
2.5.1 Sample and Implementation . . . 81
2.5.2 Design . . . 81
2.5.3 Sources of Variation . . . 83
2.5.4 Reduced Form Effects . . . 83
2.5.5 Effects of Average Costs and Revenue . . . 86
2.5.6 Effects on Profits . . . 89
2.6 Evidence from Lab-in-the-Field Experiment 2. . . 89
2.6.1 Design . . . 90
2.6.2 Sources of Variation . . . 90
2.6.3 Adjustment to the Conceptual Framework . . . 91
2.6.4 Estimation and Results . . . 94
2.7 Conclusion . . . 96
3 Priming the Pump - Irrigation, Nutrition and Agricultural Produc-tivity 108 3.1 Introduction . . . 109
3.2 Groundwater Irrigation and Tube Wells . . . 114
3.3 Identification. . . 115
3.4 Data . . . 117
3.4.1 Calorie Intake Data. . . 118
3.4.2 Hydrogeological Data . . . 119
3.4.3 Tube Well and Supplementary Data . . . 120
3.4.4 Summary Statistics . . . 122
3.5 Results . . . 122
3.5.1 First Stage Results . . . 123
3.5.2 Effect of Tube Well Adoption on Calorie Intake . . . 125
3.5.3 Effect of Tube Well Adoption on Expenditure Patterns . 127 3.5.4 Mechanism . . . 128
3.7 Conclusion . . . 134
Appendices 158 A Appendices to Chapter 1 159 A.1 Derivation of price discrimination formula . . . 160
A.2 Supplementary Information . . . 161
A.2.1 Timing . . . 161
A.2.2 Impact on Remote Farmers in Need . . . 161
A.3 Data . . . 163
A.3.1 Baseline Data . . . 163
A.3.2 How accurate is the receipt data? . . . 163
A.3.3 Farmer Survey Procedures . . . 164
A.4 Supplementary Tables . . . 165
A.5 Supplementary Figures. . . 169
List of Tables
Chapter 1: The Value of Discretion - Price-Caps and Public Service
Delivery 11
1.1 Treatment Groups . . . 48
1.2 Summary Statistics and Balance Table . . . 49
1.3 Effect of Price-Cap on Price Variation and Levels. . . 50
1.4 Recipient level correlates of prices in the control group . . . 51
1.5 Heterogeneous Effects on Prices by Elasticity . . . 52
1.6 Effect of Treatment on Composition of Recipients, by Elasticity 53 1.7 Effect of Treatment on Village Choices . . . 54
1.8 Effect of Price-Cap on Quantities and Revenue . . . 55
1.9 Fixed Fee Treatment Effects on Prices, Quantities and Revenue 56 1.10 Estimates of Welfare Effect of Marginally Reducing Prices . . . 57
Chapter 2: Are Fixed Fees Distortionary? Experimental Evidence 62 2.1 Summary of Theoretical Predictions (Simulation 1) . . . 98
2.2 Treatment Groups (Field Experiment) . . . 99
2.3 Fixed Fee Treatment Effects on Prices, Quantities and Revenue 100 2.4 Reduced Form Effect of Fixed Fee on Indifference Points (Simulation 1) . . . 101
2.5 Reduced Form Effect of Random Price Draws on Indifference Points (Simulation 1) . . . 102
2.6 Effect of Average Costs and Revenue on Indifference Points (Simulation 1) . . . 103
2.7 Effect on Profits (Simulation 1) . . . 104
2.8 Cost Schedule (Simulation 2) . . . 105
Chapter 3: Priming the Pump - Irrigation, Nutrition and Agricultural
Productivity 108
3.1 Summary Statistics . . . 136
3.2 Differential Adoption of Tube Wells across Hard and Soft Rock Areas . . . 137
3.3 Effect of Tube Well Adoption on Median Calorie Intake . . . 138
3.4 Effect of Tube Well Adoption on Median Calorie Intake, by Population . . . 139
3.5 Effect of Tube Well Adoption on Calorie Intake, by Percentile . 140
3.6 Effect of Tube Well Adoption on Food Expenditure . . . 141
3.7 Effect of Tube Well Adoption on Agricultural Production . . . . 142
3.8 Effect of Tube Well Adoption on Wages and Prices. . . 143
3.9 Effect of Tube Well Adoption on Farm Size Distribution . . . . 144
Appendix A: The Value of Discretion - Price-Caps and Public Service
Delivery 159
A.1 Effect of Treatment on Likelihood of Serving Remote Farmers in Need . . . 165
A.2 Effects on Participation . . . 166
A.3 Robustness - Replication of Price-Cap Treatment Effects exclud-ing Cattle Owners . . . 167
A.4 Robustness - Treatment Effects on Leakage and Transaction Behavior . . . 168
Appendix B: Priming the Pump - Irrigation, Nutrition and Agricultural
Productivity 171
B.1 Effect of Tube Well Adoption on Population . . . 172
B.2 Robustness: Effect of Tube Wells on Calorie Intake with Controls and Heterogeneous Time Trends . . . 173
B.3 Robustness: Effect of Tube Well Adoption on Food Expendi-ture, ICRISAT Districts . . . 174
List of Figures
Chapter 1: The Value of Discretion - Price-Caps and Public Service
Delivery 11
1.1 Map of Study Area . . . 58
1.2 Effect of Price-Cap on Price Distribution. . . 59
1.3 Box Plot of Price Variation . . . 60
1.4 Effect of Price-Cap on Number of Farmers Served . . . 61
Chapter 2: Are Fixed Fees Distortionary? Experimental Evidence 62 2.1 Information Sheet for Participants of the Lab-in-the-Field Ex-periment . . . 107
Chapter 3: Priming the Pump - Irrigation, Nutrition and Agricultural Productivity 108 3.1 Aquifer Map of India . . . 145
3.2 District Wise Aquifer Distribution . . . 146
3.3 Differential Tube Well Adoption in Hard Rock Areas . . . 147
Appendix A: The Value of Discretion - Price-Caps and Public Service Delivery 159 A.1 Receipt Format . . . 169
Chapter 1
The Value of Discretion
-Price-Caps and Public Service
Delivery
1.1
Introduction
A key function of governments is to assure that citizens are provided with
essential services for welfare and economic development. When agents
responsible for supplying these services have market power, decentralized market outcomes can generate an inefficient allocation of services and allow
agents to extract surplus from recipients.1 These undesirable outcomes
threaten the ability of governments to provide for their citizens. Government imposed price-caps, which aim to reduce agents’ discretion over prices,
are one commonly proposed solution to this challenge.2 Theoretical work
suggests that such interventions may be welfare-enhancing, as they can redistribute surplus and improve aggregate efficiency (Laffont and Tirole,
1993; Laffont, 2005). In addition, there is evidence that charging for
essential services in a developing country setting can adversely affect peoples’
willingness to use these services (Cohen and Dupas, 2010; Ashraf, Berry,
and Shapiro, 2010). Those findings highlight a potential value of low price-caps and suggest that using price-price-caps as an instrument to reduce agents’ discretion over prices may be welfare-enhancing.
In many situations, unregulated monopolistic agents responsible for supplying public services do not, however, only hold decision power over
prices. Rather, these agents also have discretion over which and how
many recipients to serve.3 In such situations, a theoretical literature argues that allocating discretion over pricing to agents can be welfare-enhancing
(Grossman and Hart, 1986; Aghion and Tirole, 1997). In particular, when
governments are unable to impose and enforce universal service obligations, discretion over prices allows agents to extract surplus, creating an incentive
for them to extend service coverage.4 Price-caps reduce agents’ discretion
and, by limiting their ability to extract surplus, can reduce incentives to extend
1For example, Sappington and Weisman (2010) in their review of evidence on regulatory
policy state: "When competition is unable to impose meaningful discipline on incumbent suppliers of essential services, regulation can be employed as an imperfect substitute for the missing market discipline."
2Recent newspaper headlines include: "Hillary Clinton Proposes Cap on Patients’ Drug
Costs"(New York Times, 2015);"FCA proposes price-cap for payday lenders"(Financial Conduct Authority, 2014);"Kenya to cap interest rates on bank loans"(Financial Times, 2016).
3Chaudhury et al. (2006), for example, document an inability of governments to limit
absenteeism among teachers and health workers in developing countries.
4In Tanzania, the setting of this study, the government cites the binding fiscal constraints
service coverage.5 Capping prices for essential services can therefore also reduce welfare. The question of whether to cap prices or not hence has to solve a trade-off between making services affordable and providing incentives for agents to extend service coverage.
In light of this trade-off, evaluating whether reducing agents’ discretion over prices improves welfare requires knowledge of two parameters: the price elasticity of demand ("intensive margin elasticity") and the impact of price-cap regulation on the number of markets served ("extensive margin elasticity"). While empirical estimates of demand elasticities are available for many goods and services, empirical evidence on the latter parameter is limited. As a result, little is known about whether price-cap regulation enhances or reduces welfare.
This paper provides experimental evidence to address this gap. In particu-lar, I estimate the intensive and extensive margin elasticities and examine the trade-off between discretion and price-cap regulation for an essential public
service provided in developing countries: agricultural extension.6 As the
basis of this investigation, I focus on the provision of I-2 poultry vaccines that protect against Newcastle Disease (ND). ND is highly prevalent in East Africa and is lethal for infected birds, therefore posing a substantial economic risk for populations dependent on agriculture.7 I-2 is the primary ND vaccine used by rural farmers in Tanzania. It is exclusively produced by the government and distributed directly to farmers by specialized government service delivery
agents. These agents receive the vaccine at a subsidized price from the
government and distribute it by travelling to farmers in a geographically defined service area, where they perform veterinary examinations and apply
the vaccine.8 Each service area has exactly one agent tasked with providing
5The incentive value of discretion provides a possible explanation for an observed
correlation between worker autonomy and project completion in the public sector (Rasul and Rogger, 2016). Duflo, Greenstone, et al. (2014) also study how agents’ discretion affect the effectiveness of public operations but, instead of focusing on incentives, highlight that discretion allows public agents to use private information.
6On average, African countries spend 5% of their budget on agricultural extension,
compared to 8% spent on primary health services.
7Poor farmers are particularly affected by ND, as their livelihoods and asset holdings are
especially dependent on livestock.
8Private provision is widely viewed as sub-optimal to public provision, as effective ND
vaccines.9 Agents collect user charges from farmers in order to finance the vaccine delivery and application.10 While there exist privately supplied imperfect substitutes for I-2, access to them is limited to urban areas and larger scale farmers, and trust in the effectiveness of privately supplied
vaccines is low.11 There is no formal service charge schedule in place that
regulates prices for vaccinations. This lack of competition and price regulation thus gives substantial price discretion to agents.
To investigate whether capping prices for ND vaccinations enhances welfare, I collaborate with the Tanzanian government. Working with the Ministry of Agriculture, Livestock and Fisheries, I allocate 550 wards, the main administrative units at which agents are organized, to one of two
experimental groups.12 274 of these wards are assigned to the control group
that mirrors the Tanzanian status quo. Agents assigned to these wards
have full discretion over pricing and typically charge recipients either 50 or 100 Shillings ($0.023 or $0.046) per vaccination. In contrast, 276 wards are assigned to the treatment group, in which agents face a price-cap of 80 Tanzanian Shillings ($0.035) per vaccination. Agents in both experimental groups have full discretion over which and how many recipients are served and which geographic areas are targeted.
The evaluation of this intervention yields three main results. First, the price-cap is effective in reducing agents’ discretion over prices. I find that the intervention reduces average prices charged by agents by 17% and the within-agent standard deviation of these prices by 42%. I also show that farmers whose main source of livelihood is agriculture and smallholders were paying higher prices in the status quo and benefit particularly from the price-cap. Second, the price-cap affects the composition of the beneficiary pool: I find that the cap increases the share of previously unserved recipients in the beneficiary pool by 14%. In addition, the price-cap increases the share of farmers whose livelihood depends on agriculture and smallholders in the
9Agents are, on average, responsible for 4 villages. The government’s ability to introduce
competitionwithinthe current system is constrained by a lack of qualified extension staff.
10Financing service delivery agents through user charges is common in developed and
developing countries. See section1.2.2for an overview.
1111% of recipients in my sample report having access to an imperfect substitute. Such
recipients are predominantly located in urban areas. The absence of a quality control system for privately provided vaccines makes I-2 delivery through public agents the only available option to obtain access to a certified ND vaccine.
12While the Newcastle Disease program covers most of Tanzania, this study focuses on
recipient pool by 8% and 9%, respectively. Third, the price-cap reduces the geographic coverage of services by reducing the proportion of villages that are served in each service area by 12%. This reduction is driven by a reduced likelihood of agents visiting remote villages: Agents are 25% less likely to visit the furthest half of villages and 26% less likely to visit the most remote village in their area of responsibility. Taken together, the evaluation suggests that the price-cap induces agents to shift towards comparatively closer but previously unserved recipients. These results therefore present direct evidence in support of the trade-off discussed previously: On the one hand, price-caps can enhance welfare by making services affordable for previously unserved recipients in markets that are comparatively cheaper to serve. In addition, price-caps can redistribute surplus to recipients. On the other hand, price-caps can adversely affect welfare by reducing agents’ incentive to extend services to remote markets that are costlier to serve.
Given the countervailing effects induced by the price-cap, it is not clear whether it is welfare-enhancing for the government to restrict the agents’ discretion over prices and, if so, to what extent. To assess this, I develop a model of monopoly regulation that is consistent with the empirical results. Assuming that the government maximizes a weighted sum of consumer and producer surplus, this model allows me to express the aggregate social welfare effect of marginally reducing prices below the full discretion level as a function of two sufficient statistics: First, the elasticity of the proportion of villages served with respect to the price-cap, which acts as a sufficient statistic for the welfare loss incurred through the reduced number of markets served. Second, the price elasticity of demand, which captures the welfare benefits associated with reducing prices.
The relationship between price-caps and service allocation evaluated as part of the field experiment is sufficient to estimate the elasticity of the proportion of villages served with respect to the price-cap. However, the price-cap treatment is insufficient to estimate the elasticity of demand for I-2 vaccinations.13 To address this, I induce additional experimental variation in costs. In particular, I independently assign agents in 273 wards to a second treatment that requires them to contribute a fixed fee of 25,000 Tanzanian Shillings (approximately $11.40) to cover the cost of the vaccine if they agree
13This is because disentangling supply and demand responses using one source of
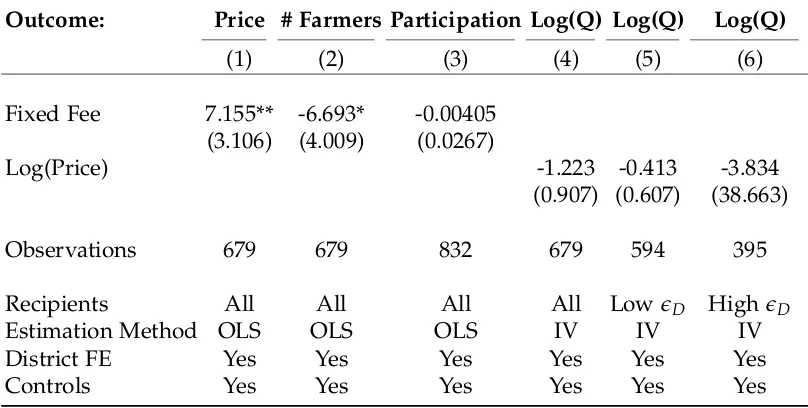
to participate in the program.14 Agents in the remaining 277 wards receive the vaccine for free. This intervention generates variation in prices because, as I show in a lab-in-the-field experiment, agents choose prices based on average instead of marginal costs.15 Using this variation, I obtain an estimate of the aggregate elasticity of demand of -1.22.
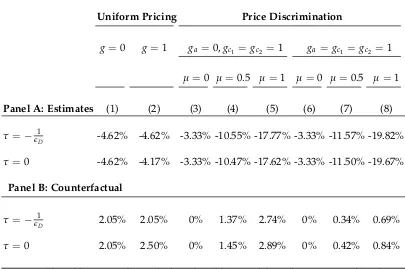
I then combine these estimates to evaluate the effect of marginally reducing agents’ discretion over prices using the sufficient statistics formula. I find that marginally reducing prices below the monopoly level induces a social welfare lossof between 3% and 12% of total sales revenue per agent. In contrast, a counterfactual scenario that ignores the supply effects induced by the intervention suggests that price-cap regulation would lead to moderate welfare increases of between 0.5% to 2.5% of total sales revenue per agent
on the margin. Taken together, this result highlights the importance of
studying the effect of interventions on service coverage: While price-caps can increase welfare by making services more affordable, reducing agents’ discretion over prices can be counterproductive when agents also have discretion over which markets to serve.
This paper provides evidence on the welfare effects induced by imposing
price-caps on monopolistically supplied services. By doing this, it
com-plements a literature on pricing for public services. Theoretical work in this area has investigated how to optimally regulate providers of public
services. Laffont and Tirole (1986), show that optimal level of regulation
creates a tension between rent-extraction and efficiency. In deriving the
optimal regulation mechanism, they show that price-caps can be optimal for highly efficient firms. While they also show that price-caps might allocate excessive rents to less efficient firms compared to alternative contracts, both Laffont (2005) and Alonso and Matouschek (2008) argue that in the absence of transfers and verifiable information on costs, price-caps remain the optimal
regulatory policy.16 This paper provides direct and causally identified
empirical evidence on the effectiveness of price-cap regulation and the rent-extraction versus efficiency trade-off.
14To avoid challenges associated with liquidity constraints, this fee was collected after the
vaccination campaign had ended.
15The intervention and the lab-in-the-field experiment are explained and evaluated in
chapter2.
16Empirical evidence that tests those theories to date has primarily focused on the
Empirical evidence on pricing for essential services in developing coun-tries has focused primarily on demand effects induced by prices. For example, Cohen and Dupas (2010) investigate how charging for insecticide treated bed
nets affects demand and use. Similarly, Ashraf, Berry, and Shapiro (2010)
show that prices for water-purifies can act as a screening device for high-use customers. This paper complements this work by highlighting the importance of considering the interaction between supply and demand decisions as the basis of setting prices for public service provision.
More broadly, this paper provides field-experimental evidence on the
welfare effects induced by allocating discretion to agents. Thereby it
complements a new and rapidly growing literature that investigates the
organization of the public sector in developing countries.17 While previous
empirical work has focused on understanding how contracts for public agents
can be designed to encourage effort (e.g. Khan, Khwaja, and Olken, 2016b;
Muralidharan and Sundararaman,2011and Olken, Onishi, and Wong,2014),
a more recent stream of theoretical literature has begun to take into account that contracts in practice are rarely complete.18 This poses a central question as to who should have decision rights in cases not covered by the employment
contract. While theoretical work highlights that allocating discretion to
agents in situations not covered by contracts can act as an incentive (Aghion
and Tirole, 1997), empirical evidence on this mechanism is rare. Previous
empirical work has primarily focused on documenting a correlation between
employee autonomy and public project completion (Rasul and Rogger, 2016)
as well as improved information use as a result of regulatory discretion (Duflo, Greenstone, et al.,2014). This paper is, to the extent of my knowledge, the first to show the existence of incentive effects as a result of discretion.
The remainder of this article is structured as follows. Section 1.2describes the relevant features of the setting in which the study takes place. Section1.3
outlines the experimental design and section1.4 presents the results. Section
1.5 theoretically conceptualizes the effects of the price-cap intervention and derives a sufficient statistics formula to evaluate the welfare impact of capping prices. Section1.6 presents the welfare analysis. Section1.8 concludes.
17The review by Finan, Olken, and Pande (2015) provides a comprehensive overview of
this literature.
1.2
Setting
This project explores the effect of price-caps in the context of agricultural and livestock extension services in Tanzania, which is a public service delivery program administered by local governments and coordinated nationally by
the Ministry of Agriculture, Livestock and Fisheries.19 The service aims
to subsidize animal health and production services to make them available to small-scale rural farmers who are excluded from private input markets. It hence provides crucial economic infrastructure in an economy in which over 60% of households depend on livestock for their livelihoods, and where livestock is the primary asset held by rural households.
In light of their importance, livestock and agricultural extension services are one of the key services provided in developing countries (Swanson,
Farner, and Bahal, 1989; Feder, Willett, and Zijp, 1999). According to
the United Nations Food and Agricultural Organization, governments in Africa spend on average 5% of their total annual expenditure on agricultural services, which is only slightly lower than their expenditure on health (8%), with a total global spending on extension services estimated at $31 billion in 2008. In total, 10,891 extension agents were employed in Tanzania in 2012, comprising approximately 5% of local government staff. This leaves extension workers as the third highest proportion of government employees, after education and health services.20
1.2.1
Agents
The agents responsible for delivering livestock extension services in Tanzania
are para-veterinarians, who are employed by local governments. Agents
have advanced professional qualifications and typically hold a diploma from specialized training institutes in animal health, animal production or general agriculture. They are responsible for 1 to 12 villages, averaging 4 villages per agent, and typically operate in areas where the private coverage of livestock services is low. Agents work by themselves and have their own geographically defined area of responsibility, in which they face no competition from other public providers. The main organizational unit of agents at the local level are wards, which are accumulations of roughly 8 villages. There are, on average, two agents per ward. Agents in the same ward interact on a daily basis
19This division of responsibilities is the common organizational form for extension in
Africa (Crowder et al.,2002) and Latin America (Wilson,1991).
20Total numbers of local government staff in 2007 were 224’114, with 148’607 being teachers
and, while maintaining their own geographic areas, typically coordinate their work.21 There was no entry or exit of agents during my study period.
Agents’ primary task is to travel to farmers in order to provide services. Around 25% of agents have access to a government motorcycle, whereas the remainder travels by foot and uses public motorcycle taxis and buses to reach
farmers.22 The government does not provide any reimbursements of travel
costs. Instead, service delivery is completely funded through user fees.
1.2.2
User Fees
A key component of agents’ contracts is their compensation structure. Delivery agents are compensated through a mix between government wages and user fees. Specifically, agents receive a flat compensation of around $200
per month.23 In addition, agents can collect user fees from farmers, which
cover delivery costs and act as performance pay. In the status quo local governments have allocated full discretion over pricing to the agents.
Existing evidence shows that the rationale for employing user fees in
extension is threefold. First, user fees are equivalent to commissions
for private sellers, which provide high-powered incentives for agents to exert effort. This addresses one of the key challenges in public provision of extension services, which have traditionally suffered from a lack of
mechanisms to induce providers to exert effort (Howell, 1986; Farrington et
al., 2002). Second, high monitoring costs make performance pay schemes, in
which payments from the government are linked to output, infeasible. User fees reduce monitoring costs as they delegate monitoring responsibilities to the recipients of services, who can directly observe output (J. R. Anderson and Feder, 2007; Kidd et al., 2000). In the presence of high monitoring costs, the alternative to user fees are therefore fixed wages, which provide no incentives to agents. Third, user fees are a cost-sharing device that reduce pressure on local governments’ budgets to fund service delivery (e.g. Cary,1998).
While cost-sharing schemes are common for agricultural and livestock
ex-tension programs (Rivera and Gustafson, 1991; Dancey,1993), compensation
schemes that partially rely on user payments are also present for other public
21To avoid spillovers and interaction, treatments are assigned at the ward level. See also
section1.3.1.
22This process of service delivery is the modus operandi for a number of key service
delivery programs in developing countries. For example, Ashraf, Bandiera, and Lee (2016) study community health workers in Zambia. Community health workers are expected to devote 80% of their time to household visits and are hence required to incur similar costs as the agents in my setting.
service delivery schemes, such as health services and food distribution.24 On the one hand, there is a substantial amount of evidence documenting bribes paid to public service delivery agents, which, while illicit, play a similar role to a user fee.25 More formally, a number of countries and organizations have, either temporarily or permanently, switched to a system that relies on user fees to cover expenditure of health facilities.26 For example, Deserranno (2016) studies community health workers recruited by BRAC, an international NGO, in Uganda. Those workers are tasked with providing basic health services to local residents and are compensated through medication sales to service recipients. Similarly, food distribution systems such as Solidaridad in the Dominican Republic and Raskin in Indonesia rely on co-payments to finance distributors and local government agents, respectively (Busso and Galiani,
2014; Banerjee, Hanna, Kyle, et al.,2015).
1.2.3
Services
Agents provide a range of services to recipients. This includes preventive animal health treatments such as vaccinations, deworming procedures and reactive treatment to address common livestock diseases. Unregulated user fees are charged for all animal health services.27 As part of this project I focus on the provision of I-2 vaccines as one dimension of service provision.28 I-2 is a thermotolarent vaccine for poultry that protects against Newcastle Disease (ND), a viral disease that is transmitted between birds and leads to almost 100% mortality in affected and unvaccinated chicken. Estimates from Tanzania suggest that more than 30% of chicken die from ND every
year, leading to an annual cost of up to $78 Million (Msami, 2007). As part
of an I-2 vaccination program, agents receive subsidized vaccines from the
24Countries that have, among others, implemented such schemes include Cameroon,
Chad, Mali, the Central African Republic, India, Kenya, Nicaragua, China, New Zealand, the Netherlands, Chile, Australia as well as most OECD countries. See the comprehensive reviews by Haan et al. (2001) and J. R. Anderson and Feder (2007) for details.
25See, for example, Deininger and Mpuga (2005) for an overview from Uganda.
26Examples include Burkina Faso, Kenya, Papua New Guinea , Uganda, South Africa,
Colombia, Sudan and Lesotho. For an overview of those experiences, see the review paper by Lagarde and Palmer (2008).
27The program also aims to provide recipients with traditional extension services, such as
advice regarding animal husbandry practices and information on optimal feed composition. As the extent to which agents engage in providing those services and the prevalence of user fees for such services is more heterogeneous, the main focus of this investigation is on animal health services.
28By focusing only on I-2, I ignore possibly compounded adverse effects of the intervention
government and then travel to recipients in order to apply vaccinations to farmers’ livestock.
Four characteristics of I-2 service provision make it particularly suitable for my study. First, the Tanzanian government is the only producer and provider of I-2 vaccinations. This gives delivery agents market power and allows them to extract surplus from recipients.29 In addition, this characteristic, together with the fact that there is no competition between public providers, simplifies the interpretation of my results as it alleviates concerns that the treatment shifts market shares between different providers. Second, the public provision of I-2 is based on a vaccination calendar which requires a coordinated vaccination effort on a four-monthly basis.30 During such campaigns, agents’
primary task is the provision of vaccinations. As this study focuses on
vaccination periods, this reduces the concern that the intervention might affect the effort agents exert on alternative tasks. Third, in order to eradicate ND, vaccination levels in the poultry population need to be maintained at at least 85% (Boven et al., 2008). Given high turnover rates of flocks, the fact that an important transmission channel of ND is through non-domesticated birds, and the low coverage of vaccination programs, Tanzania’s system is unlikely to eradicate ND in the near future. In light of this argument, I simplify the analysis by abstracting from externalities and focus on consumer surplus in my welfare analysis.31 Finally, I-2 is the only public animal health service provided to poultry keepers. Although I do not observe prices for other services provided by agents to I-2 recipients, this property allows me to investigate potential cross-price effects by investigating whether the treatment induces agents to target more non-poultry farmers.
1.3
Experimental Design and Data
The experiment discussed in this paper examines how price-cap regulation affects public service delivery in the context of the public provision of I-2
29Private provision is widely viewed as sub-optimal to public provision, as effective ND
vaccination requires adequate handling and application of the vaccine as well as the ability to detect preexisting poultry infections. A central concern is that private market provision would compromise service quality which risks reducing the acceptance and adoption of I-2 vaccinations.
30Vaccination campaigns follow regional rainfall patterns and typically take place in
January, May and September. Campaigns last three weeks before the lack of cooling renders the vaccine unusable.
31A complementary argument in favor of focussing on I-2 relates to the common criticism
Newcastle Disease vaccination. This section explains the experimental design before describing the data used as the basis of this evaluation.
1.3.1
Experimental Design
This paper examines the welfare effect of an intervention that imposes and enforces a maximum price (“price-cap treatment”) for I-2 vaccinations. To avoid spillovers resulting from coincidental interactions between agents, treatment assignment was performed at the ward instead of at the individual level. I randomly and independently assign each of the 550 wards in the
study to either the control or the treatment group. Table 1.1 displays the
basic experimental design. Group allocation was stratified by 108 strata, where each stratum was defined by a district identifier and two binary variables, indicating whether all agents in the ward had specialized in general agriculture and whether only one agent was assigned to the ward.
This intervention was carried out during the first I-2 vaccination campaign
of 2016.32 The study covers the time period between January and February
2016 and enumerated the universe of agents in four of Tanzania’s 30 regions
(Dodoma, Iringa, Morogoro and Tanga). Figure1.1shows a map of the study
regions and the wards included in this study. All 27 districts in the four regions were included in the study. The study area was chosen to include a wide variety of agricultural environments while assuring geographic proximity to the ministry headquarter in Dar Es Salaam. From each study district, I obtained administrative records of all employed agents, detailing their name, specialization, ward of responsibility and telephone number. In total, I collected this information for all 990 agents registered in the four regions, which forms the provisional sample of this study. 832 of those agents attended the training and participated in the vaccination campaign.
1.3.2
Implementation Procedures
All participants were invited to attend a 90-minute meeting at the district headquarter at the beginning of the campaign to collect the vaccine and receive instructions. Agents who attended this meeting received a show-up fee to cover their transport expenditure. Payments varied between 10,000 and 50,000 Tanzanian Shillings ($4.50 to $22), depending on the distance and available transport methods. The specific instructions were announced to participants only after they had arrived for vaccine collection at the district headquarters but before they departed to the field again. Thus the decision
whether to attend the vaccine collection should be viewed as exogenous with respect to the experiments. Trainings and surveys were conducted on different days for the different experimental groups and districts to avoid spillovers.
During this meeting, agents in the control group were reassured that they were allowed to collect fees from farmers which they could keep for themselves. Agents were specifically encouraged to profit financially from the transaction, stating that the government viewed user fees as a way to motivate employees and compensate them for good performance. In addition, the instructions reiterated that agents were allowed to charge farmers any price they chose and that it was acceptable to charge different prices to different farmers.
Agents were then informed that the ministry wanted to keep better records of how many chickens were vaccinated and that therefore reporting procedures during this campaign would differ slightly from the status quo. In particular, a condition of participation in the vaccination campaign was that agents would issue formal receipts to every farmer served and submit the receipt information directly to a central headquarter using a phone
based reporting system. Agents were specifically told that the ministry
would contact farmers to verify that the information provided on receipts was correct. In order to assure compliance with this reporting system and encourage effort, the ministry offered a bonus payment of 60 Tanzanian Shillings (approximately $0.025) for every verified vaccination.
After the instructions, training staff collected data on demographics, work
history and workplace characteristics of participants. Ministry staff then
distributed the vaccines to agents, supplying agents with as many doses as they requested for their area of responsibility and informing them that more doses would be stored at the district headquarter where they could be picked up in case of additional demand.
1.3.3
Price-Cap Treatment
cover their marginal costs. To achieve this balance, the maximum price of 80 Tanzanian Shillings was chosen after careful consultations with experts from the Tanzanian Veterinary Laboratory Agency (the vaccine’s main producer),
MALF, local governments and international academics. In addition, this
decision was also based on a mixed methods pilot study conducted by the author that analyzed pricing behavior during previous I-2 campaigns. To avoid setting a price-cap that would not allow agents to recover their marginal costs of applying the vaccine, the cap was conservatively set to bind only for comparatively high prices.
As price-caps are only effective if they can be enforced, I took the following measures to ensure compliance with the price-cap: First, the receipts that are normally employed during campaigns were amended to contain the national emblem of the United Republic of Tanzania, transforming them into official government documents. As receipts require the delivering agent’s signature, forging them is equivalent to tempering with official government documents which is punishable by law and can lead to dismissal. Anecdotal evidence suggests that this incentive mechanism was taken seriously: local government level supervisors requested detailed information on verified compliance behavior by their employees in the aftermath of the intervention to discipline non-compliant employees.
Second, MALF conditioned the bonus payment of 60 Tanzanian Shillings per vaccination on compliance with the price-cap. This scheme makes it incentive compatible to comply with the price-cap as long as deviation yields a price lower or equal to 140 Tanzanian Shillings per vaccination and the
detection probability is sufficiently high. Given that 99% of transactions
in the control group were conducted at user charges below this threshold, compliance was incentive compatible for the vast majority of transactions.
1.3.4
Data
Data used as the basis of this paper was collected from two different sources:
administrative government receipts and a survey of service recipients. I
designed and conducted the recipient survey specifically as part of this project. In addition, I implemented a new procedure of reporting service provision receipts via text message to increase accuracy and usability of the administrative data. I complement this data using information from a baseline survey of agents, described in detail in the appendix.
detail each recipient’s name, contact number, village, the date of the visit, the total user fee collected and the number of vaccinations applied. After issuing the receipt, agents electronically transmitted the receipt information to a government database using a text-message template.33
Using the receipt data, I construct two unverified, and therefore provi-sional, outcome measures. First, the total user fee collected divided by the number of vaccinations applied gives a direct measure of the per unit price
charged to farmers. Second, the total number of farmers served can be
measured through the total number of receipts submitted.
After the end of the vaccination campaign, I administered a survey to service recipients. The survey was conducted over a period of six weeks between March and April 2016 and sampled a randomly selected fraction of 15% of all receipts submitted, selected randomly and stratified by agent. This led to a total sample of 4’516 receipts selected for surveying and verification,34 80% of which were successfully contacted.35 The farmer survey collected detailed information on the service provision and on recipient characteristics, thereby verifying that the service was actually provided and collecting verified information on user fees.
I use the information obtained from this survey to construct my main outcome measures. In order to arrive at a measure of the total number of farmers served, I multiply the number of verifiable receipts per agent by the agent-specific sampling weight of each receipt. I repeat the same procedure for the average price, total revenue collected and the total number of chickens vaccinated. In order to analyze outcome measures related to service allocation, I use farmer survey data on farmer demographics, asset holdings distance between farmers’ home and the agent’s headquarter and farmers’ sources of livelihoods.36
33In total, agents issued 31,657 valid receipts, accounting for 702,762 animals vaccinated. 34Rounding errors induced by the stratification led to a sample that is slightly smaller than
15% of 31657.
35The procedures to contact farmers are described in detail in the appendix. Among the
farmers not reached, enumerators were unable to reach 42% because of incorrect or invalid contact details. In total, phone survey procedures therefore were able to assess the validity of almost 90% of receipts sampled. I treat the remaining receipts as unverifiable and hence incorrect.
36While it would have been optimal to conduct a detailed consumption survey as part
1.4
Results
This section presents the empirical methodology and results from the
eval-uation of the price-cap treatment. Table 1.2 presents summary statistics and
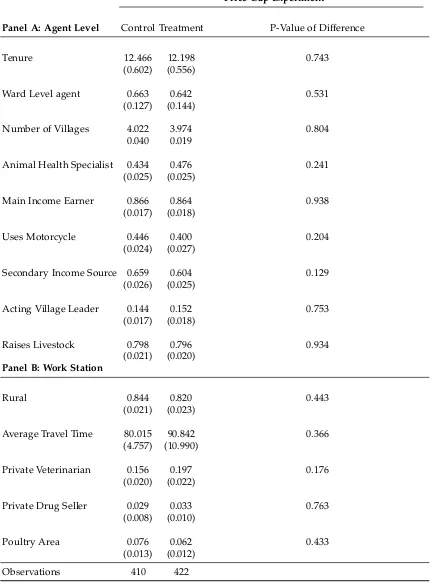
a balance check using baseline characteristics of agents participating in the campaign. All characteristics in the table were chosen prior to estimating the balance checks. These results suggest that experiment participants are similar across the treatment and the control group. Panel A considers agent level characteristics while panel B investigates differences in workstation characteristics. None of the 28 differences are statistically significant at the 5% level, which confirms balance at baseline.
The presentation of the results proceeds in two steps. Subsections 1.4.1
and1.4.2present results that investigate how the price-cap affects transaction
prices. Subsection 1.4.3 then focuses on the allocation and extension of
services to show the central trade-off between affordability and coverage necessary for welfare analysis.
1.4.1
Impact of the Price-Cap on Prices
I begin the evaluation by estimating the impact of the price-cap treatment on user fees charged over the course of the vaccination campaign. As treatment assignment was randomized, the empirical methodology is straightforward. I estimate Ordinary Least Squares (OLS) equations of the following form:
yiwd = β0+β1PriceCapwd+β2Xwd+γd+eiwd
where yiwd is the outcome of interest for participanti in ward w and district
d, PriceCap is a binary variable that indicates whether agents’ wards were
assigned to the price-cap treatment, and Xwd denotes a vector of ward-level
stratification variables.37 The coefficient of interest isβ1. I also include district
level fixed-effects (γd), as the assignment lottery was stratified by these strata.
As the treatment is perfectly correlated within wards, every specification reports robust standard errors clustered at the ward level.
37X
I first investigate the effect of the price-cap treatment on the distribution of prices. Panel A in figure1.2 plots a histogram that visualizes the distribution of prices in the status quo, using farmer survey data from the control group.38
Prices follow a bimodal distribution with peaks at 50 and 100.39 Panel B
overlays the distribution of prices in the treatment group over the histogram from the control group. Significant bunching at 80 suggests that the price-cap was binding and effectively reduced the level of prices.40 Columns 1 and
2 in table 1.3 confirms this finding by showing that the price-cap reduced
average prices by approximately 17%, which is statistically significant at the
1% level.41 Column 5 confirms the visual impression of bunching at 80 by
showing that this intervention increased the fraction of transactions per agent where a price of 80 Shillings was charged by a factor four, from around 5% to 20%.
I then investigate the impact of the price-cap on the within-agent variation of prices. To do this, I calculate the residuals of a regression of prices on agent fixed effects. Figure 1.3 presents a box-plot of the residuals, separated between treatment and control group, to visualize the effect of the treatment
on price variation. The height of the box corresponds to the difference
between the 25thand 75thpercentile of residuals, and the whiskers correspond to the 10th and 90th percentile, respectively. I find that the intervention reduced price disparities between recipients. In particular, the figure shows that within-agent price variation is substantially lower in the treatment group than in the control group.
Columns 3 and 4 in table 1.3 show that this reduction in variation is also statistically significant. Column 3 reports the estimate of the treatment effect on the within-agent standard deviation of prices using farmer survey data, whereas column 4 repeats the same analysis using receipt data. The results suggest that the treatment reduced the within agent variation of prices by 42
38To improve the visualization, the histograms are truncated at 200 Tanzanian Shillings,
which excludes less than 1% of all observed transactions.
39As expected when designing the intervention, the price-cap hence only binds for a subset
of transactions. The histogram also shows that less than 1% of transactions in the control group occur at prices above 140 Tanzanian Shillings, which assures that complying with the price-cap is incentive compatible.
40Figure1.2also suggests that the price-cap intervention increased the mass of the price
distribution for prices significantly below the cap. Anecdotal evidence suggests that this is driven by difficulties with calculating multiples of 80 and a tendency to round down to the nearest 1000 for the total price.
41The estimate using the farmer survey data is slightly lower than the estimate obtained
to 44%, which is statistically significant at the 1% level. The results do not differ substantially between the receipt and the farmer survey data.
1.4.2
Who benefits from the Price-Cap?
The bimodal distribution of prices in the control group and the evidence of within-agent price variation suggest that different farmers, even if they are served by the same agent, pay different prices. To gain an understanding of the impact of the price-cap on welfare, it is important to understand which farmers pay higher prices and thus are more likely to be affected by the cap. To do this, I present two pieces of evidence.
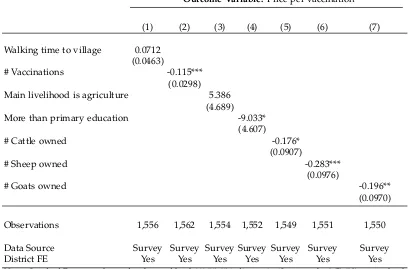
First, table 1.4 presents the correlates of unit prices in the control group. Column 2 shows that agents offer lower per-unit prices for larger flocks. In particular, every additional vaccination applied by the agent is associated with a quantity discount of 0.12 Shillings. In addition, indicators of education and asset holdings suggest that more disadvantaged recipients also, ceteris paribus, pay higher vaccination prices. Column 4 shows that recipients who have more than primary education pay 9 Shillings less per vaccination, and columns 5 to 7 suggest that increased holdings of non-poultry livestock assets are associated with lower per vaccination prices. The estimates of the partial correlations remain significant even after controlling for self-reported travel time to the recipient. Finally, while there is some evidence that prices are related to travel and application costs, it is unlikely that this variation can
conclusively explain the observed variation in prices. Column 1 in table 1.4
first shows that, while not statistically significant, an additional minute of walking to the recipient’s village, as measured through self reported walking
distance, is associated with marginally higher vaccination prices. I then
investigate the extent to which measures of cost, in particular walking and motorcycle travel times and the number of vaccinations applied, can explain the within-agent price variation. I find that while individually the indicators show associations with prices, controlling for cost measures only explains 7% of the within-agent price variation. Taken together, this is suggestive that agents use discretion over prices in the status quo to extract surplus.
Second, in light of the previous results, it is instructive to investigate who benefits most from the price-cap. To investigate this, I run regressions at the transaction level that take the following form:
where Pricef wd denotes outcome variables for recipient f in ward w and
district d, Kf wd denotes a characteristic of the recipient and Zf wd denotes
control variables at the recipient level and Xwd controls at the agent level.
Control variables at the farmer level include measures of travel distance. Control variables at the agent level contain stratification variables and indicators for the fixed fee treatment. Farmer level regressions are weighted to obtain equal weights for each service delivery agent. Standard errors are again clustered at the ward level.
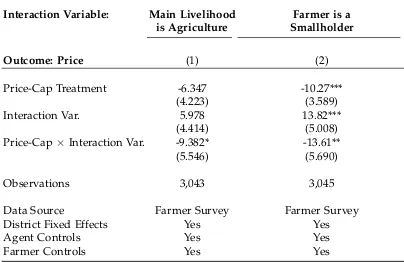
Table 1.5 presents the results of this exercise. In column 1 I estimate
the effect of the intervention on transaction prices and allow the treatment effect to vary depending on whether the recipients’ livelihoods depend
on agriculture. Approximately 80% of households in the control group
match this definition. The results show that while the point estimate for the treatment effect on prices is negative for all farmers, it is small in absolute terms and statistically insignificant for non-agricultural households but approximately 50% larger and statistically significant at the 10% level for households whose main livelihood is derived from agriculture.
Column 2 shows that agents price differentially based on not only farmers’ livelihood characteristics, but also on the number of chickens vaccinated per farmer. In particular, agents offer lower per-unit prices for larger flocks.
Table 1.5, column 3 shows that farmers who own fewer than 11 chickens
on average pay 14 Tanzanian Shillings (or 18%) more per vaccination than
farmers with larger flocks.42 Implementing a price-cap not only reduces
average prices for all recipients by 12% but also eliminates this quantity discount. Taken together, the price-cap intervention appears to particularly benefit agriculturally dependent households and smallholders, who are likely to be poorer and hence more susceptible to shocks to livestock holdings.
1.4.3
Impact on Service Allocation
The previous section has shown that price-caps affect prices. While this directly affects the distribution of surplus, price-caps’ primary welfare implications operate through their effect on the allocation of services. This section highlights two channels through which reducing discretion over prices affects service allocation. First, price-caps increase the affordability of services. This increases the likelihood of agents extending services to
42When asked about the motivation for this pricing strategy, agents mentioned that
previously unserved recipients and, in light of the evidence on differential pricing presented in the previous section, to agricultural households and smallholders. Second, price-caps reduce agents’ expected profits from serving a given village, which in turn reduces their incentives to incur the travel costs associated with travelling to remote villages.
Impact of Price-Cap on Composition of Beneficiary Pool
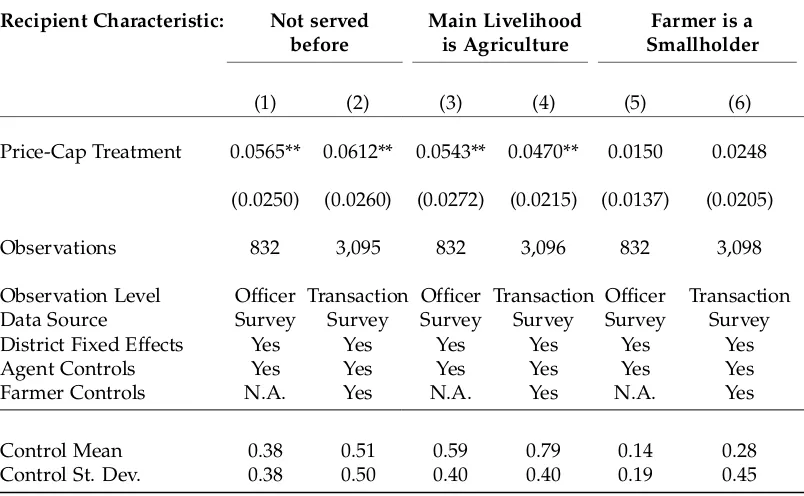
I first investigate how price-caps affect the composition of the beneficiary pool. As the previous section has shown, price-caps reduce prices on average and do so in particular for agricultural households and smallholders. Price-caps therefore not only redistribute surplus but also increases the affordability of services. The intervention therefore should increase the share of previously unserved beneficiaries in the recipient pool. Consistent with this, columns 1 and 2 in table 1.6 show that the price-cap indeed increases the proportion of previously unserved recipients in the beneficiary pool by 12% to 15%.
I then investigate how this price-cap affects the share of farmers in the recipient pool who benefited particularly from the price-cap, namely those whose main source of income is derived from agricultural production and
those with comparatively small chicken flocks. As discussed in section 1.4.2
and shown in table1.5, the price-cap reduces transaction prices more for such
recipients. Columns 3 and 4 in table 1.6 suggest that this price-adjustment
indeed leads to a positive demand effect, as households whose main source of income stems from agriculture are 6% more likely to be served in response to the price-cap treatment, conditional on the size of the recipient pool. While not statistically significant, the point estimate in columns 5 and 6 in table1.6
suggest that smallholders are 9% more likely to be served in the price-cap group.
Taken together, the results presented in this section suggest that in the absence of price-caps agents use their discretion to extract rents from service recipients. Capping prices redistributes surplus to recipients, crowds in previously unserved farmers and makes services more affordable for recipients in need.
Price-Caps reduce Geographic Coverage
a price-cap reduces agents’ incentives to extend services to markets that are more costly to serve. For the setting studied in this paper, capping prices might reduce their incentives to extend services to remote villages. Price-caps can therefore reduce welfare by discretely eliminating aggregate surplus obtained from serving a given market.
This section provides evidence in support of this mechanism. To do this, I merge information on villages and travel distances with the farmer survey and the receipt data. In particular, a list of all villages in their area of responsibility and the approximate travel time by foot from their headquarter to each village was collected from agents during the baseline survey. I use the data on travel times to rank the villages by their distance to the agent’s headquarter. I then match the village information provided during the farmer survey and on the receipts to the village list collected during the baseline survey, to obtain information on whether agents visited a given village.43
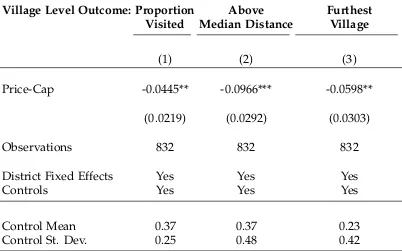
Table 1.7 shows how capping prices affects which villages agents visit.
Column 1 shows that while agents in the status quo visit approximately 37% of villages that they are assigned to, the price-cap reduces this proportion by 4.5 percentage points. Columns 2 and 3 confirm that this reduction is driven by a reduced likelihood of agents visiting remote villages: they are 25% less likely to visit villages whose distance from their headquarter is above median, and 26% less likely to visit the furthest village in their area of responsibility. Taken together, this suggests that price-cap regulation reduces agents’ incentives to serve more remote markets.44
Impact on Total Number Served
Given the countervailing forces discussed previously, it is unclear whether the price-cap will increase or decrease the total number of farmers served. Figure 1.4 investigates this question and shows little evidence of the price-cap affecting the total number of farmers served. The figure separately plots the daily number of farmers served for the treatment and the control group using receipt data. This shows that the difference between the daily number of farmers served is statistically indistinguishable from zero for 18 out of the
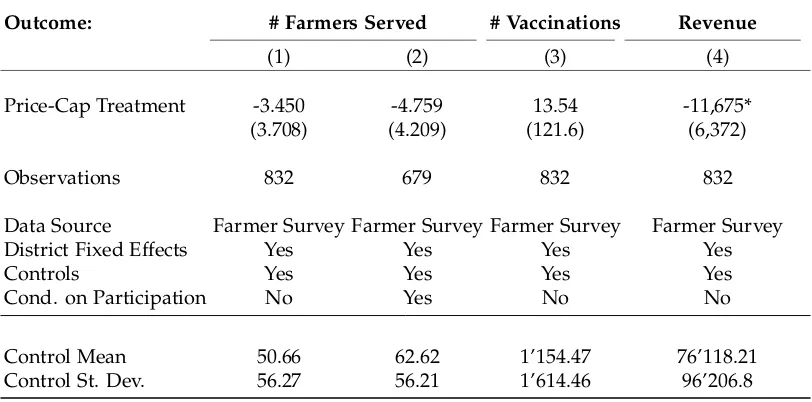
21 days of the campaign. Column 1 in table 1.8 confirms this impression:
43Approximately 11% of receipts were unmatchable to villages. This can either be because
the information provided in the surveys or on the receipts was incorrect or because recipients live outside of the formal villages. Reassuringly, the likelihood of an agent visiting an "unmatched" recipient is uncorrelated with the treatment.
44In the appendix to this paper I present additional evidence on the trade-offs generated
agents in the price-cap treatment serve an average of 3.6 fewer farmers than agents in the control group. This difference is statistically insignificant.
I conduct two robustness checks to verify this result. First, a possible concern is that the result is a composite effect between a participation response on the extensive margin and an effort response on the intensive margin. To address this, I restrict the sample to agents who verifiably served at least one farmer, therefore ruling out responses on the extensive margin. Column 2 in table 1.8 confirms that the result is robust to this restriction: ruling out extensive margin responses, agents in the treatment group serve on average 5 fewer farmers than agents in the control group, which remains statistically insignificant. Second, I consider the impact of the treatment on
the total number of vaccines applied. Column 3 in table 1.8 shows that
while the point estimate for the treatment effect is negative for the number of farmers served, it flips sign for the total number of chickens vaccinated while remaining insignificant. Taken together, those results suggest that while the price-cap affected thetypesof farmers served, I do not detect an effect on the total number of recipients served.
1.5
Sufficient Statistics Model for Welfare Analysis
The previous section has shown that price-caps have three key effects on
service provision. First, they reduce average prices and the within-agent
variation of prices. Second, theyincreasethe proportion of new recipients and recipients who were paying higher prices in the status quo in the recipient
pool. Third, they reduce the likelihood of agents visiting remote villages.
To conceptualize these effects, and to understand their effect on welfare, this section develops a model that is consistent with the empirical results and allows for the estimation of welfare effects through a sufficient statistics formula.
I model I-2 provision as a slot assignment problem in which slots are assigned through two allocation mechanisms. First, suppliers choose which villages to visit. While agents are responsible for a given service area, the model takes into account that visiting a given village requires agents to pay a travel cost. Agents’ willingness to pay this travel cost then determines service
allocation between villages in a given service area. Second, agents choose
1.5.1
Model Setup
This model considers a situation in which a monopolistic agent is supplying services to a population of potential customers, the size of which is normal-ized to 1. Customers are defined by their valuation of the service, which is denoted by vi. I assume that vi is a continuous random variable drawn from
a distribution F(v). I further assume that recipients’ elasticity of demand is given by eiD which can either be high or low: eiD ∈ {eLD;eDH}. Suppose that
a fraction µ of recipients has eLD, whereas everyone else has eDH. Customers
do not only differ with regard to their valuation, but also in their location. Specifically, I assume that recipients live in a continuum of villages with differing travel distances to their agent’s headquarter. I further assume that the distribution of valuations is the same for every village.
Agents in this model face two sequential choices. First, they decide which markets to serve by determining the allocation of services between villages. I assume that travelling to villagejrequires paying a cost ofcjwhich agents can
choose to either pay or not. I assume thatcj is drawn from a distribution with
c.d.f. M(c) defined over [0;cmax] with cmax < ∞. Second, agents decide on
prices, which determine service allocationwithina village, conditional on the village being served.45 For simplicity, I model this by assuming that agents offer a take-it-or-leave-it price based on observable recipient characteristics. While I allow for price-discrimination, I assume that agents do not observe vi
and instead only learn about eiD.46 If customers accept the agent’s offer, the
agent receives the agreed sum and delivers the service at a constant cost τ. If
the recipient rejects the price offer, no transaction takes place, but the agent still has to pay the travel cost to the village.
1.5.2
Theoretical Effect of Price-Cap on Observables
To aid the interpretation of the empirical results, this section shows that the implications of the model are consistent with the three main empirical results. In particular, I show how agents’ pricing decisions as well as the allocation of services in the model are affected by the price-cap intervention. Section 1.5.3
45This implicitly assumes that travel costs within a village are 0. It is straightforward to
relax this making travel costs farmer specific.
46Anecdotal evidence is consistent with this assumption. Agents report that negotiations
then uses the empirical estimates to evaluate the marginal welfare effect of the price-cap.
Effect of Price-Cap on Prices
To begin the analysis of the model, note first that travel costs to villages are sunk at the time of price setting. This allows me to investigate the agent’s two decisions separately. To understand the effect on prices, notice that agents face a monopoly trade-off: raising prices increases profit from a transaction but reduces the likelihood that farmers will accept the price. Formally, visiting a recipient of type iyields the following expected profit:
πi =
h
1−Fpi|eiD
i
[pi−τ]
Pointwise maximization of the objective function yields the standard monopoly pricing solution:
pDec
eiD
=τ e
i D
1+eiD
!
(1.1)
Agents set prices based on a mark-up over marginal costs, with a low-elasticity of demand leading to high mark-ups. This model therefore gives rise to a bimodal price distribution in which the price-cap is more likely to bind for recipients with a low elasticity of demand. To explore the effect of the cap, assume that, consistent with the empirical design, the price-cap only binds for recipients with a low elasticity of demand. Prices under a price-cap
¯
p are hence given by:
pRegeLD
=p¯ and pRegeDH
=τ e
H D
1+eDH
!
This directly implies that the price-cap mechanically reduces the agent’s ability to price-discriminate between recipients with a high and low elasticity of demand. Price-caps hence reduce the standard deviation and average of prices in equilibrium and particularly benefit recipients with a low demand elasticity.
Effect of Price-Cap on Beneficiary Pool
In order to understand how price-caps affect service allocation, I now investigate how price-caps affect the distribution of the different elasticity
types in the recipient pool. This requires me to investigate recipients’
receiving a price offer, recipients decide whether to accept or reject it. In equilibrium, recipients accept every offer that does not exceed their willingness to pay. The distribution of types in the recipient pool is then:
µD
peLD
|eDL
+ (1−µ)D
peHD
|eHD
(1.2)
whereD p eiD|eiD denotes the demand for customers of typei.
Note also that here the demand curve is downward sloping. If the price-cap binds only for recipients with a low elasticity of demand, it is hence straightforward to see that price-cap regulation will increase their demand. This increases the likelihood of serving previously unserved recipients and shifts the distribution of types in the direction of recipients with a low elasticity of demand.
Effect of Price-Cap on Village Choices
To understand the agent’s coverage decision, I investigate the effect of the
price-cap on the choice of villages conditional on a price vector p. In the
status quo, agents decide to visit village j if the expected profit exceeds the associated costs:
µπeL
D(p) + (1−µ)πeHD (p) ≥cj
where πei
D(p) denotes the expected profit obtained from recipients with
elasticity equal to eiD. This defines a cut-off value for cj, denoted by c∗(p),
which is the highest cost village visited by the agent. The proportion of villages visited in the status quo is hence given by:
σ= M(c∗(p)) (1.3)
Regarding allocation between villages, agents are hence more likely to serve a larger proportion of villages when (i) the expected profit is higher and (ii) the proportion of recipients with a high elasticity of demand in each village is lower.
To understand how price-caps affect the allocation of services between villages, denote by πDecj and πRegj