2016 International Congress on Computation Algorithms in Engineering (ICCAE 2016) ISBN: 978-1-60595-386-1
1 INTRODUCTION
The earliest research on the reliability of computer network service system can date back to the 1950s, when Mr. Lee investigated into the exchange network during computer communication and found that transmission information failures among network components are caused by substantial reduction of the total transmission capacity of telecommunication ex-change networks that resulted in network congestion and extensive breakdown of these networks, leading to tremendous economic losses and preventing the timely exchange of the related information. In his research, Mr. Lee attributed the call congestion in network communication to network link failures, and proposed a connectivity-based network reliability testing stand-ard. Early researches on computer network reliability were always concentrated on communication network. Following the great progress made by the Defense Advanced Research Projects Agency (DARPA) of the superpower USA in the 1960s in the research of the reliability of computer network service systems, many authors voiced their own opinions. During this period, the optimization research on computer network ser-vice quality was typically focused on network connec-tivity as a measurement criterion for networks.
Net-work connectivity mainly refers to the connectivity of computer network. For any cloud service that has to be connected via computer user, communication can never be functional unless computer network is in-corporated, or the computer network is failure-free at the nodes. Ball et al. proved that an NP problem whose probability is hardly calculated accurately in network connectivity, which is well accepted by many researchers, who made intensive studies into the im-pact of network operability on reliability in some lit-eratures.
In the 1980s, with the rapid development of net-work technology, the popularity of netnet-work and the gradual increase of computer users, network managers discovered some new problems. For example, even good network connectivity was not able to ensure that the computer network can work stably. Delay and congestion frequently occurred in network and conse-quently result in a reduction in the network perfor-mance. This was likely to prevent some network oper-ation-related businesses from working normally. Dur-ing this period, research on the smooth operation of network became an evaluation criterion for network service quality.
In the 1990s, with the acceleration and populariza-tion of computer network service, the reliability level
Summary on Computer Network Service
Quality Optimization in Big Data Era
Liang Lu, Chunyi Lou,Wei Dong & Zhuo Wang
Department of Information Engineering, Qinhuangdao Institute of Technology, Qinhuangdao, Hebei, China
ABSTRACT: With the gradual improvement of China’s computer network service system, some service systems are also gradually optimized. To adapt to the development of the times, how to apply big data transmission to upgrade overall competence has become a focus of concern. In big data era, computer network service systems are more inclined to the improvement of necessary functions such as data mining, collection and analysis. De-velopment of smart algorithms for computer network service successfully adapts to the many nodes and links between computer network service systems. Approximate calculation of reliability in an era of large big data networks becomes particularly important. Processing big data transmission to accommodate computer network service system is the key to this problem. To cultivate talents for big data processing, it is important to master key utility technologies including statistical data analysis, data processing and numerical analysis so as to better optimize computer network service systems in big data background.
of network system service quality became a focus of concern. The use of related network service systems such as circuit network, transportation network, power network and logistics network added to the feasibility evaluation problems of computer network service. Reliability research on computer network became a greater concern.
With the development of computer service quality, Monte Carlo method has been widely applied in com-puter network as a probability statistical method that measures the reliability level of network service. For computer network service systems demanding high reliability, big data sampling calculation is needed to meet an evaluation standard of some users for network service satisfaction. Many authors have proposed sampling methods favorable for variance reduction to address some problems. These include the sequential destruction method in Wong and Easton and the lim-ited sampling method in Fishman.
Development of smart algorithms for computer network service successfully adapts to the many nodes and links between computer network service systems. Approximate calculation of reliability in an era of large big data networks becomes particularly im-portant. Some researchers used genetic algorithms and their modifications to solve network planning prob-lems based on reliability level and obtained satisfac-tory optimization results as references for other re-searchers. Some other researchers applied coarse-grained parallel genetic algorithms in network service quality optimization and conducted empirical verification to confirm the effectiveness of their ant colony optimization (ACO).
2 MODELING
In big data era, the optimization of computer network service is mainly supervised by the government. Net-work information has to be reviewed before indis-pensible information service is provided to the society. For resources and information services on government websites that can be shared by online users, big data transmission should try to avoid network transmission congestions. For this purpose, resource distribution has to be optimized before the information transmitted can provide its own function and value.
2.1 Current service state of computer network
For the evaluation of the current computer network service, we can use the method in MPs, Lin Project Team. Assume we can have k, where K is not less than the transmission quantity between calculations with two MPs. During data transmission, path disjoint refers to the condition where any two paths in the many data transmission networks do not contain the same transmission links. This assumption will defi-nitely reduce the chosen number of transmitted data.
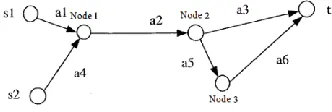
[image:2.516.295.434.118.184.2]Also, in a multi-source, multi-home transmission sys-tem, even a designated starting point or receiving point will not result in path disjoint for data transmis-sion. The sketch of multi-source, multi-home network transmission is shown in Fig.1 below.
Figure 1. Multi-source, multi-home network.
As shown in Figure 1 above, in the multi-source, multi-home network, the data quantity needed to be transmitted by paths P1={a1,a2,a3} and P2={ a4,a5,a6} is d1, where ai stands for path ai; i=1, 2,…; and n means there are n paths for data transmission. P1 and P2 are two disjoint paths. According to the mul-ti-source, multi-home network diagram, the data in-formation of another unit is transmitted from S2 by paths P3={a7,a5,a8} and P4={a9,a10}, where P3 and P4 are two disjoint paths. During this simulated network data transmission, only P2 and P3 contain the same path a5. If the data transmission is large, competition will exist between the two data streams for passing a5 first so as to transmit the data. In the era of practical big data transmission, priority of this competitiveness frequently occurs. It is also the key to be investigated during current data transmission processes.
So far, many network transmission optimization re-searches are descriptions on single-source, sin-gle-home network, whereas multi-source, multi-home network data transmission is more common in net-work service. How to distribute resources while opti-mizing network resource reliability has gradually be-come the focus of these researches.
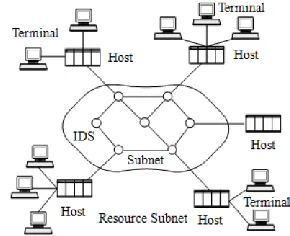
Figure 2. Communication subnet and resource subnet.
[image:2.516.289.434.475.593.2]assume big data transmission between communication subnets and resource subnets. A sketch of these com-munication subnets and resource subnets is shown in Figure 2.
With regards to the public satisfaction of computer network service systems, there are many factors af-fecting the different levels of evaluation indexes. Here we are going to describe the network transmission process.
2.2 Optimized algorithm for computer network ser-vice
According to big data network transmission, we make the following hypotheses:
(1) Each of the nodes in the network transmission process is reliable, and each reliable node is replaced by two nodes connected to an unreliable line.
(2) The transmission number of each transmission line is a non-negative integer and complies with standard normal distribution; different transmission lines have independent flows from each other.
(3) The network transmission system complies with the conservation law of flow transmission. That is, the information inflow at each node equals to the infor-mation outflow at this node.
(4) On a shared path, the priority of transmission follows the “first come, first transmit” principle.
[image:3.516.68.234.387.443.2]Based on these hypotheses, the computer network data stream transmission containing shared network lines is shown in Figure 3 below.
Figure 3. Data stream transmission of shared network line.
The network topology is shown in Figure 3. In MSN algorithm, the data d1(k),k=1,2,…,a,d1(k) pro-duced at s1 at any time is opposite side and has to be transmitted to t via P1 within a given time. A data produced at S2 at any time is d2(j), which has to be transmitted from s2 to t via P2 within a given time.
As the class orders of data rows d1(1), d2(2),…,d1(a) are all transmitted by a via d2, these determinants must be combined into one row. Here, k
is the intermediate quantity; ta(k) stands the arrival at node u, u=1, 2, 3…,m. When all the data have arrived at other nodes, a new row SEQU is generated.
Let A(k) and B(j) stand for the times when s1 and s2; t(k) and t(j) stand for the waiting times at the node. The first data generated to s1 and s2 also include A(1)=T10,TW0(1)=0, B(1)=t20, tt(1)=0.
However, as the data of d1 and 2 will be reused, t(1) is not necessarily 0. Assume d1 arrives at the node
first, t1 is definitely 0. In SEQU algorithm, the data before de1 is s2, and B stands for the data before d1 in SEQU. t(1) is derived from the formula below:
other w tt ta if tw
(1) ta -(w) tt
) ( ) 1 ( 0
) 1 (
1 1
1 1 1
In the same way, assume d2(1) is the first data to arrive at the node, then ttw(1)=0; otherwise w=1,2, …a stands for the data before d2 in SEQU algorithm, and tt(1) is expressed by the following formula:
other
w tt tta if ttw
(1) ta -(w) tt
) ( ) 1 ( 0
) 1 (
1 1
1 1 1
And T1(K) and T2(J) stand for the time intervals produced by d1 and d2. The time when the two lines of data we consider is indicated below:
, , 3 , 2 ), 1 ( ) 1 ( )
(k Ak T1 k k A
, , 3 , 2 ), 1 ( ) 1 ( )
(j A j T2 j j B
Let ts(k) stand for the time when d1(k) leaves; t(k) stands for the time point when d1(k) leaves node u; and t(k) stands for the time point when d1(k) arrives at t. The following is the formula for the time variables of d1(k), k=1,2,…a:
1 1 0
(
)
(
)
/
)
(
)
(
k
A
k
tw
k
d
k
x
ts
1 1
(
k
)
ts
(
k
)
tp
ta
2 1 1 1
1(k) ta (k) tw(k) d (k)/x
t
2 1 2(k) t (k) tp
ta
3 1 2 2
2(k) ta (k) tw (k) d(k)/x
t
3 2( ) )
(k t k tp
ta
There, we let tts(j) stand for the time leaving s2, then ttu(j) will stand for the time when d1(k) leaves node u, where ta(k) stands for the time when d1(k) arrives at home point t. The following is a formula for the time variables of d1(k),k=1,2,……, α:
4 2 0
(
)
(
)
/
)
(
)
(
j
B
j
ttw
j
d
j
x
tts
4 1(j) tts(j) tp
tta
2 2 1 1
1
(
j
)
tta
(
j
)
ttw
(
j
)
d
(
j
)
/
x
tt
2 1 2(j) tt(j) tp
tta
5 2 2 2
2
(
j
)
tta
(
j
)
ttw
(
j
)
d
(
j
)
/
x
5 2 3
(
j
)
tt
(
j
)
tp
tta
6 2 3 3
3
(
j
)
tta
(
j
)
ttw
(
j
)
d
(
j
)
/
x
tt
6 3( ) )
(j tt j tp
tta
According to the analysis above, the waiting time during data transmission process includes two types: the waiting time for the same data sources and that for different data sources. As tw0(k),tw2(k),ttw0(j) and
ttwq(j), where k=2,3,…,α, and j=2,3,…,β, q=2,3 are
the option for data priority caused by the competition of homologous data on shared links, its result can be derived using the formula below:
other k ts k A if k tw A(k) -1) -ts(k ) 1 ( ) ( 0 ) ( 0 other k k t k ta if k tw ) ( ta -1) -(k t ) 1 ( ) ( 0 ) ( 2 2 2 2 2 other j j tt j B if j ttw s ) ( B -1) -tts(j ) 1 ( ) ( 0 ) ( 0 other j j tt j tta if j
ttwq q s
) ( tta -1) -tts(j ) 1 ( ) ( 0 ) ( q
As tw0(k),tw2(k),ttw0(j) and ttwq(j), where k=2,3,…,α, and j=2,3,…,β, q=2,3, are the option for data priority caused by the competition of homologous data on shared links, the calculation is divided into two cases:
(1)In SEQU, if d1(k) is the data at the front, then d1(k-1) can be deduced according to tw1(k),k=2,3,……, α, using the formula below:
other k j tt j ta if k
tw q s
) ( ta -1) -(k t ) 1 ( ) ( 0 ) ( 1 1 1
(2)In SEQU, if is the data at the front, then d2(k-1) can be deduced according to tw2(k),k=2,3,……, α, using the formula below:
other k v tt j ta if k
tw q s
) ( ta -(v) tt ) ( ) ( 0 ) ( 1 1 1
In the same way, if d2(j) is the data at the front, then d2(j-1) can be deduced according to tw1(j),j=2,3,……, β, using the formula below:
other j j tt j ta if k
ttw q s
) ( ta -1) -(j tt ) 1 ( ) ( 0 ) ( 1 1 1
In SEQU, if d2(j) is the data at the front, then d1(vv), vv=2,3,……,α can be deduced according to ttw1(j),j=2,3,……, β, using the formula below:
other j v tt j ta if k
ttw q s
) ( tta -(vv) tt ) ( ) ( 0 ) ( 1 1 1
If time limitations are considered, ta(k) and tta(j) must be kept within their respective time limitations for transmission, i.e.:
, , 3 , 2 ), ( ) ( )(k Ak Tth1 k k ta , , 3 , 2 ), ( ) ( )
(j B j Tth2 j j
tta
Here, Tth1(k) and Tth2(j) can be relevant to the magnitude of thed1(k) and d2(j) data quantities.
Here, we assume ( ) 1 k
Tth and Tth2(j) are linear to
) (
1 k
d and d2(j), and then we can yield the expres-sions for d1(k) and d2(j) as follows:
1 1 1
(
k
)
a
d
(
k
)
b
Tth
1 2 2
(
j
)
a
d
(
j
)
d
Tth
Here, a, b, c and d are the network model parame-ters given by the network manager.
Assume that the data distribution is discrete distri-bution, in the case of d1(k), k1,2,3,...,
as an example, the magnitude of data can be selected as1 ,..., 2 , 1
,i nu
ddi according to (nu+1), and the
in-terval probability of each ddi corresponding data is
Pr0Pr1
or
Pr
i1Pr
1
,
i
2
,
3
,...,
nu
1
, where0
Pr0 andPrnu11, d1(k)1,2,..., can be de-rived from the algorithm below:
1. [Initialization]
k
0
.2. Generate a values complying with the uniform distribution of (0,1)
a
k
r
r
r
1,...,
,...,
。3.
k
k
1
, whered1(k) can be derived from the formula below: 1 Pr Pr Pr Pr Pr Pr Pr Pr 0 ) ( 1 1 1 2 1 2 1 0 1 1 nu k nu nu nu k nu nu k k r if dd r if dd r if dd r if dd kd M M
4. Calculate the nextd1(k).
According to this idea, we can yield the result of
,..., 2 , 1 ), ( 2 j jd .
To ensure that all data produced at the two sources considered here can be transmitted to the nodes, the capacity of the paths cannot be negative. Define that
X P k Tth k
d ( ), ( ), )
transmitted into d1(k) via P1, k=1,2, …, a under the limitation of Tth1(k), and thereby determine the
con-crete process for the qualified network capacity of each data.
2.3 Application of big data network transmission
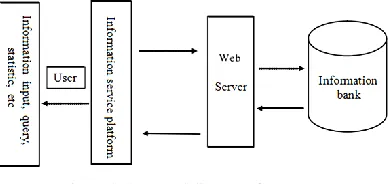
[image:5.516.52.468.67.225.2]Considering that the main factor affecting the evalua-tion of computer network service is the service delay caused by big data transmission, it is necessary to make concrete optimization researches on concrete computer network service systems. The structural diagram of a typical computer network service system for government open public affairs information is shown in Figure 4 below.
Figure 4. Structural diagram of computer network service system.
With the gradual refinement of China’s computer network service systems, some service systems are gradually optimized. To adapt to the development of the times, how to improve overall competence by making use of big data transmission, how to share information in a timely manner and how to effectively secure important information have become a focus of concern. In big era data, computer network service systems are more inclined to the improvement of nec-essary functions such as data mining, collection and analysis. As such, it is more important for website information service to adapt to the characteristics of
[image:5.516.279.446.291.403.2]the information service of the website itself as exem-plified by Figure 5, Structural diagram of individual-ized information websites.
Figure 5. Structural diagram of individualized information websites.
With regards to computer network service, defects exist in the website performance evaluation indexes for China’s service sector. Table 1 shows the perfor-mance evaluation statistical index system for the Chi-nese government service websites in 2014 as an ex-ample.
[image:5.516.56.252.421.513.2]From the performance evaluation index system for the Chinese government websites in 2014, China’s computer service network system evaluation indexes are becoming more diversified. If the service quality of a computer network system is reflected from web-site layout alone, the result would be too generalized. Hence, in the entire performance evaluation system, “Information Disclosure” is a major index that has the highest weight, contributing 30% of the total weight, followed by “Interactive Communication”, which contributes 22% of the total weight, “Transaction Service”, which contributes 18% of the total, “Public Opinion Guidance”, which contributes 13% of the total, “Website Function & Management”, which con-tributes 12% of the total, and “New Media Applica-tion”, which contributes 5% of the total.
Table 1. Performance Evaluation Index System for Chinese Government Websites 2014.
Primary Index Secondary Index Weight Primary Index Secondary Index Weight
Information Disclosure Basic Information Disclosure 10 Transaction Service Base Service 10
Disclosure Obstacles 20 Key Service 8
Interactive Communi-cation
Government Consultation 5
Website Functions & Man-agement
Website Framework 2
Online Complaint 3 Website Search 2
Opinion Collection 6 Availability & Security 3
Online Interview 6 Accessibility Construction 3
Smart Interaction 2 Socialized Application 2
Public Opinion Guid-ance
Decision Interpretation 3
New Media Application Government Microblog 2
News Release 2 Government WeChat 3
Hotpoint Themes 4
User Satisfaction Data Open
User Satisfaction ——
Social Hotpoint Time Response 4 Data Open ——
3 CONCLUSIONS
With the gradual refinement of China’s computer network service systems, some service systems are gradually optimized. To adapt to the development of the times, how to improve overall competence by making use of big data transmission, how to share information in a timely manner and how to effectively secure important information have become a focus of concern. In big era data, computer network service systems are more inclined to the improvement of nec-essary functions such as data mining, collection and analysis.
In big data era, it is urgent to cultivate talents for big data information processing technology in line with the construction of computer network service systems. More efforts must be made in the construc-tion of a professional big data processing workforce to accommodate the revolution of computer network service systems in big data era. To cultivate talents for big data processing, it is important to master key utili-ty technologies including statistical data analysis, data processing and numerical analysis so as to better op-timize computer network service systems in big data background.
REFERENCES
[1] Zhu Zhiming. 2014. Try to talk about computer network service quality optimization method. Computer CD
Software and Application, 20: 114-115.
[2] Zhang Mingyu. 2014. Research on computer network service quality optimization method. Computer CD
Software and Application, 21: 106-107.
[3] Lin Chuang, Li Yin, & Wan Jianxiong. 2011. Optimiza-tion approaches for QoS in computer networks: a survey.
Chinese Journal of Computer, 01: 1-14.
[4] Gao Yue, & Wang Zhouqin. 2014. Summary on com-puter network service quality optimization method.
Guide for Sci-Tech Magazine, 30: 158+259.
[5] Liu Gaoyong, Wang Huiling, & Wu Jinhong. 2013. Analysis of competitive intelligence development in the era of big data. Document, Information & Knowledge, 02: 105-111.
[6] Wang Lei. 2013. An exploration on computer network service quality optimization method. Wireless Internet Technology, 01: 12.
[7] Zhu Jianping, Zhang Guijun, & Liu Xiaowei. 2014. Clarity of a philosophy of data analysis during the age of big data. Statistical Research, 02: 10-19.
[8] Shan Fengru. 2014. On the innovation of social capital cultivating mechanism in the era of big data – study on “dual network” penetration cultivating mechanism with life as media. China Soft Science, 06: 81-97.
[9] Zhen Feng, Qin Xiao, & Wang Bo. 2014. Human geog-raphy research and practical application in big data era.
Human Geography, 03: 1-6.
[10] Hou Shanshan. 2014. Research on accounting process restructuring in big data era. Qingdao: Ocean University of China.
[11] Zi Wucheng. 2013. Research on the evolution and con-struction of business ecosystem in big data era. Social Sciences, 12: 55-62.
[12] Shi Weimin. 2013. Personal information protection in big data era: predicament and path selection. Journal of
Information, 12: 155-159+154.
[13] Chen Lingzhe. 2014. Research on the differentiation of design innovation in the background of big data. Shanghai: East China University of Science & Technol-ogy.
[14] Wang Jinjin. 2015. The protection of intellectual prop-erty under the cloud computing service model. Shanghai: China University of Science and Technology, [15] Liu Yeting, & Wang Chunxiao. 2012. “Big Data”, new
behavior -analysis on government behavior pattern transformation in the “Big Data” background. Leader-ship Science, 35: 4-6.
[16] Wang Yunqing, & Liu Jiahui. 2013. Innovative E-government pattern in big data background. Journal
for Party and Administrative Cadres, 12: 59-64.
[17] Geng Dongxu. 2014. Analysis of the comput-er information processing technology in big data back-ground. Network Security Technology & Application, 01: 19+21.
[18] Xiao Ren. 2014. Challenge for mass work in big data background and countermeasures. Journal of the Party School of Shengli Oilfield, 05: 74-77.
[19] Li Dongmei. 2014. Study on government work pattern innovation and supporting measures in big data back-ground . Statistics & Consultation, 05: 15-16. [20] Chen Xiaoli. 2015. New form of media communication
in big data era. Journal of Changsha University, 01: 107-109.
[21] Yuan Chengfen. 2015. Development of library mobile data service in “Big Data Era”. The Library Journal of
Henan, 03: 130-132.
[22] Du Ganghu. 2015. On data mining technology in big da-ta background. Electronic Technology & Software Engi-neering, 14: 221.
[23] Chen Xiaohu. 2015. Analysis on the impact of cloud computing technology on media development in big data background. Information Communication, 07: 151-152. [24] Fang Yukun. Thoughts on the construction of traffic in-formation under the background of big data era. Science & Technology and Innovation, 2015, 16: 21+25. [25] Tu Cong. 2013. Data visualization application analysis
based on the era of large Data. Electronic Production, 05: 118.
[26] Lu Jingquan. 2013. Computer information processing technology in the era of big data. Information and Com-puter (Theoretic Edition), 06: 126-127.